


In today’s fast-paced digital landscape, businesses must have a deep understanding of their online performance to stay competitive and agile. Adobe Analytics Metrics offers a comprehensive, powerful toolset designed to solve this critical need. In this blog post, we will delve into the capabilities of Adobe Analytics Metrics, exploring its features, real-life applications, and the insights it can provide to drive better-informed business decisions.
For both novices and experts alike, this in-depth exploration will uncover the full potential of Adobe Analytics Metrics, demystifying complex data and illuminating essential strategies for achieving digital success.
Adobe Analytics Metrics You Should Know
1. Page Views
The number of times a web page is viewed by visitors.
2. Unique Visitors
The number of distinct individuals who visit a website during a specific time frame.
3. Visits
The number of individual website sessions initiated by all visitors during a specific time frame.
4. Time on Site
The average amount of time spent by visitors on the website within a specific time frame.
5. Bounce Rate
The percentage of single-page visits, meaning the visitor left the website after viewing just one page.
6. Exit Rate
The percentage of times a page was the last one viewed during a visit to the website.
7. Pages per Visit
The average number of pages viewed within a single visit.
8. Entry Pages
The first pages that users visit when they enter the website.
9. Exit Pages
The last pages that users visit before leaving the website.
10. Pathing Analysis
A report that shows the navigation path taken by users through the site, helping to identify the most common paths and drop-off points.
11. Click-through Rate (CTR)
The percentage of impressions that resulted in a click on a given element (e.g., an ad or a link).
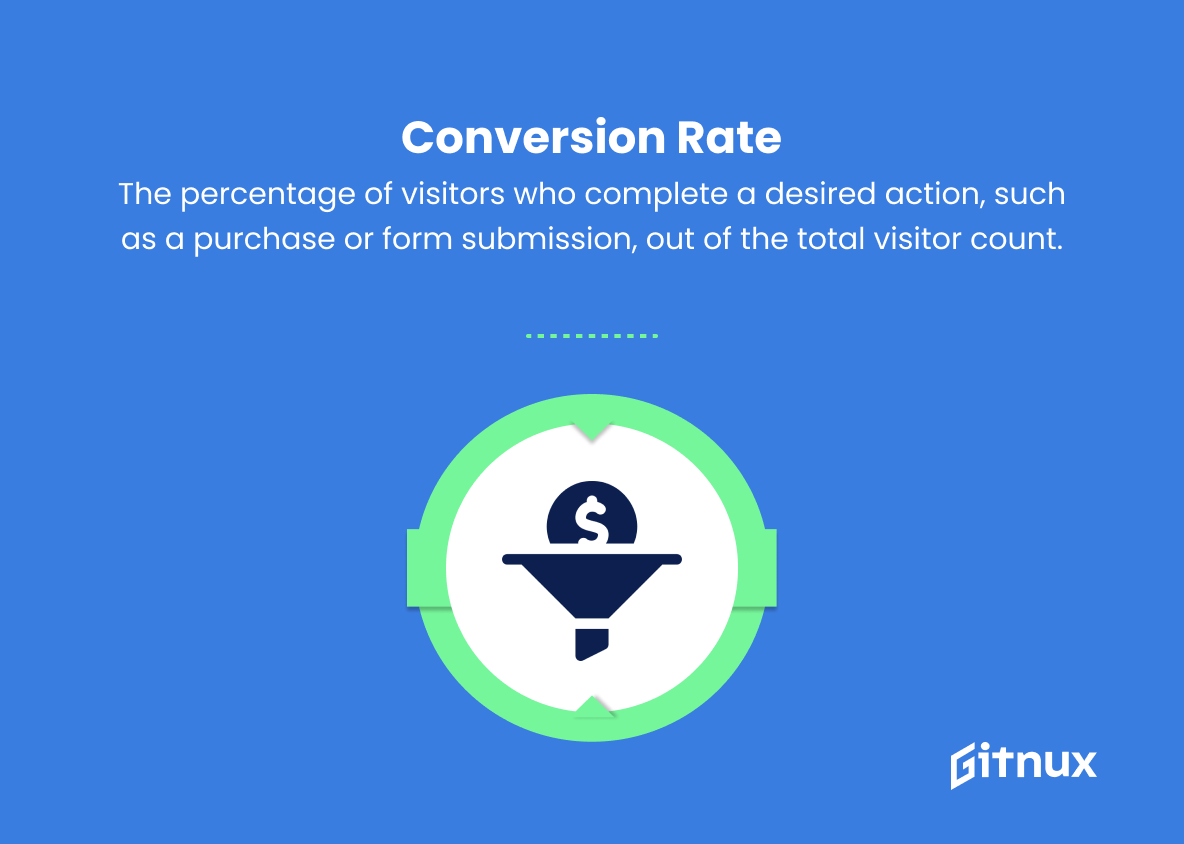
12. Conversion Rate
The percentage of visitors who complete a desired action, such as a purchase or form submission, out of the total visitor count.
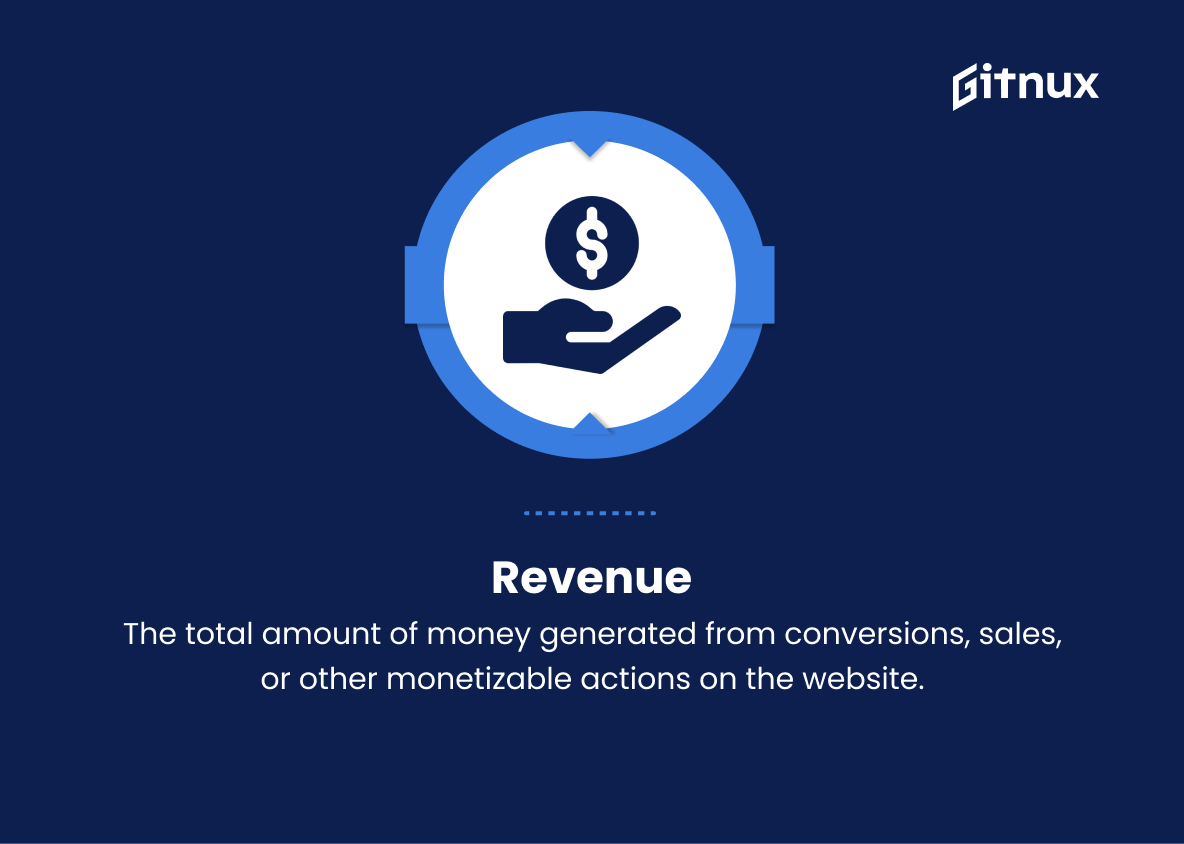
13. Revenue
The total amount of money generated from conversions, sales, or other monetizable actions on the website.
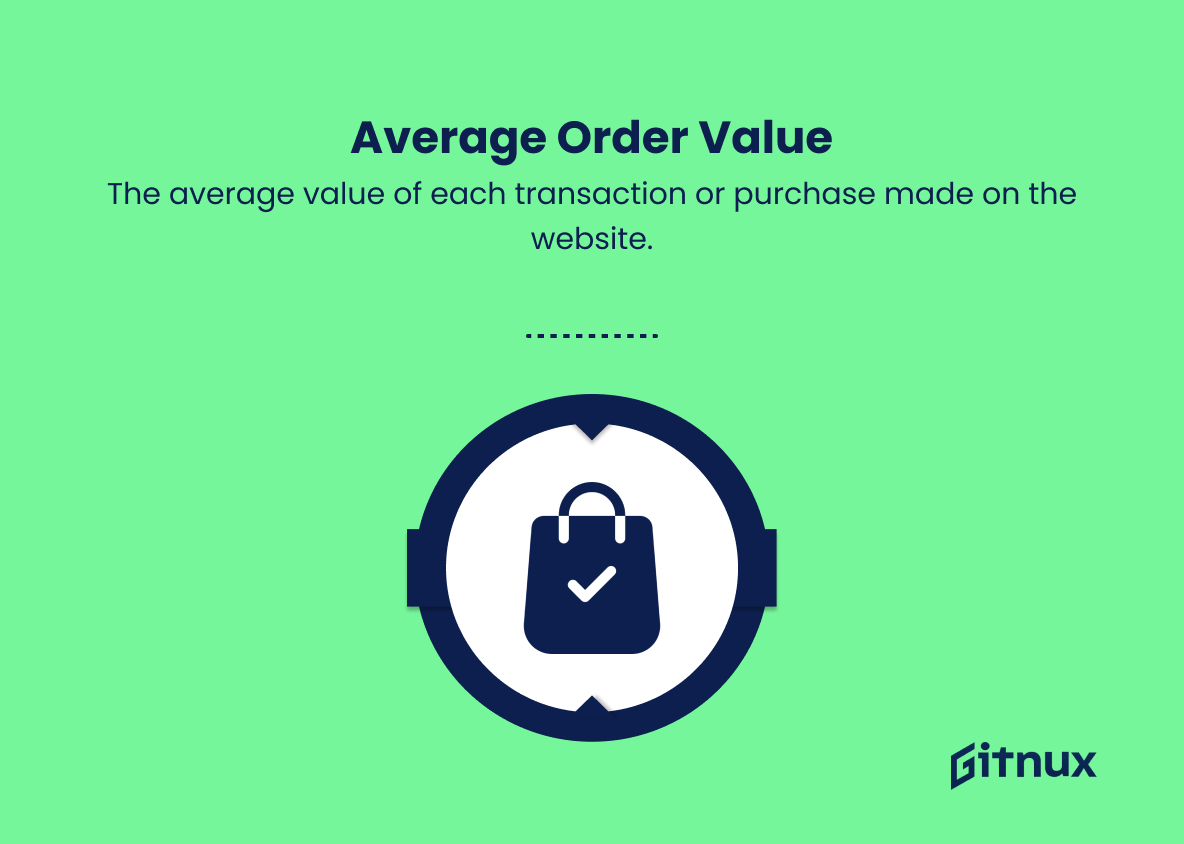
14. Average Order Value (AOV)
The average value of each transaction or purchase made on the website.
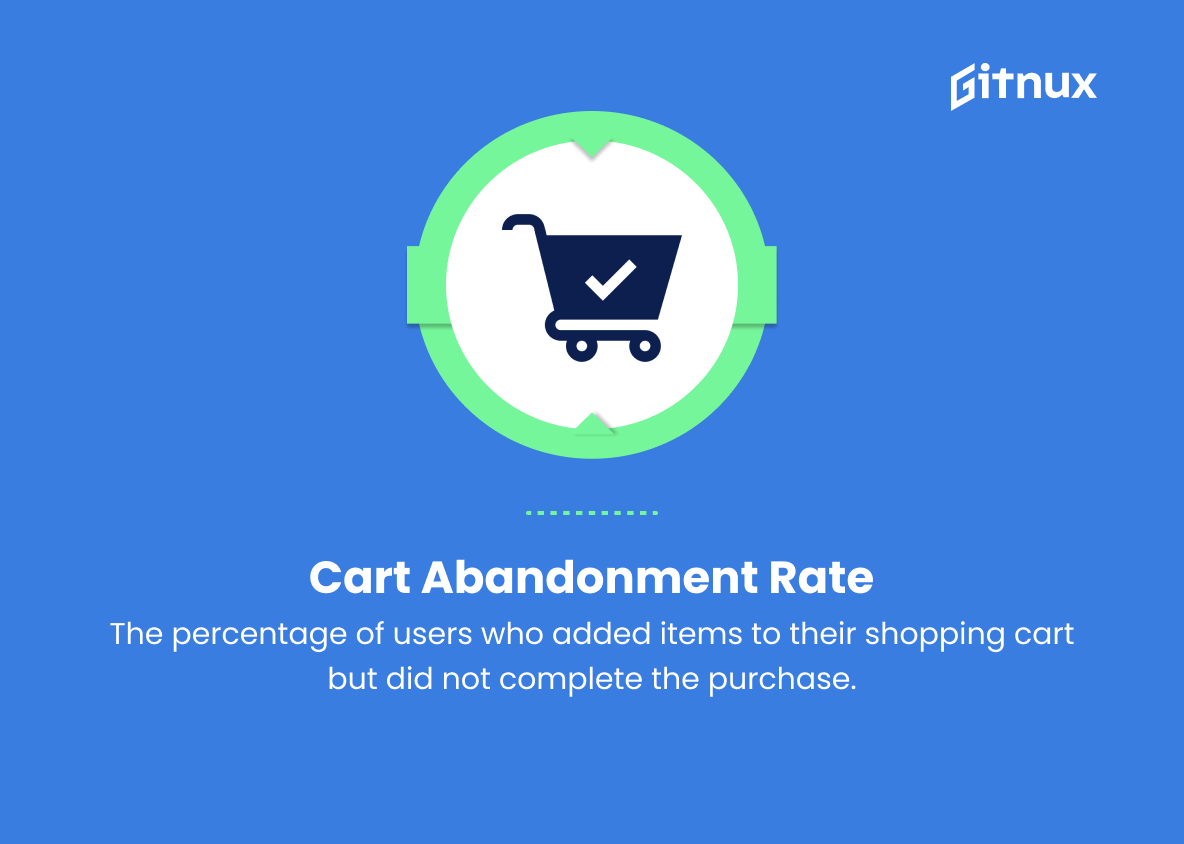
15. Cart Abandonment Rate
The percentage of users who added items to their shopping cart but did not complete the purchase.
16. Cost per Acquisition (CPA)
The total marketing cost divided by the number of conversions, measuring the effectiveness of marketing spend in driving desired actions.
17. Return on Investment (ROI)
A financial metric that calculates the profit gained from investments in marketing or advertising campaigns.
18. Event Tracking
The measurement of specific user interactions with website elements, such as downloads, video views, or button clicks.
19. Custom Variables
User-defined metrics that can be used to track and analyze specific data points not captured by default metrics.
20. Traffic Sources
The different channels or sources that direct visitors to the website, such as organic search, paid search, social media, or referrals.
21. Device and Browser Metrics
Data regarding the devices, browsers, operating systems, and screen resolutions that visitors use to access the website, aiding in optimizing site performance and usability.
22. Geolocation Metrics
Visitor data based on geographic location, helping to understand regional preferences and target marketing efforts.
Adobe Analytics Metrics Explained
Adobe Analytics Metrics are essential in understanding and tracking the performance of a website, as they provide valuable insights into the behavior of visitors and the effectiveness of marketing efforts. Metrics such as Page Views and Unique Visitors help gauge the overall popularity of the site, while others like Time on Site and Bounce Rate reveal visitor engagement levels. Metrics like Entry Pages, Exit Pages, and Pathing Analysis spotlight crucial navigational points throughout the user’s journey.
Meanwhile, Click-through Rate, Conversion Rate, and Revenue showcase the impact of advertising and marketing campaigns, and Average Order Value, Cart Abandonment Rate, and Cost per Acquisition delve into the website’s overall sales performance. Return on Investment is vital for evaluating the financial outcomes of marketing campaigns, and Event Tracking and Custom Variables allow for granular analysis of specific user interactions. Furthermore, understanding Traffic Sources, Device and Browser Metrics, and Geolocation Metrics enables businesses to optimize their websites for various channels, devices, and regions, ultimately enhancing the user experience and improving overall performance.
Conclusion
In conclusion, Adobe Analytics Metrics offer an extensive range of capabilities to provide comprehensive insights and effective measurement of your digital marketing efforts. By harnessing the power of these metrics, businesses can effectively optimize campaigns, make data-driven decisions, and understand customer behavior on a deeper level. The continuous improvement in Adobe Analytics, along with the integration of artificial intelligence, further elevates these capabilities, which are crucial to maintaining a competitive edge in today’s ever-changing digital landscape.
Always remember, the key to success with Adobe Analytics Metrics lies in identifying the right metrics for your unique goals and consistently monitoring and analyzing performance to drive superior results.
