
In today’s constantly evolving business landscape, organizations are striving for increased efficiency and productivity in order to maintain a competitive edge. One of the most crucial aspects of achieving this success lies in understanding and optimizing workflow processes. This requires the meticulous use of workflow metrics, which provide valuable insights into the performance and effectiveness of various tasks and teams across an organization.
In this blog post, we will delve deep into the world of workflow metrics, discussing their significance in detail, exploring the various types of metrics that can be employed, and sharing valuable tips on how to best utilize these metrics to drive continuous improvement in your organization. Join us as we embark on a journey to unlock the full potential of workflow metrics and transform your organization’s performance.
Workflow Metrics You Should Know
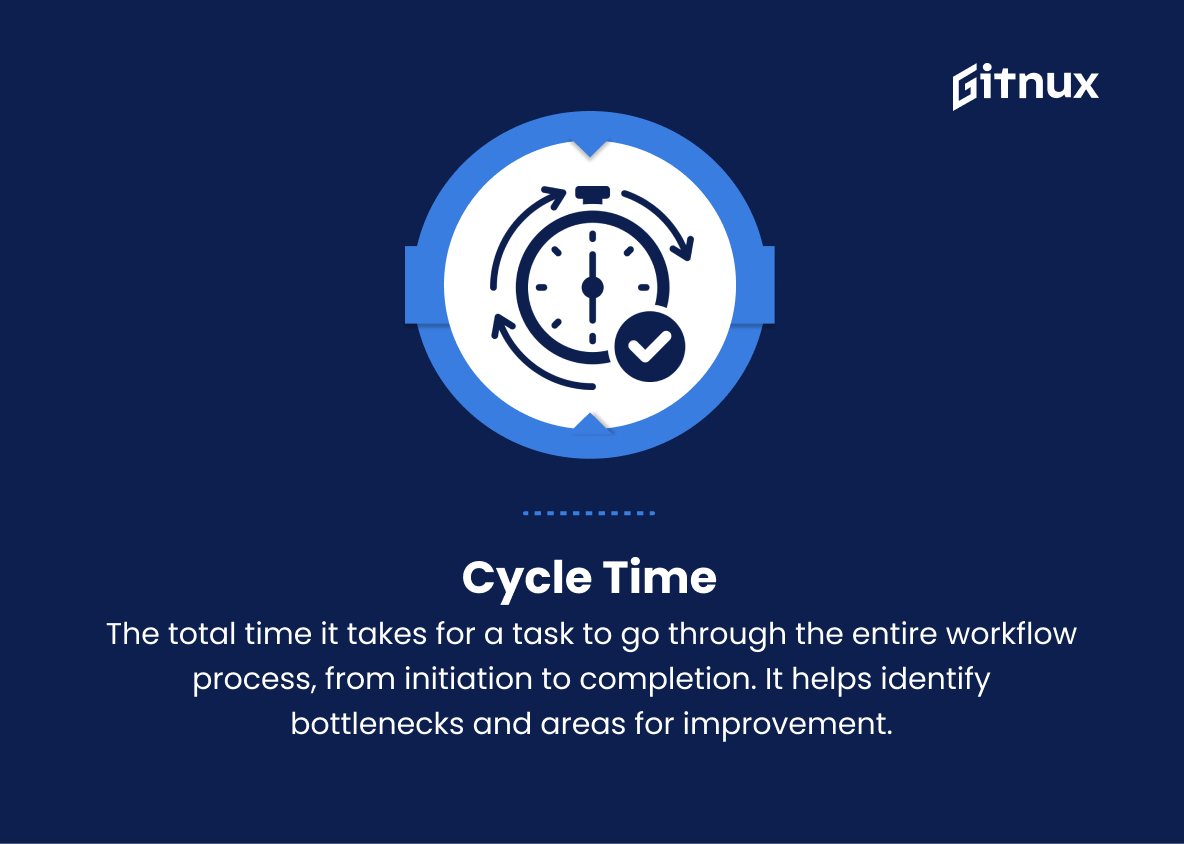
1. Cycle Time
The total time it takes for a task to go through the entire workflow process, from initiation to completion. It helps identify bottlenecks and areas for improvement.
2. Lead Time
The total time it takes for a task to be completed from the moment it’s requested or conceived until it’s finished. It includes both the waiting time before work starts and the time taken to complete the task.
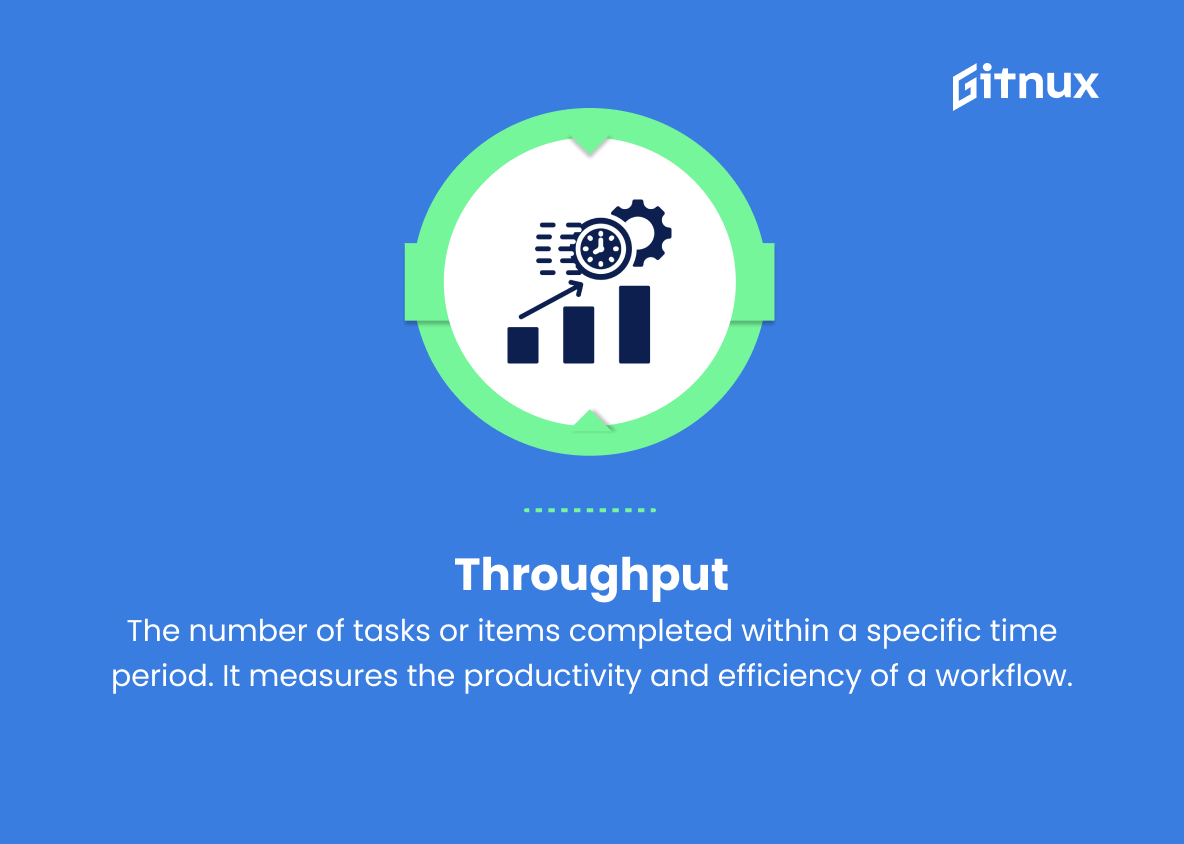
3. Throughput
The number of tasks or items completed within a specific time period. It measures the productivity and efficiency of a workflow.
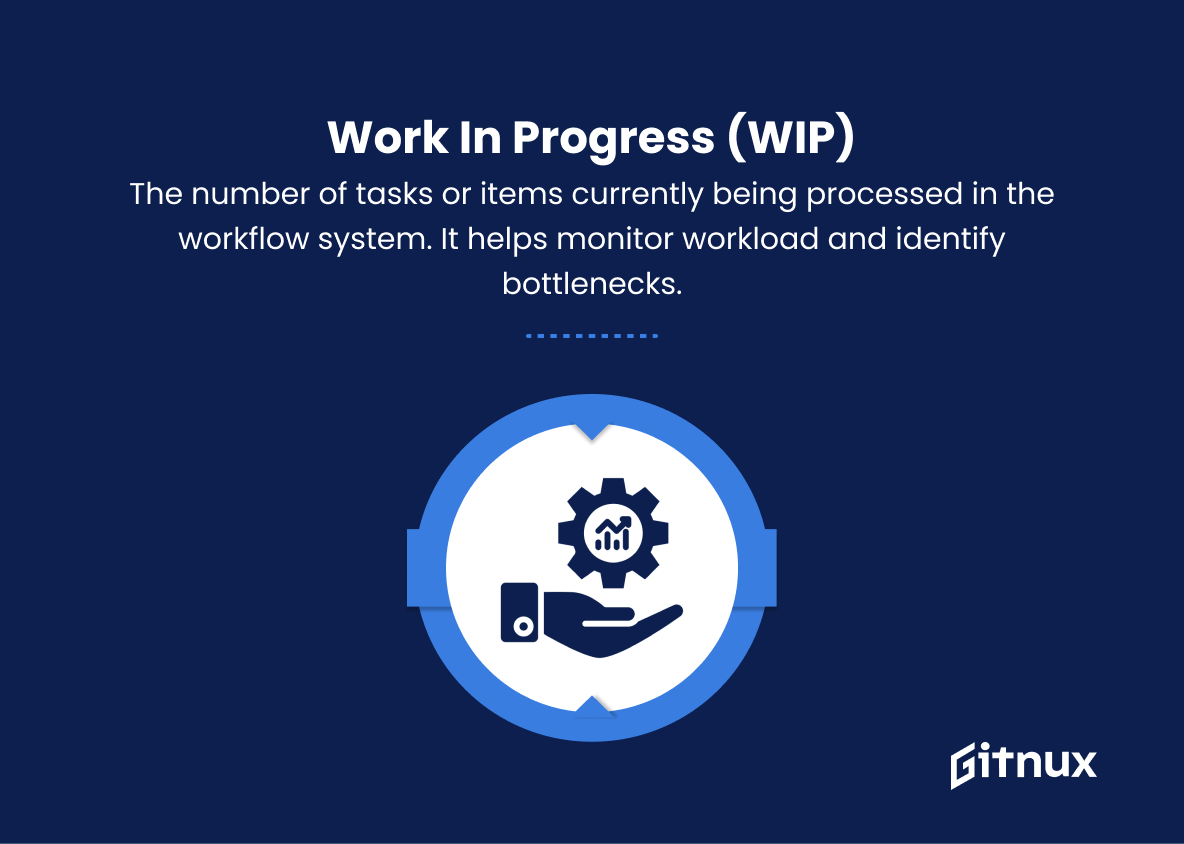
4. Work in Progress (WIP)
The number of tasks or items currently being processed in the workflow system. It helps monitor workload and identify bottlenecks.
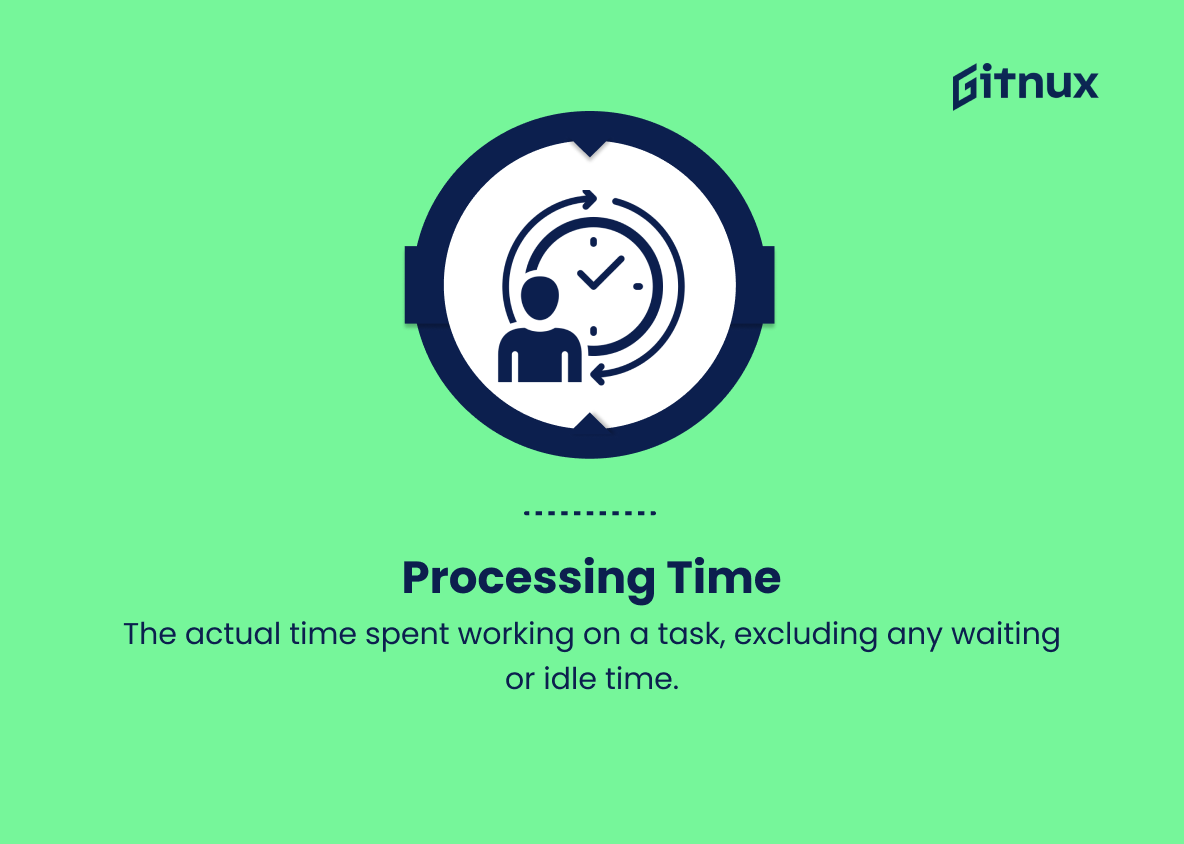
5. Processing Time
The actual time spent working on a task, excluding any waiting or idle time.
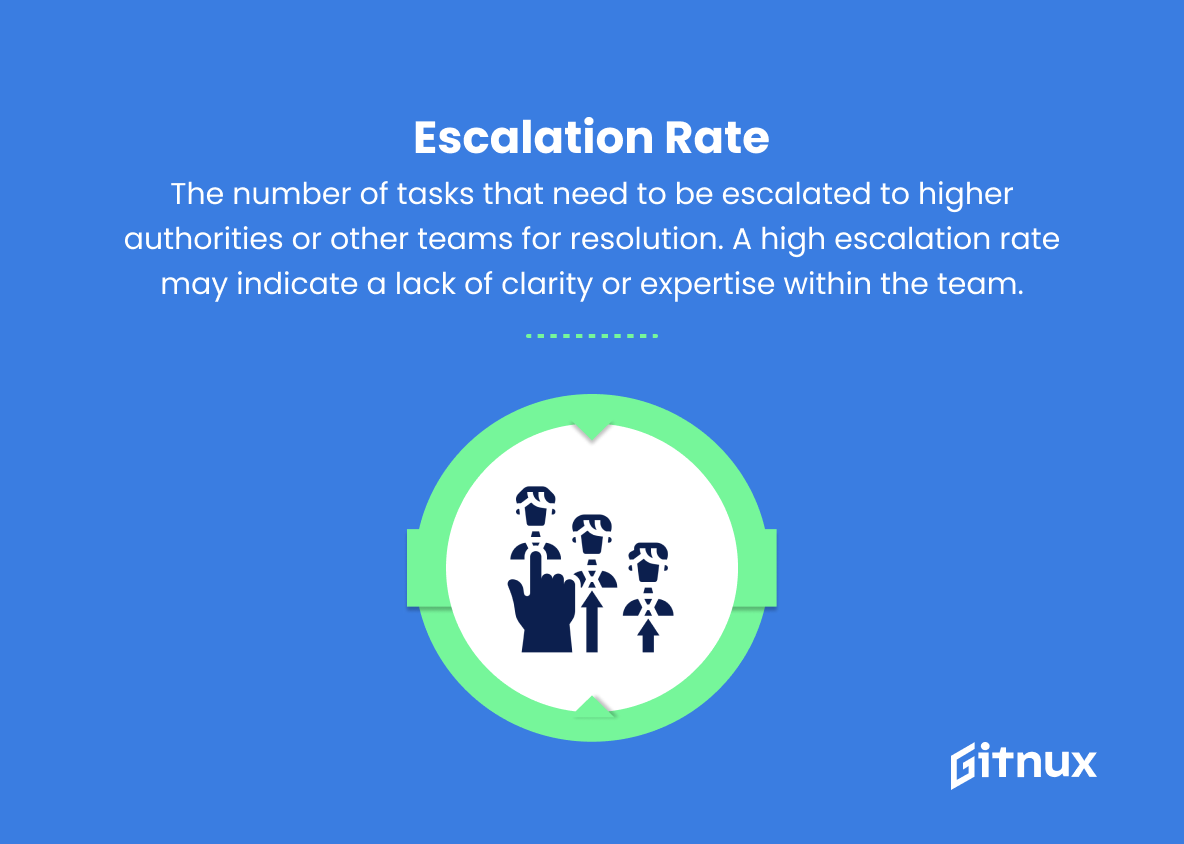
6. Escalation Rate
The number of tasks that need to be escalated to higher authorities or other teams for resolution. A high escalation rate may indicate a lack of clarity or expertise within the team.
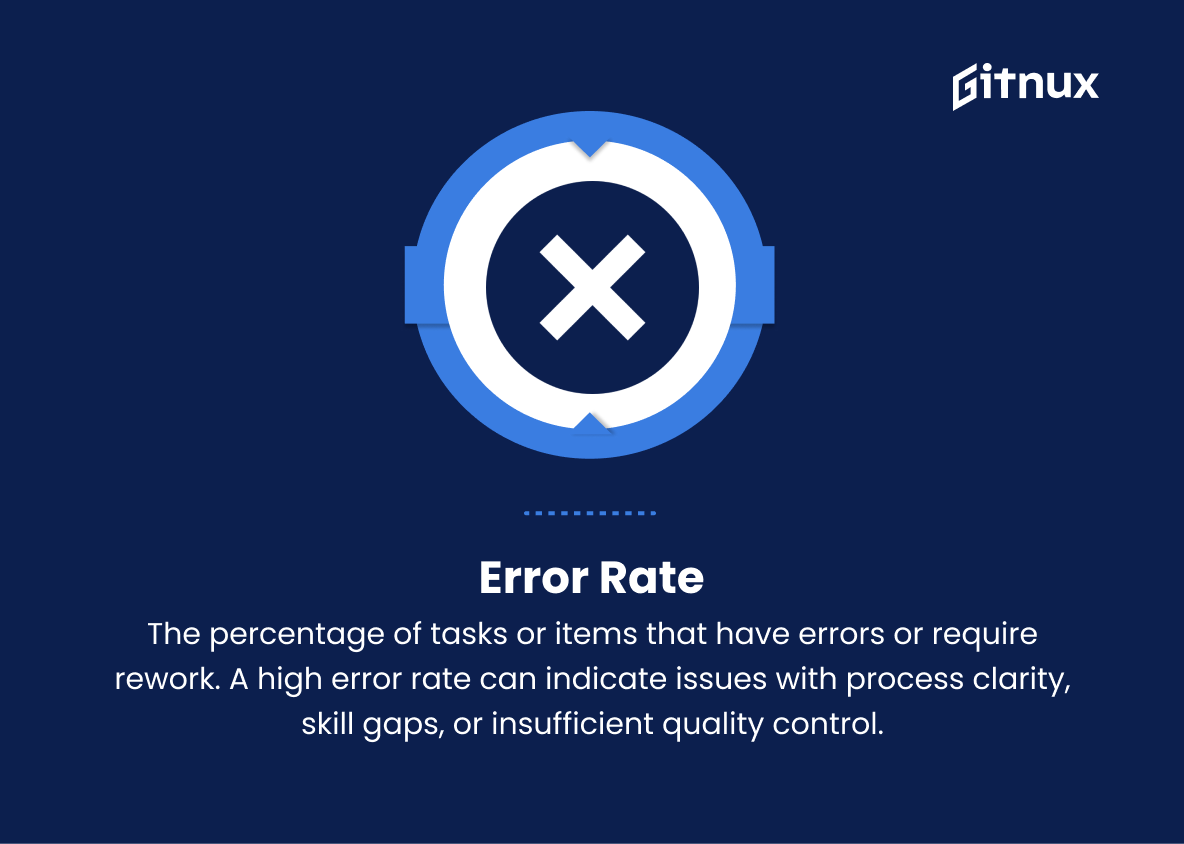
7. Error Rate
The percentage of tasks or items that have errors or require rework. A high error rate can indicate issues with process clarity, skill gaps, or insufficient quality control.
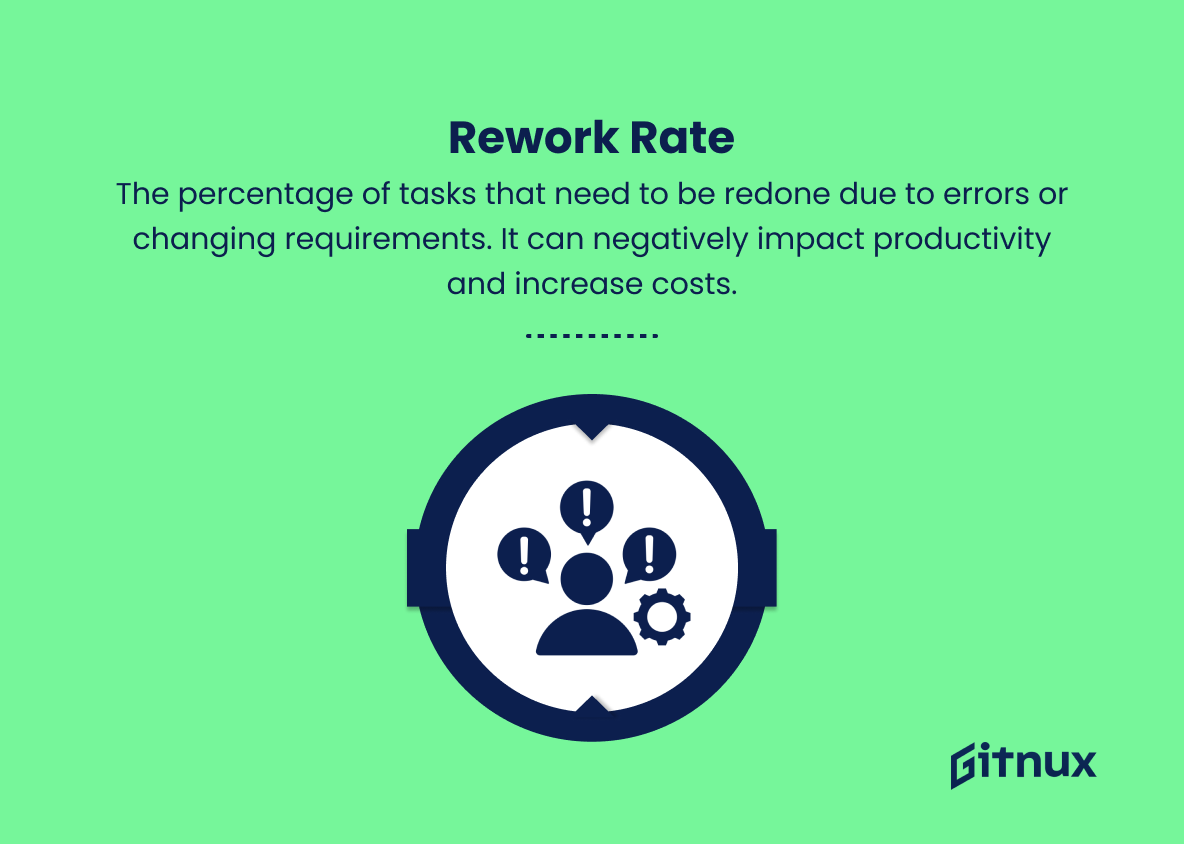
8. Rework Rate
The percentage of tasks that need to be redone due to errors or changing requirements. It can negatively impact productivity and increase costs.
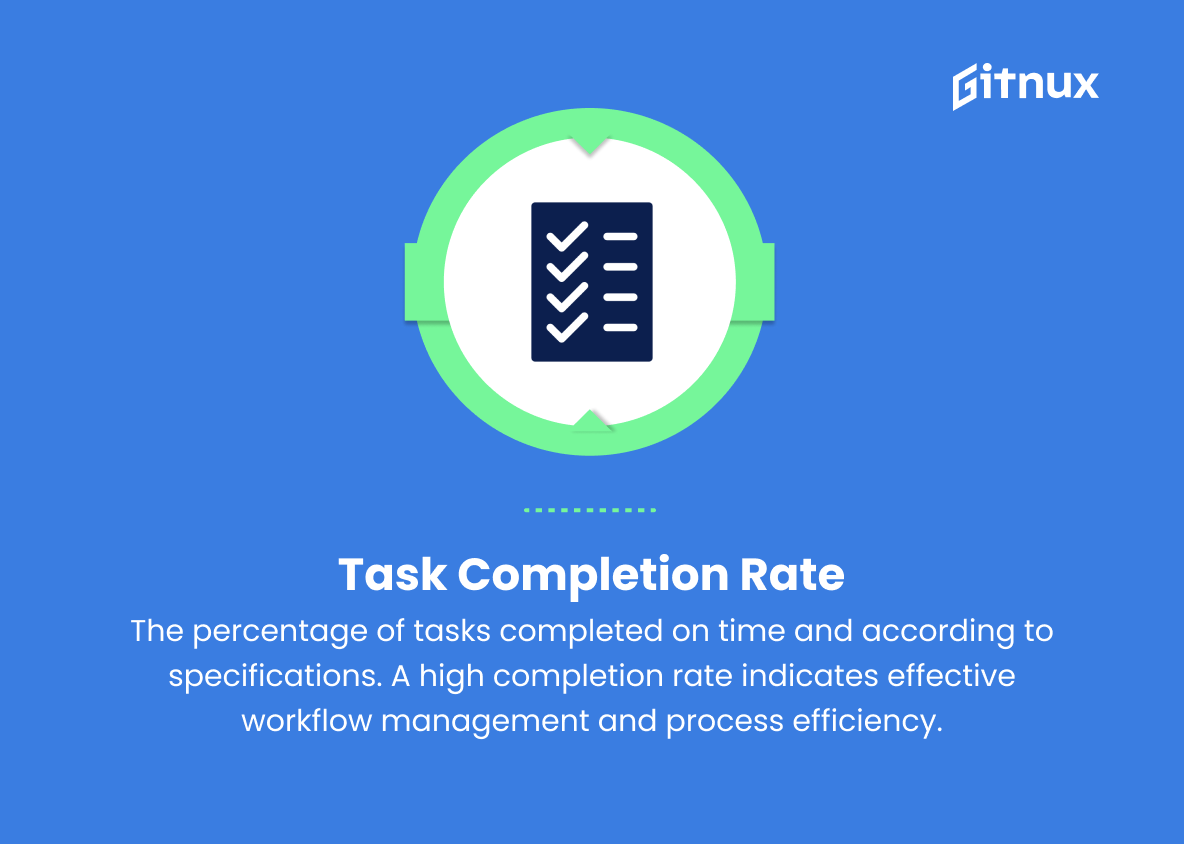
9. Task Completion Rate
The percentage of tasks completed on time and according to specifications. A high completion rate indicates effective workflow management and process efficiency.
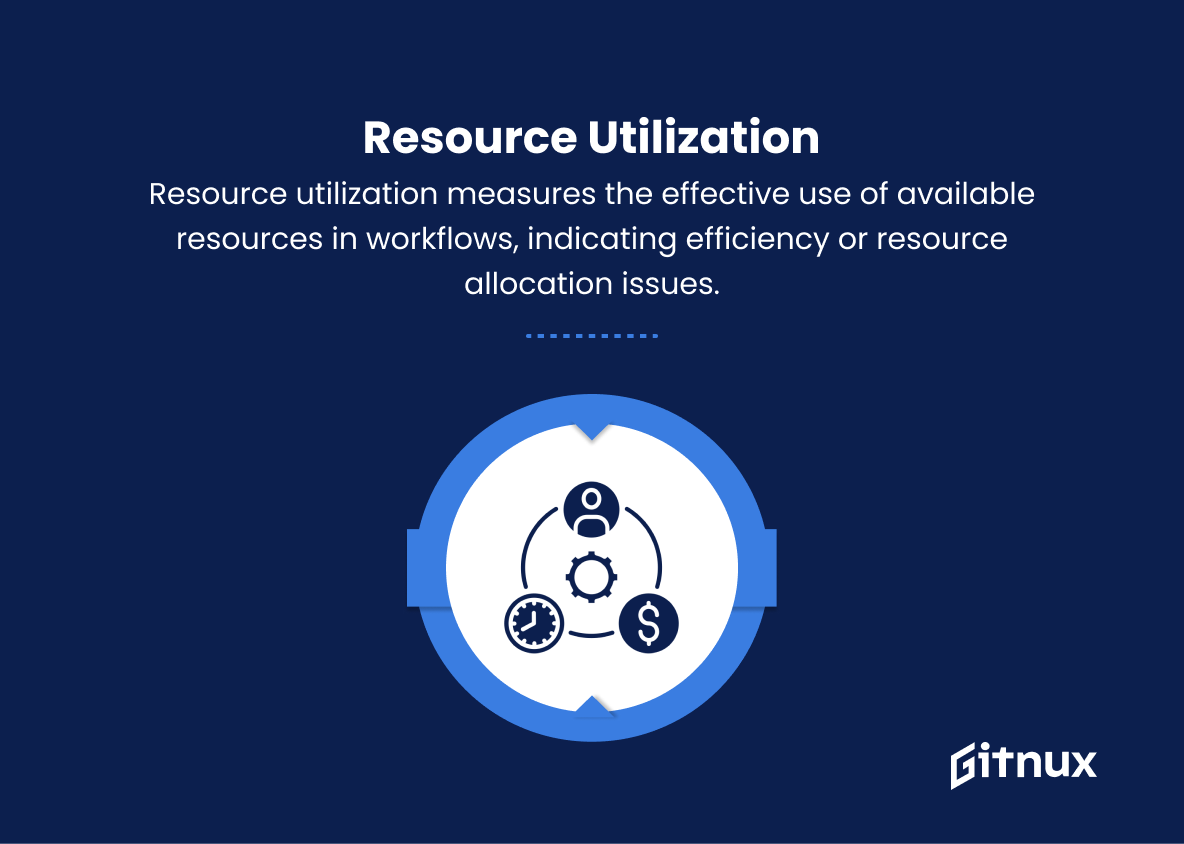
10. Resource Utilization
The percentage of available resources (time, manpower, equipment) being utilized effectively in the workflow process. High resource utilization may indicate an efficient use of resources, while low utilization suggests underused or misallocated resources.
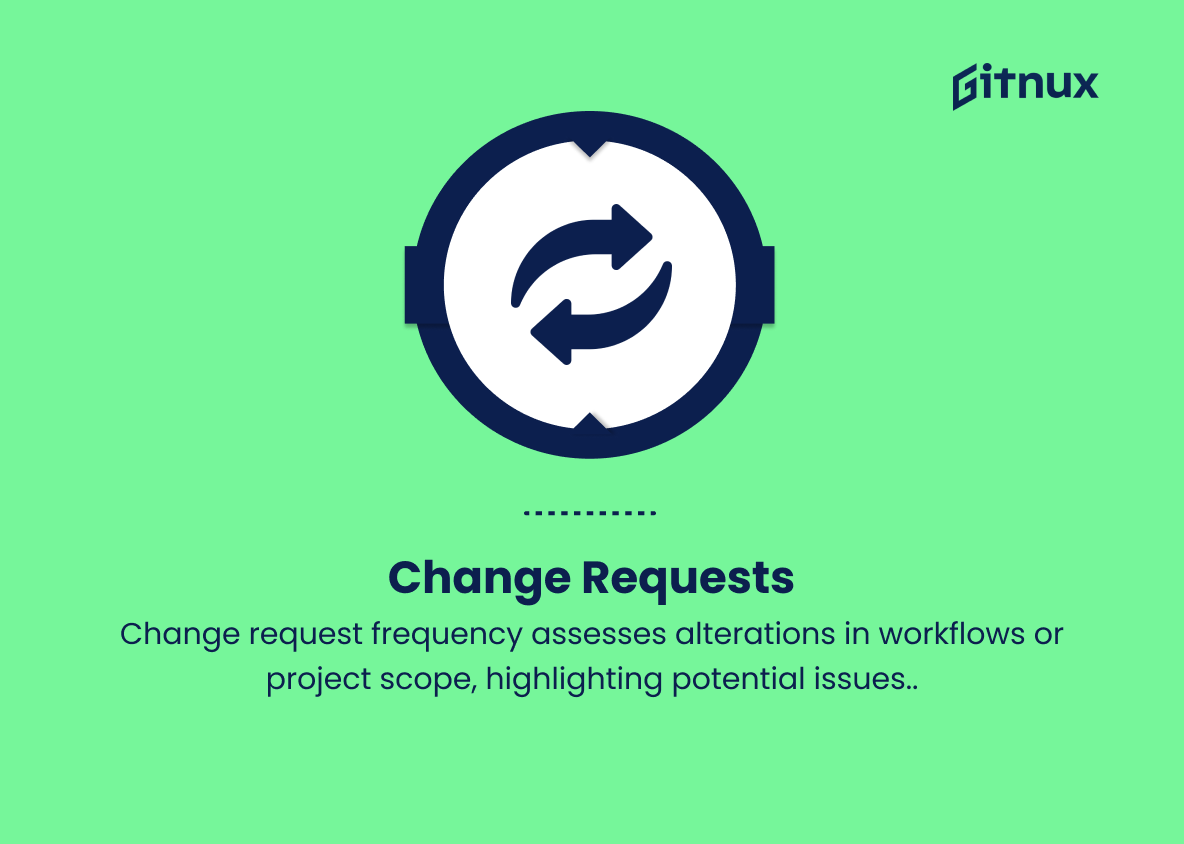
11. Change Requests
The number of requests for changes to the workflow, process, or project scope. A high number of change requests may indicate unclear requirements, scope creep, or communication issues.
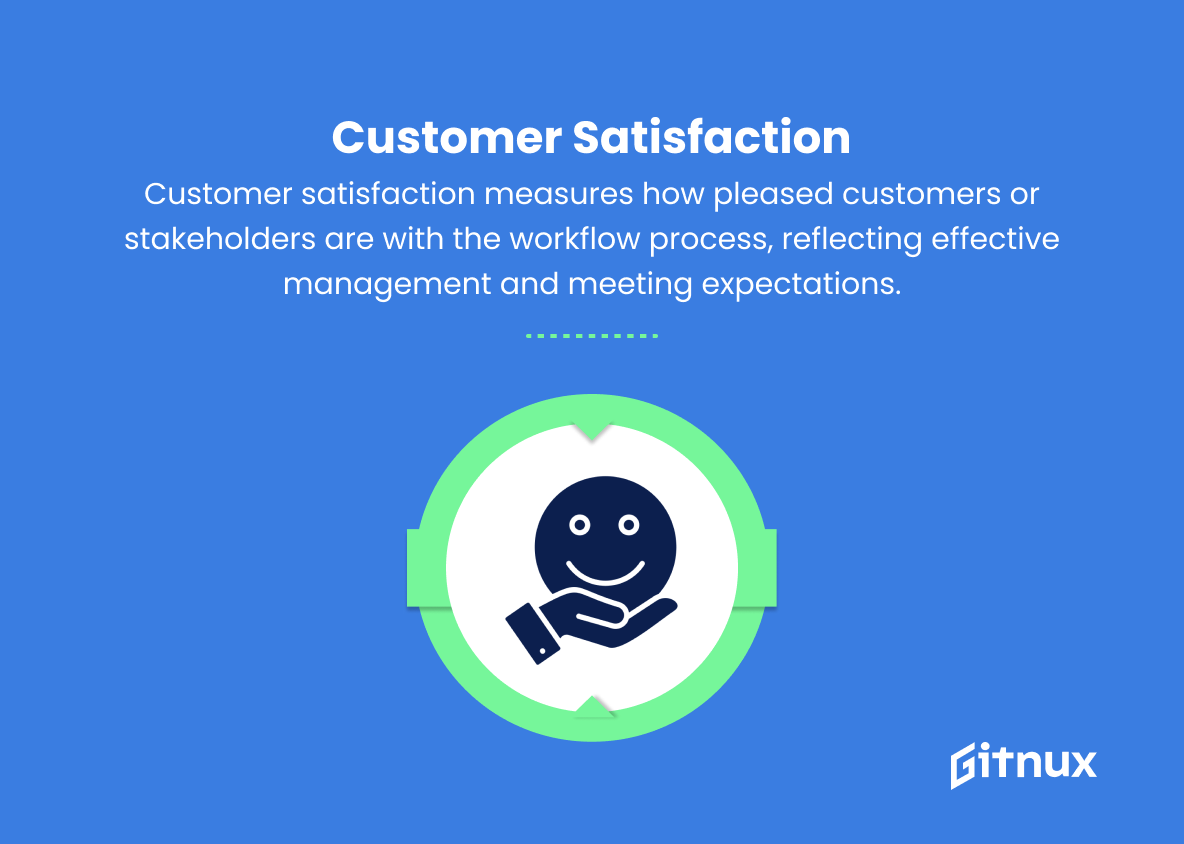
12. Customer Satisfaction
The level of satisfaction expressed by customers or stakeholders regarding the output and overall experience of the workflow process. High customer satisfaction is an indicator of effective workflow management and meeting customer expectations.
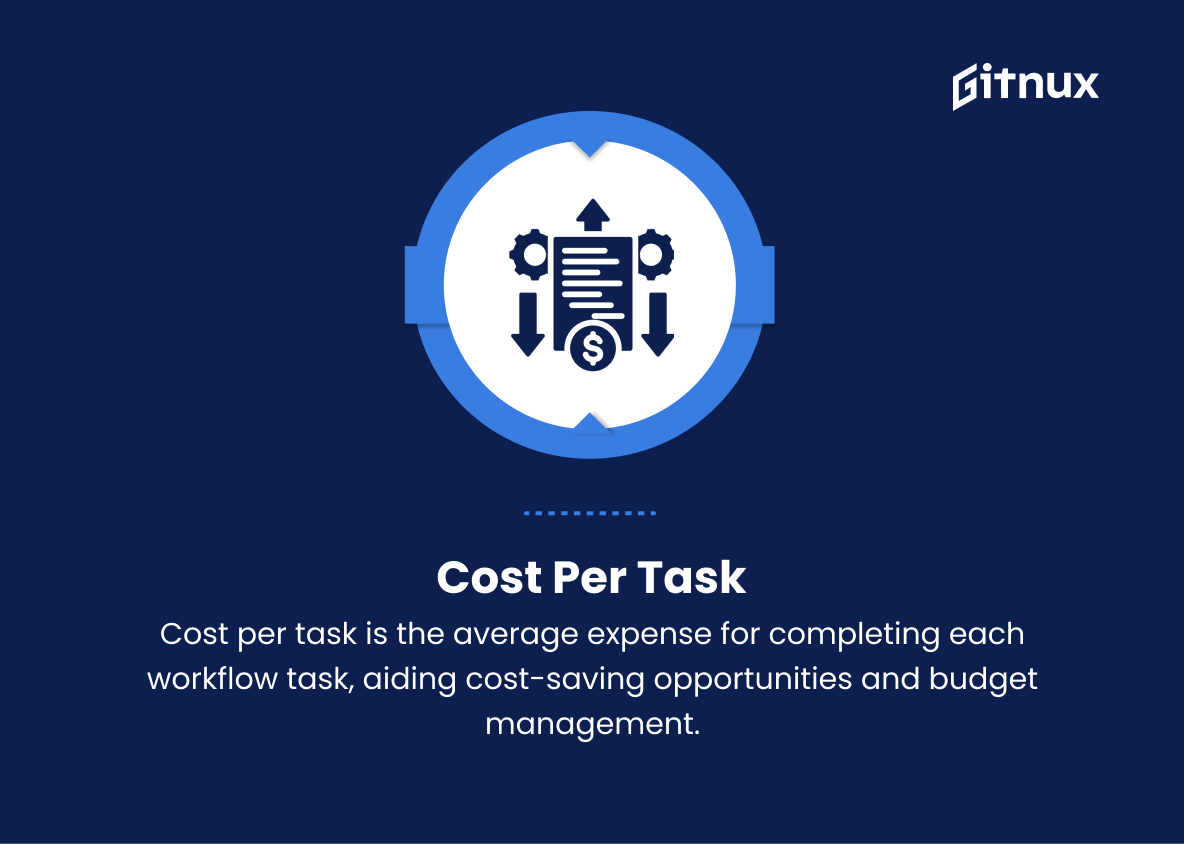
13. Cost per Task
The average cost incurred for completing each task in the workflow. This includes labor, materials, and any other resources involved in task completion. Monitoring cost per task can help identify cost-saving opportunities and improve budget management.
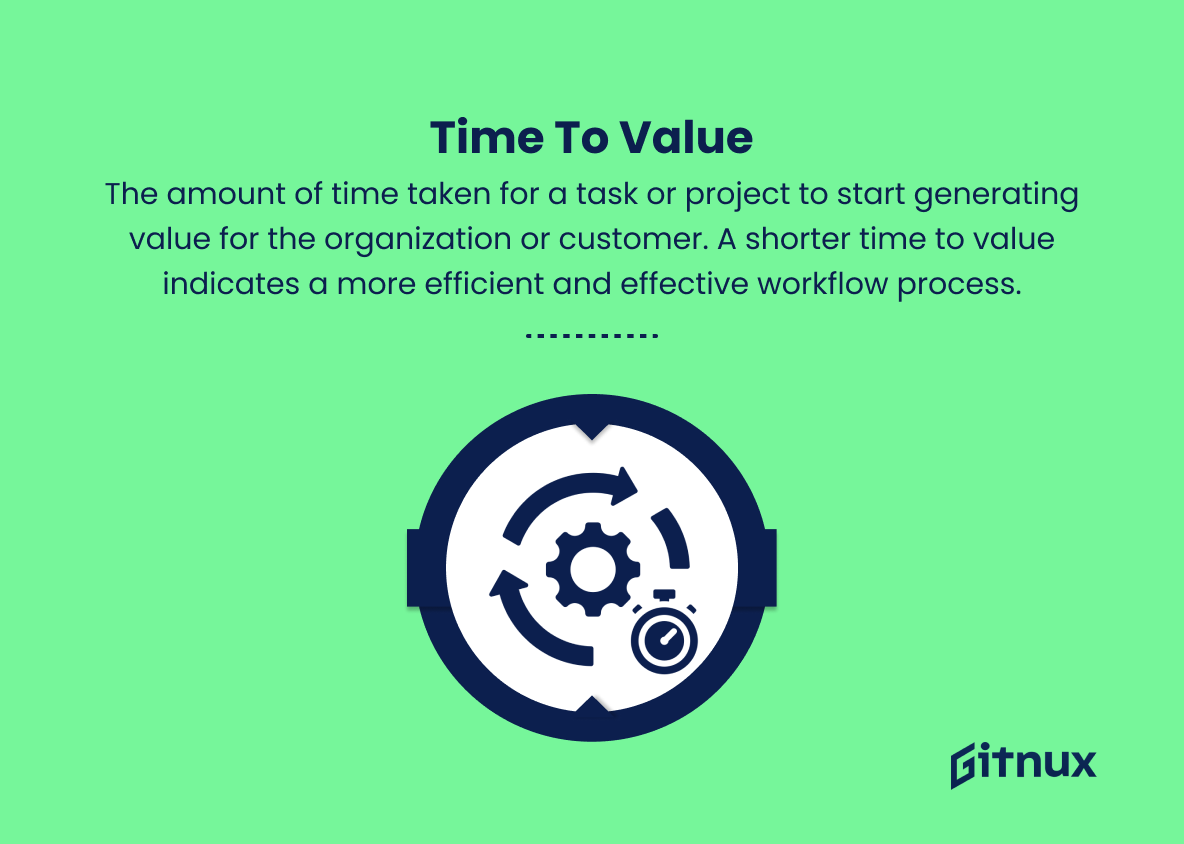
14. Time to Value
The amount of time taken for a task or project to start generating value for the organization or customer. A shorter time to value indicates a more efficient and effective workflow process.
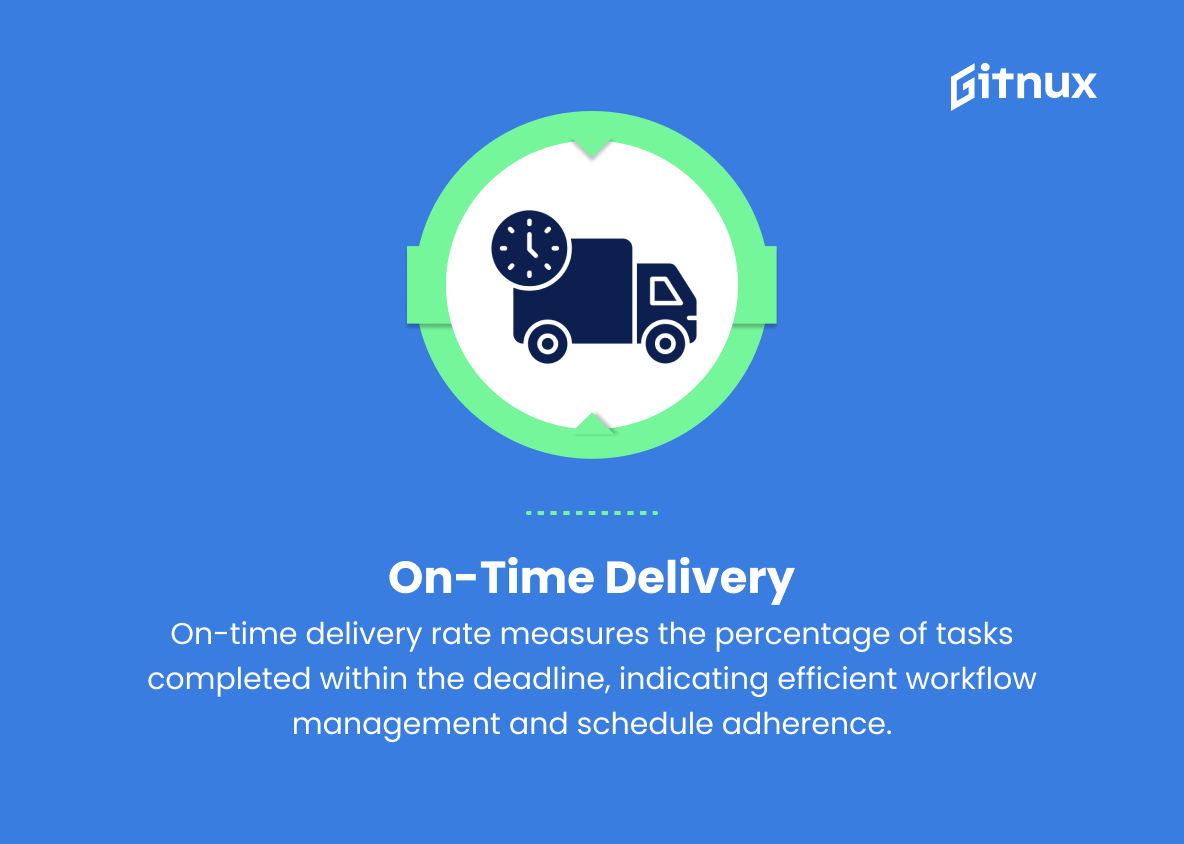
15. On-time Delivery
The percentage of tasks or deliverables completed and delivered within the specified deadline. High on-time delivery rates indicate efficient workflow management and adherence to project schedules.
Workflow Metrics Explained
Cycle Time, Lead Time, Throughput, Work in Progress (WIP), Processing Time, Escalation Rate, Error Rate, Rework Rate, Task Completion Rate, Resource Utilization, Change Requests, Customer Satisfaction, Cost per Task, Time to Value, and On-time Delivery are all critical workflow metrics that provide insights into the efficiency and effectiveness of a workflow process.
These metrics help organizations identify bottlenecks, areas for improvement, and cost-saving opportunities, which ultimately lead to better project management and higher customer satisfaction. By monitoring and analyzing these metrics, organizations can optimize their workflow processes, improve productivity, reduce errors and rework, and ensure resources are allocated effectively. Ultimately, understanding and utilizing these workflow metrics helps organizations deliver projects on time and within budget, generating value for both the organization and its customers.
Conclusion
In summary, workflow metrics are an invaluable tool for businesses and organizations that aim to optimize their operations, streamline processes, and enhance overall performance. By identifying, measuring, and evaluating key metrics, decision-makers can gain insights into their workflows and uncover bottlenecks, inefficiencies, and areas for improvement.
Implementing targeted strategies based on these insights will ultimately lead to greater productivity, a higher quality of work, and increased satisfaction among team members. Therefore, it is essential for businesses to invest time and resources in understanding and employing workflow metrics, as they hold the key to unlocking an organization’s full potential.
