Developer productivity is crucial for software project success. This blog post covers the significance, types, methods, best practices, potential challenges, and tips to improve productivity. Gain valuable insights to revitalize your approach, elevate performance, and contribute to software development growth and excellence.
Developer Productivity Metrics You Should Know
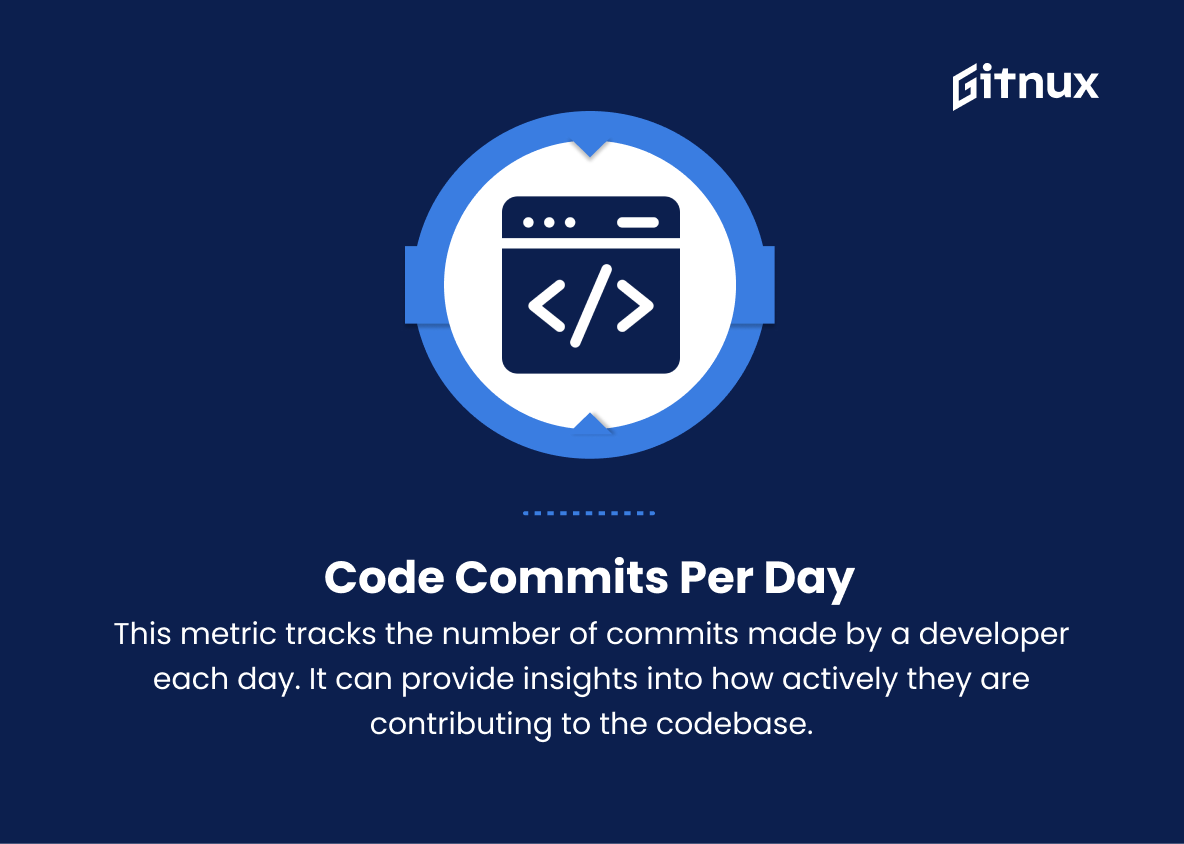
1. Code commits per day
This metric tracks the number of commits made by a developer each day. It can provide insights into how actively they are contributing to the codebase.
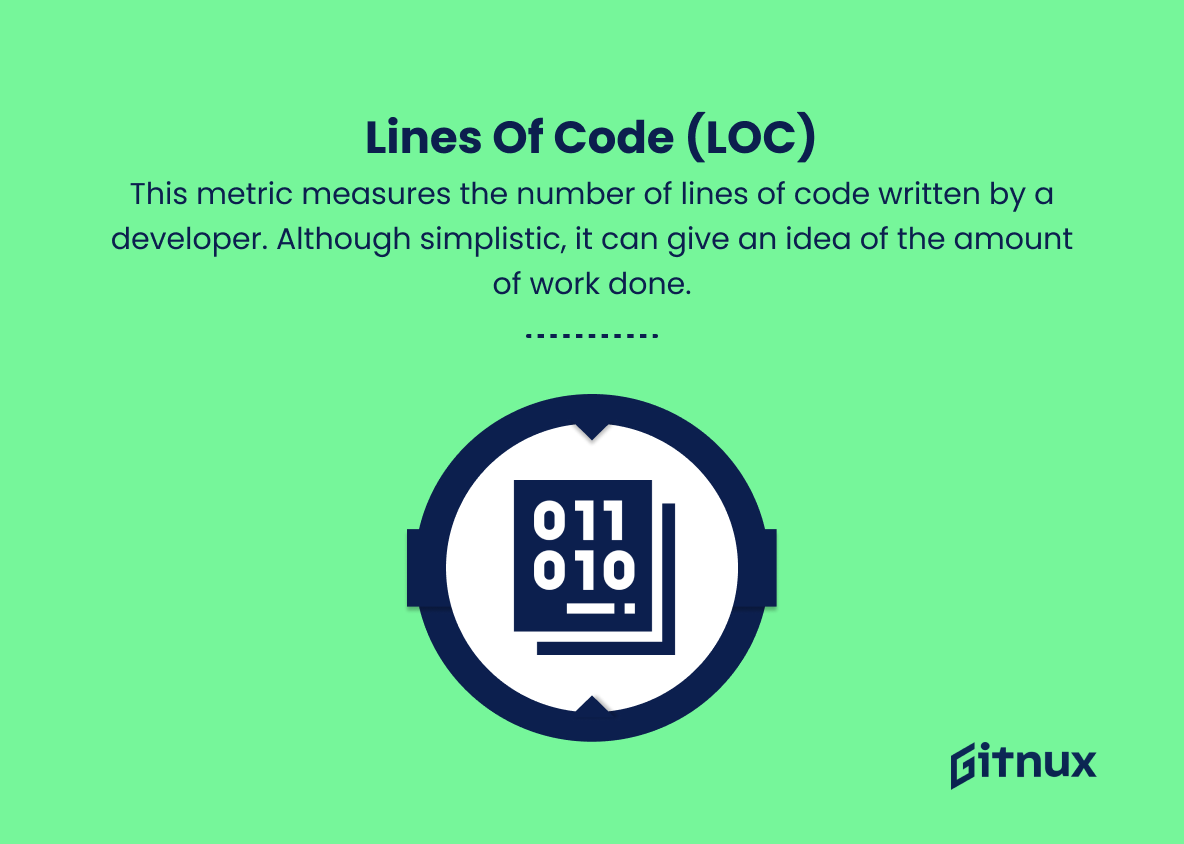
2. Lines of code (LOC)
This metric measures the number of lines of code written by a developer. Although simplistic, it can give an idea of the amount of work done.
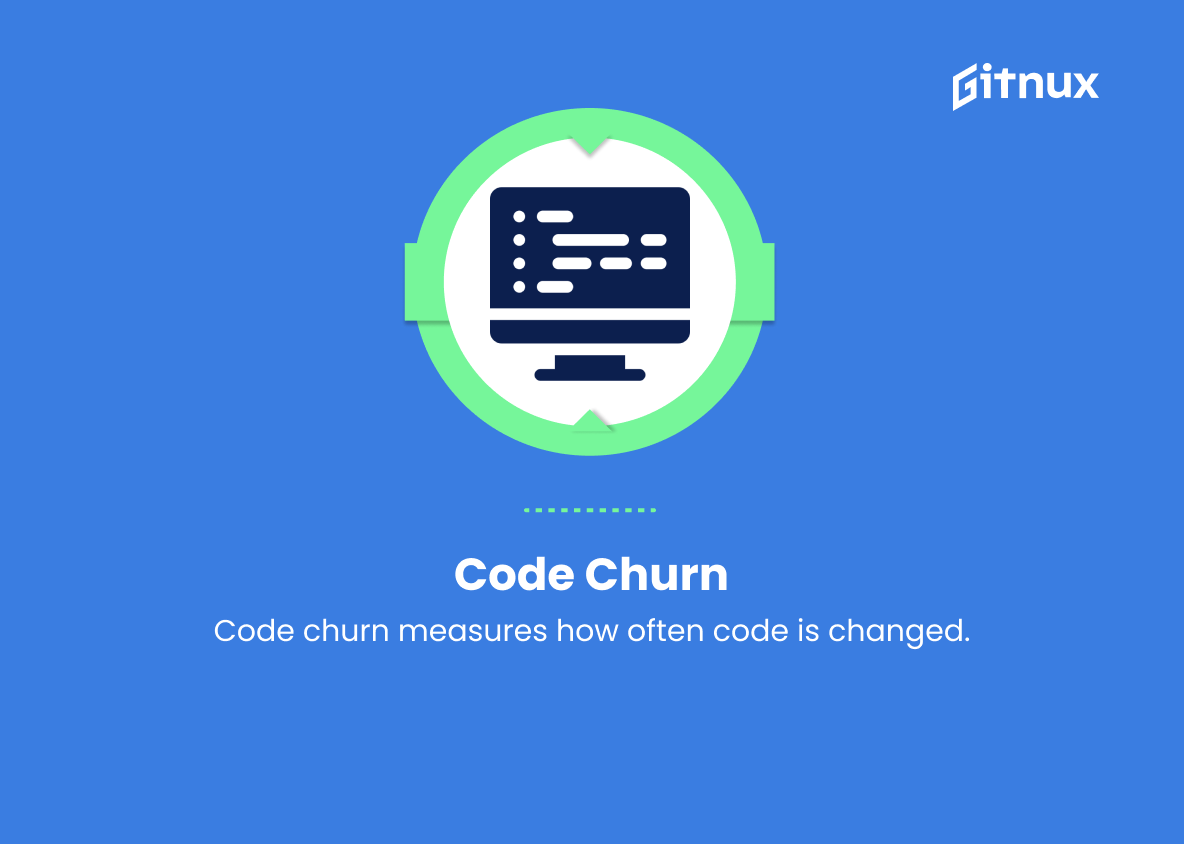
3. Code churn
Code churn measures the frequency of modifications to the code, including additions, deletions, and modifications. High code churn may indicate inefficiencies in the development process or improper planning.
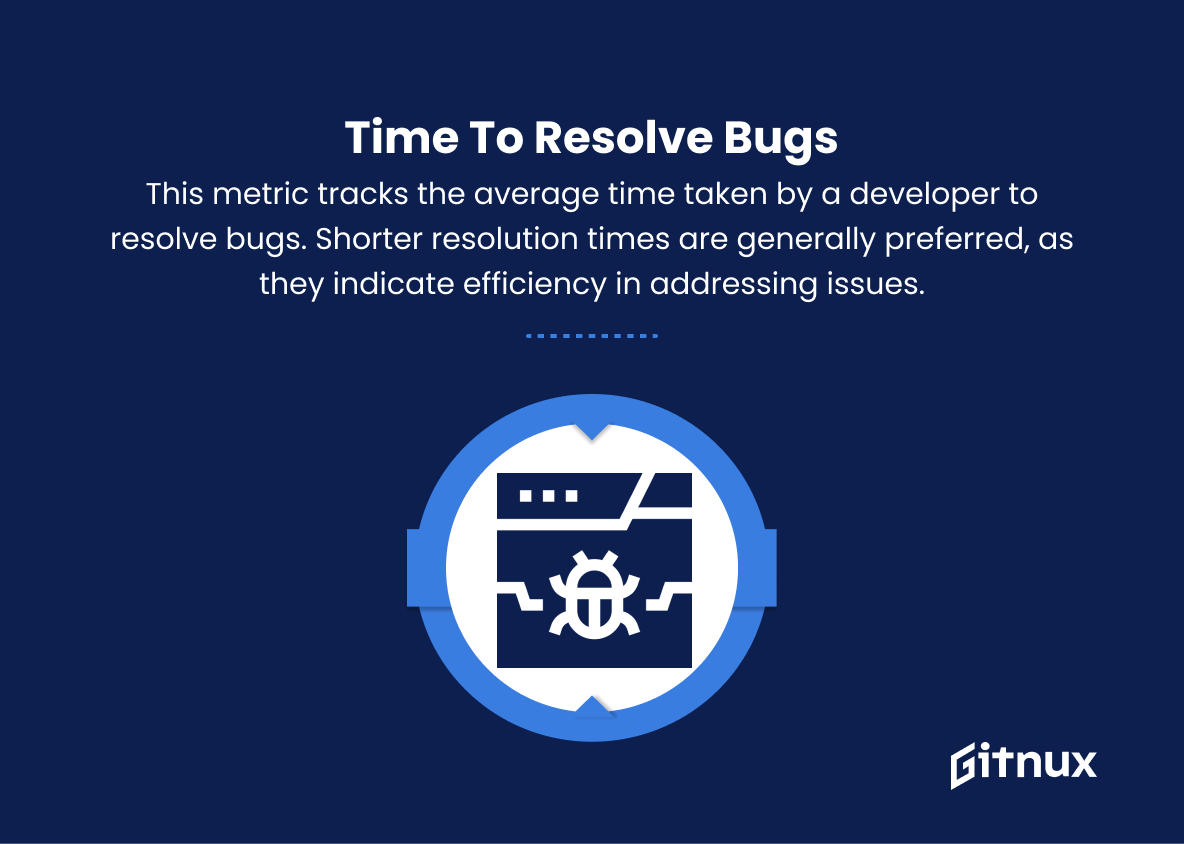
4. Time to resolve bugs
This metric tracks the average time taken by a developer to resolve bugs. Shorter resolution times are generally preferred, as they indicate efficiency in addressing issues.
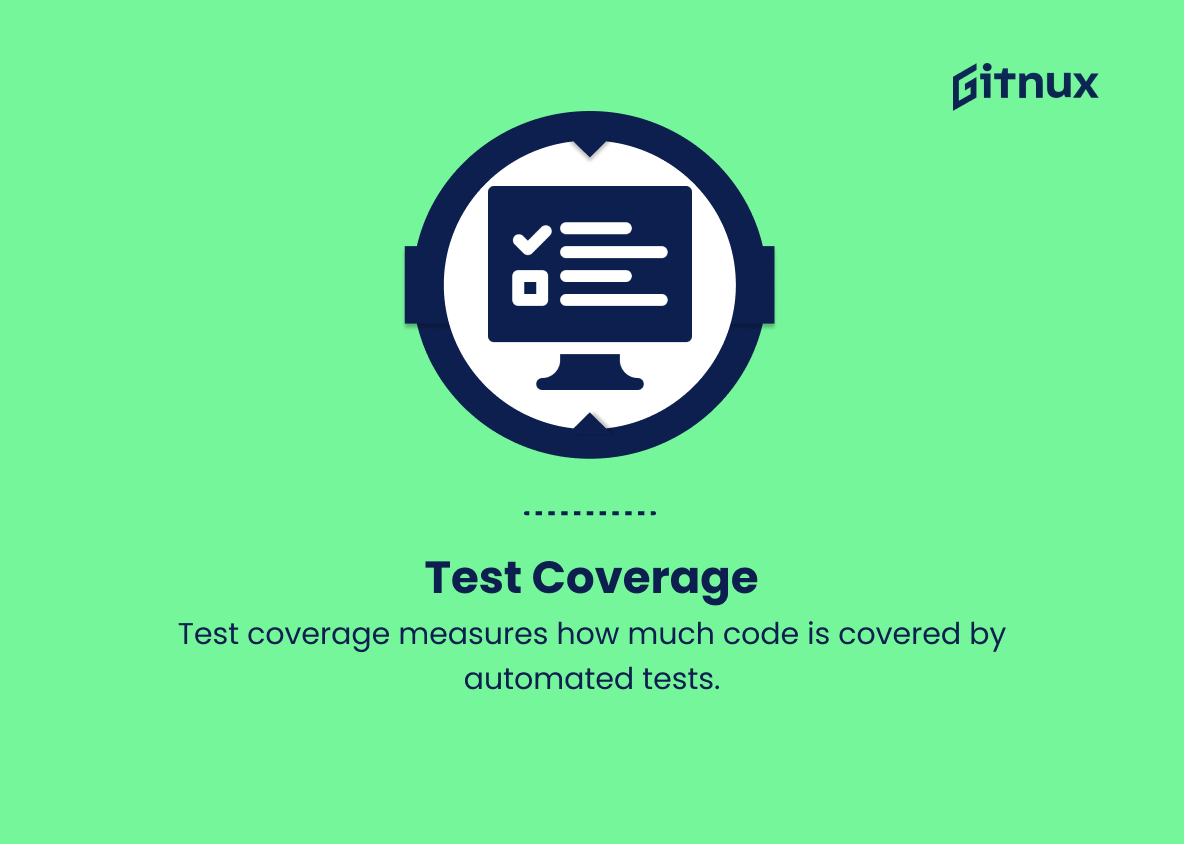
5. Test coverage
Test coverage is the percentage of code that is covered by automated tests. Higher test coverage is an indicator of better code quality and can reduce the risk of introducing new bugs during development.
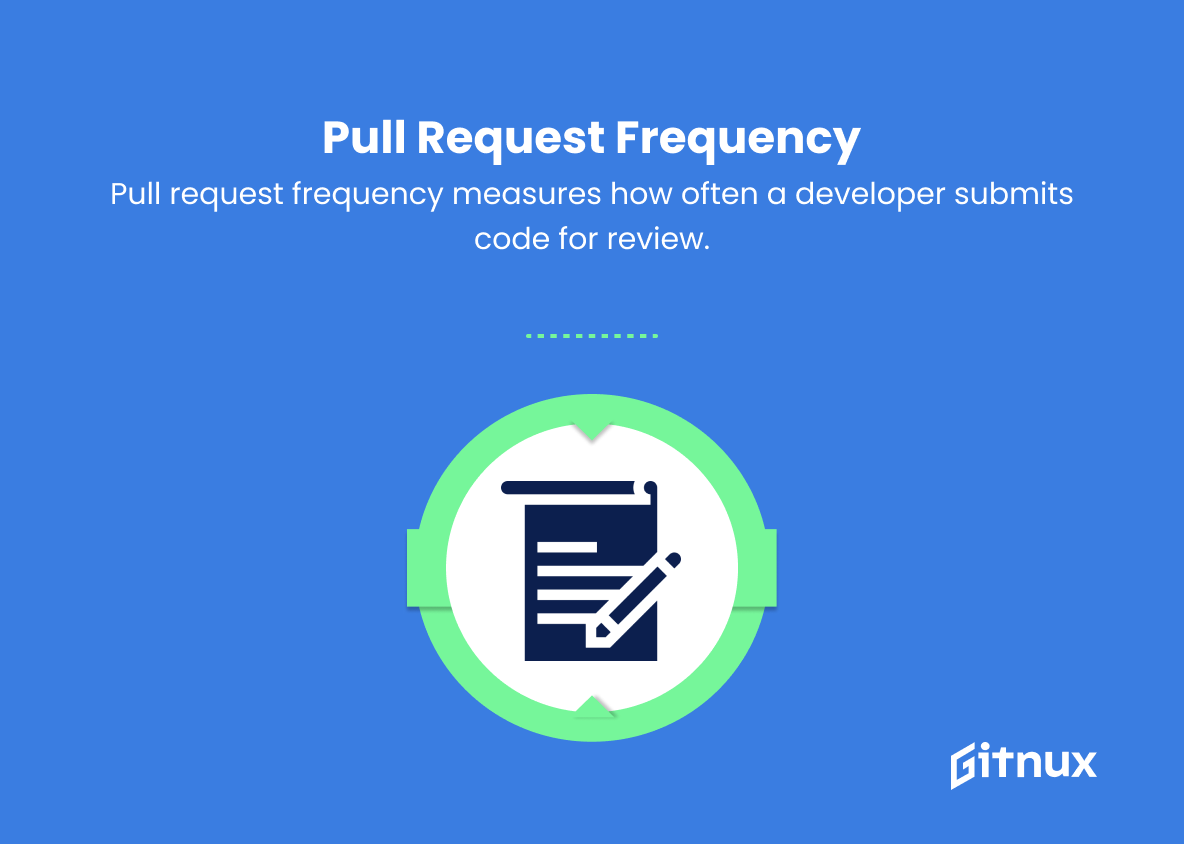
6. Pull request frequency
A measure of how often a developer submits pull requests for their code to be merged into the main branch. More frequent pull requests can indicate better collaboration and faster integration of new features or bug fixes.
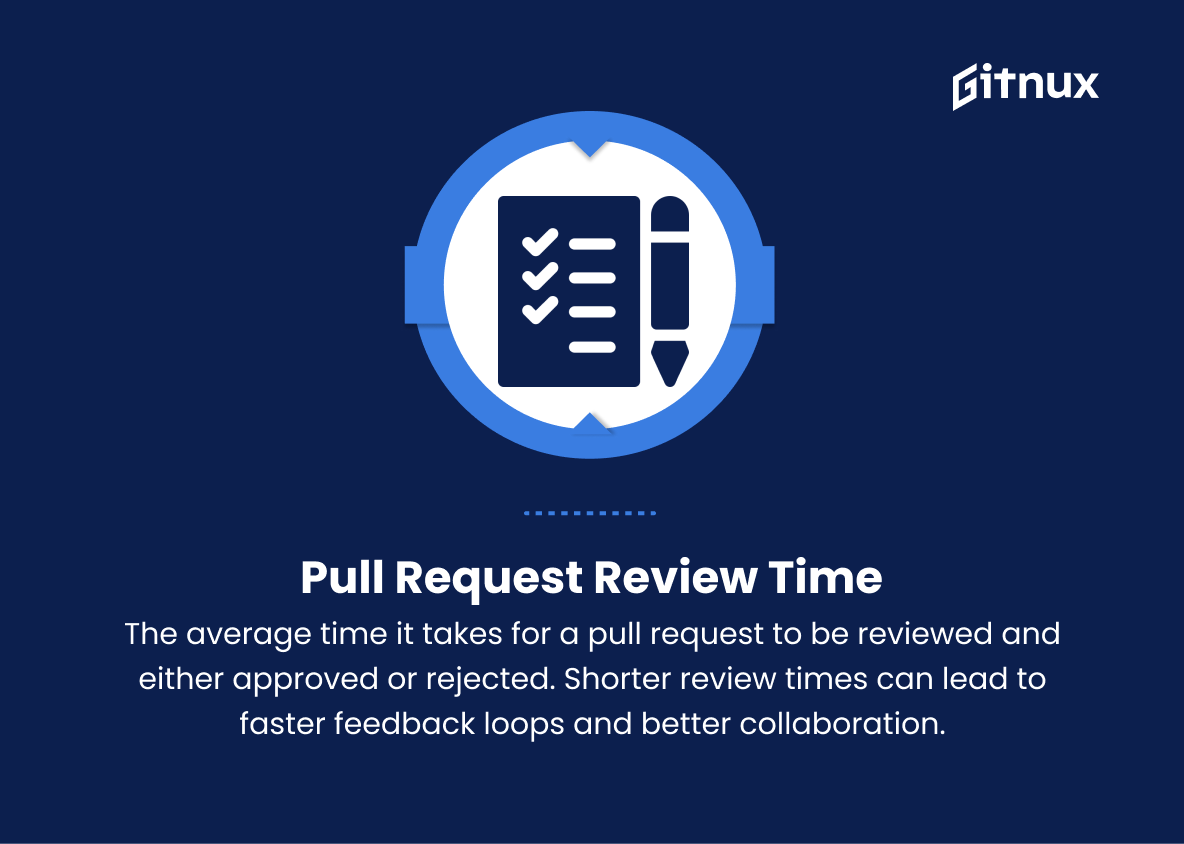
7. Pull request review time
The average time it takes for a pull request to be reviewed and either approved or rejected. Shorter review times can lead to faster feedback loops and better collaboration.
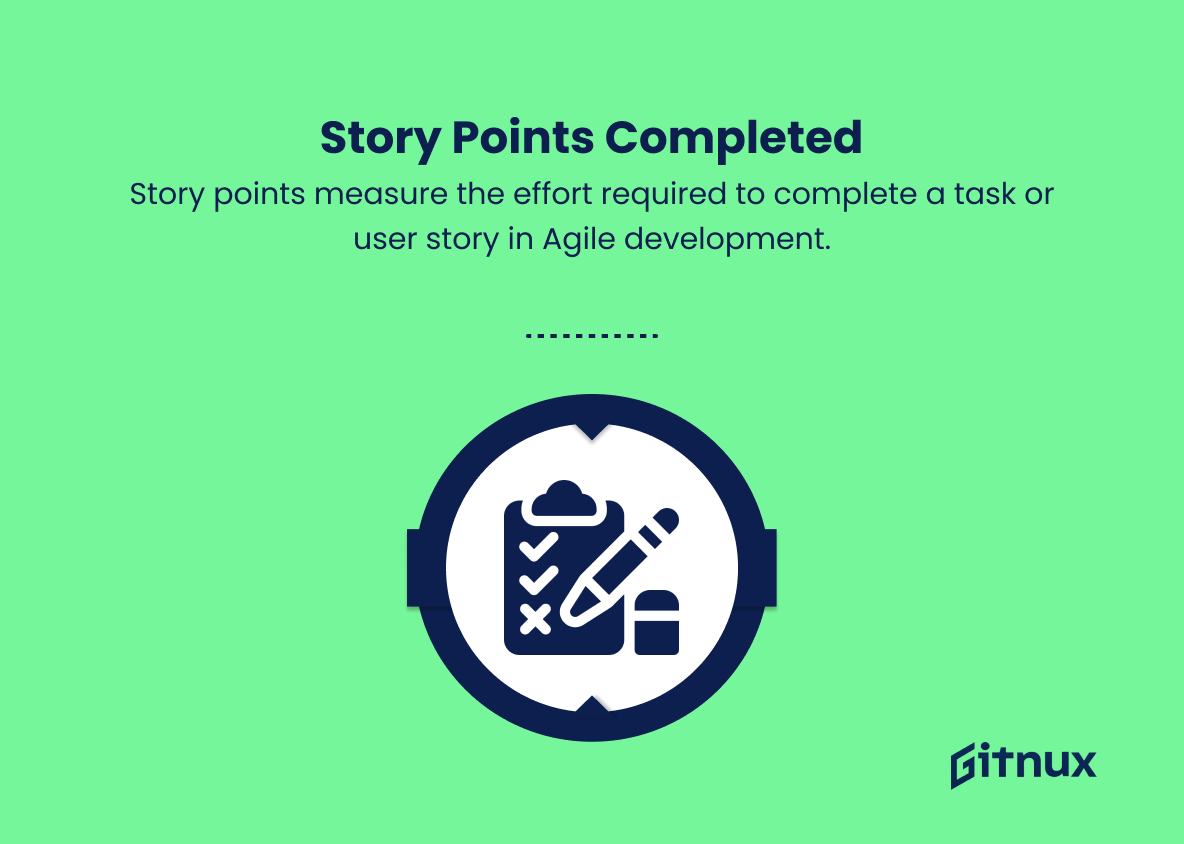
8. Story points completed
Story points are a unit of measure for expressing the effort required to complete a specific task or user story in Agile development. Tracking the number of story points completed by a developer during a sprint can help measure their productivity.
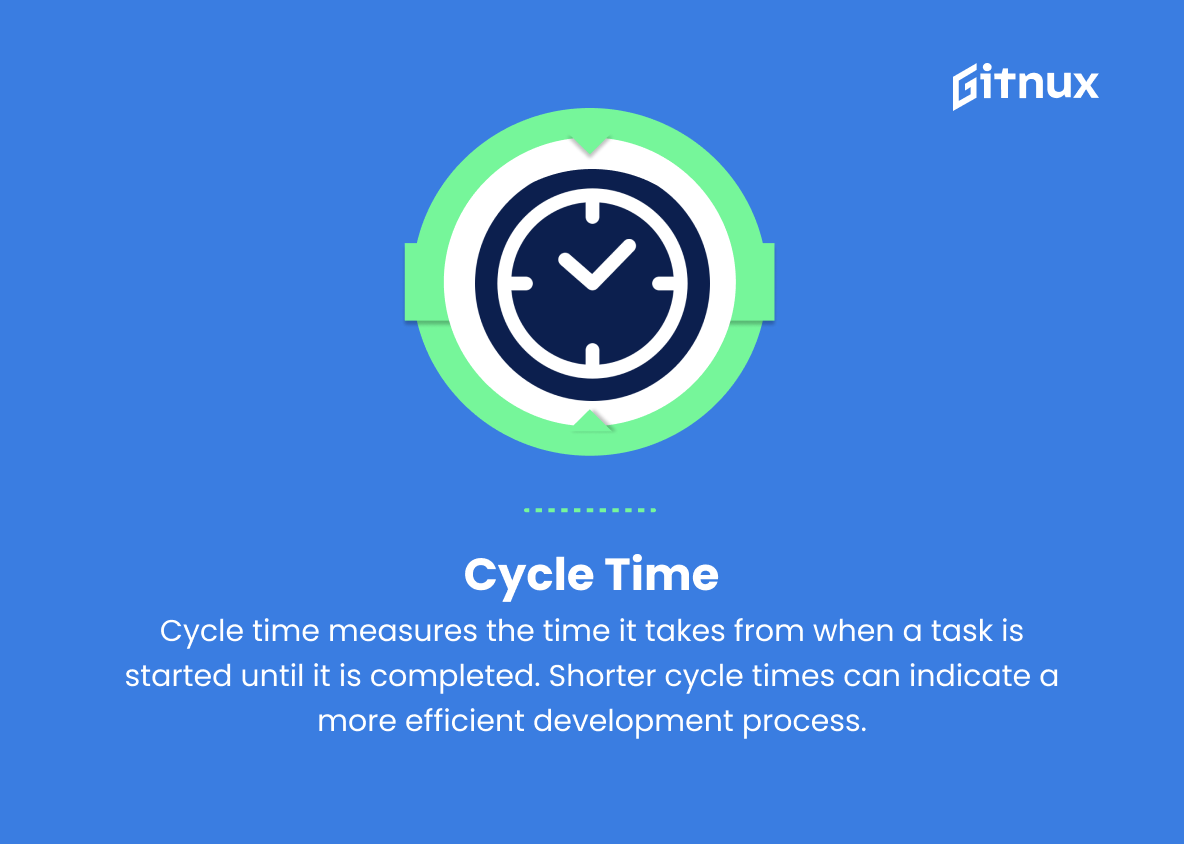
9. Cycle time
Cycle time measures the time it takes from when a task is started until it is completed. Shorter cycle times can indicate a more efficient development process.
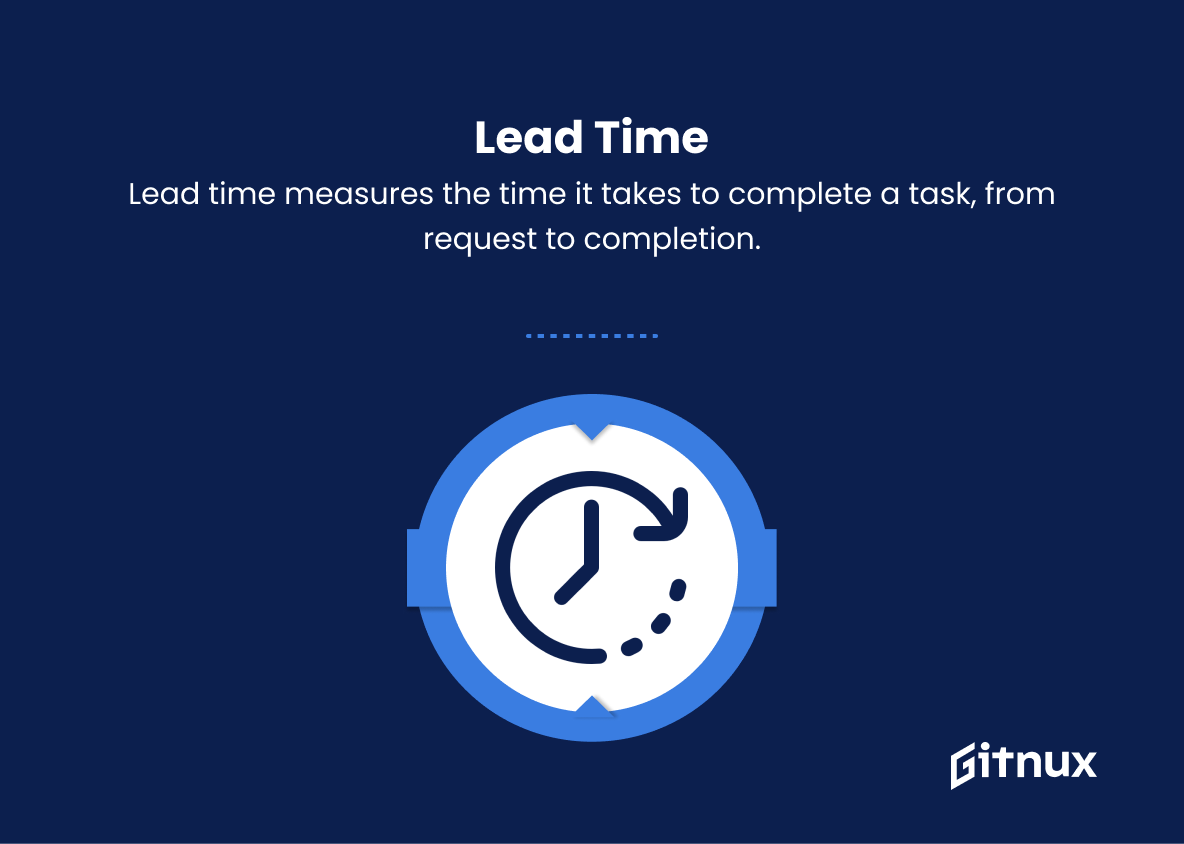
10. Lead time
Lead time is the time it takes from the moment a new task is requested (e.g., a feature request or bug report) until it is completed. Shorter lead times can reflect better collaboration and prioritization among team members.
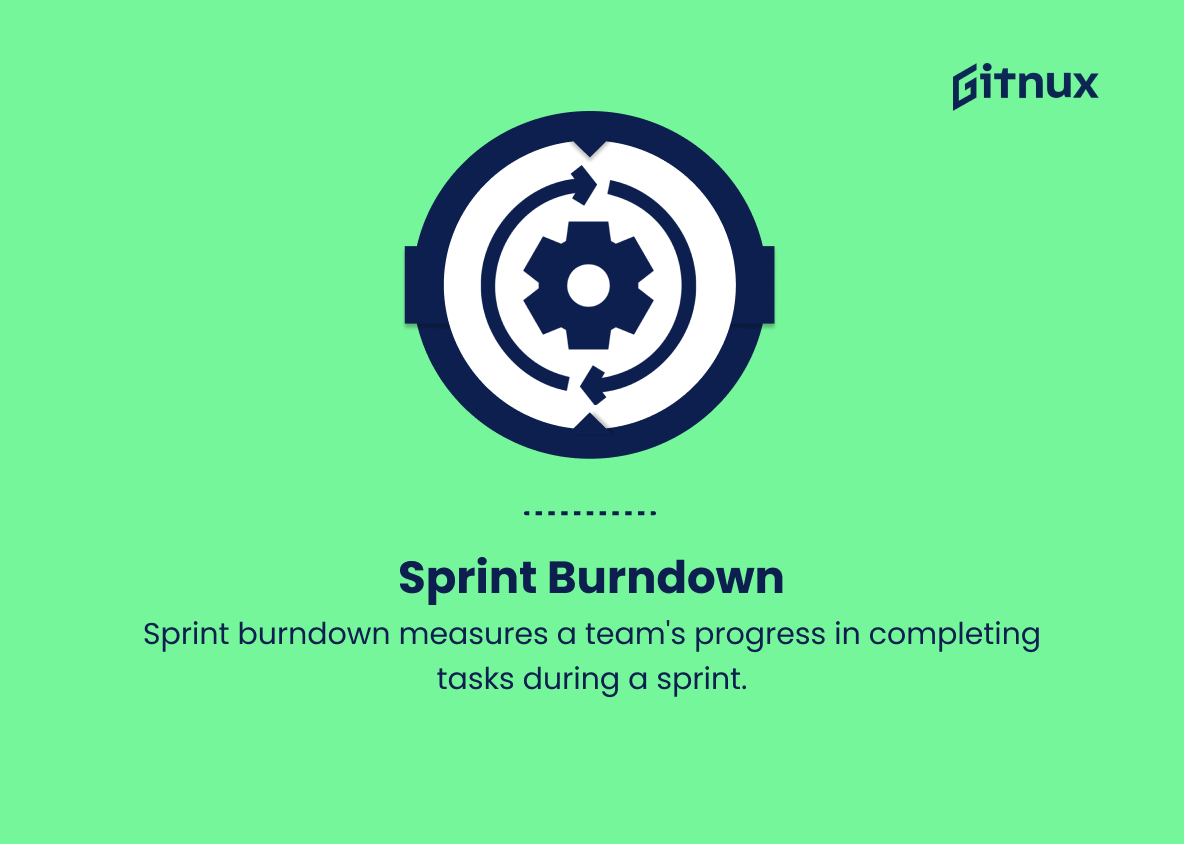
11. Sprint burndown
In agile development, this metric shows the progress of a team in completing tasks within a given sprint. A sprint burndown that reaches zero by the end of the sprint indicates all tasks were completed.
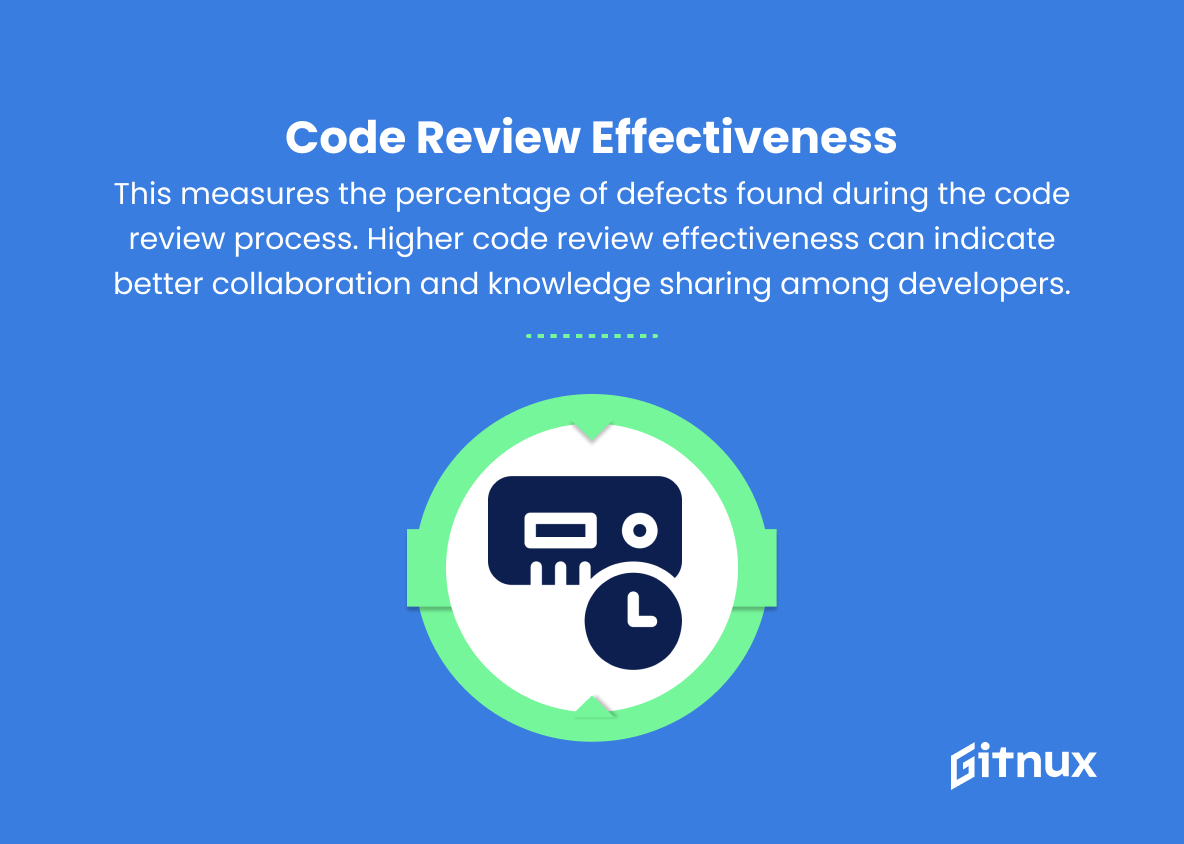
12. Code review effectiveness
This measures the percentage of defects found during the code review process. Higher code review effectiveness can indicate better collaboration and knowledge sharing among developers.
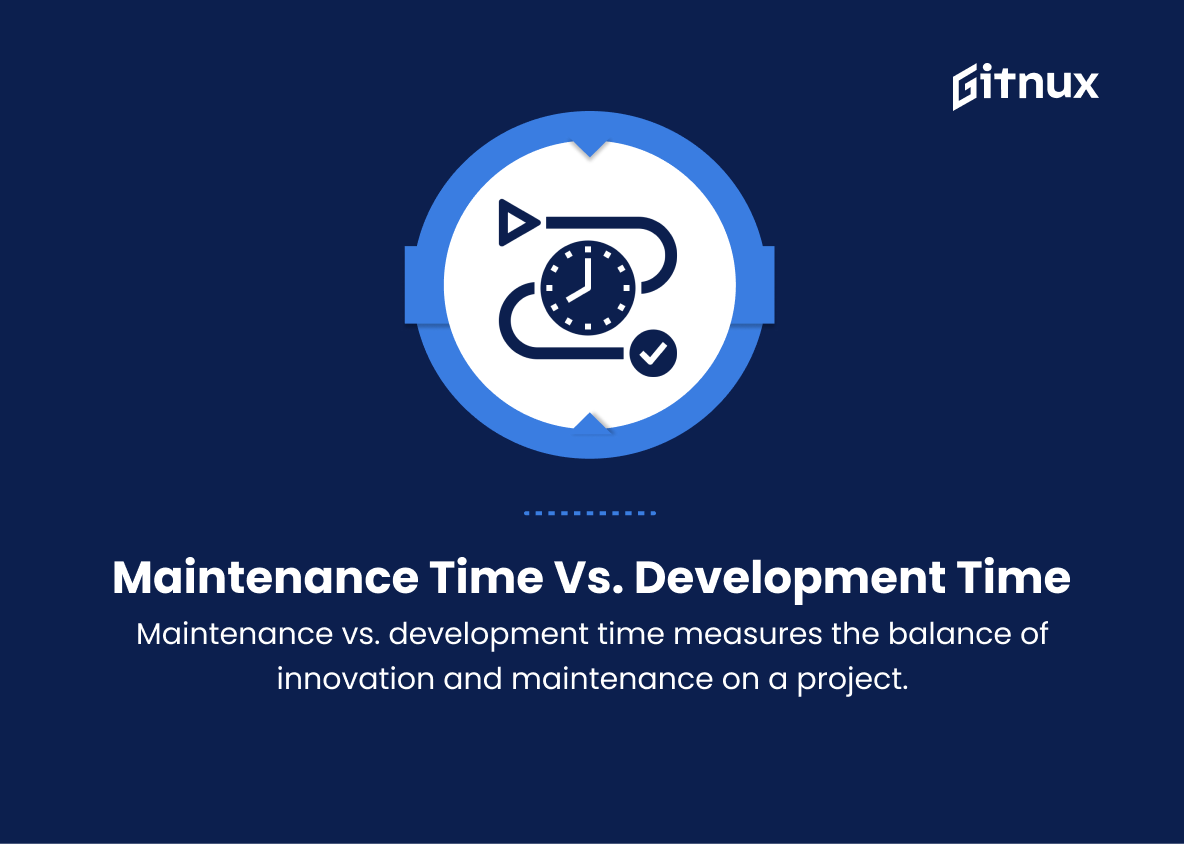
13. Time spent on maintenance vs. new development
This metric compares the amount of time a developer spends on fixing or maintaining existing code versus creating new functionality. It can provide insights into the balance of innovation and maintenance on a project.
Developer Productivity Metrics Explained
Developer productivity metrics show a team’s efficiency and effectiveness. They provide insights into performance, identify areas of improvement, and ensure proper allocation of time and resources. Metrics like code commits, lines of code, and churn indicate activity and inefficiencies.
Bug resolution time, test coverage, and pull request frequency assess code quality and collaboration. Cycle time, lead time, and sprint burndown reflect development process efficiency and task completion. Code review effectiveness and maintenance vs. new development show knowledge sharing and innovation balance. These metrics ensure continuous improvement and high-quality software delivery.
Conclusion
In conclusion, as developers and managers, it is imperative that we constantly strive to optimize our methods and implement the most effective productivity metrics available. By determining and utilizing the right tools and indicators, we can ensure that our development teams are working at their peak performance, ultimately leading to more successful projects and a healthier work environment.
It’s crucial to remember that metrics are not one-size-fits-all; each team and organization should focus on the specific indicators and tools that will work best within their environment. Fostering a culture of continuous improvement, open communication, and supportive collaboration is the key to unlocking the true potential of your team’s productivity. So, take a deep dive, explore the array of developer productivity metrics, and find the perfect fit for your team’s growth and success.
