


In today’s highly competitive market landscape, an efficient engineering team is the backbone of any successful organization. As the complex landscape of software engineering continues to evolve, identifying and managing the key performance indicators (KPIs) are of paramount importance to ensure the effectiveness, productivity, and sustainability of engineering projects.
In this enlightening blog post, we will delve into the world of engineering performance metrics, exploring their significance, the different types of metrics, and methods to implement them effectively. Join us as we shed light on the essential tools and methods that facilitate data-driven decision-making, enabling organizations to optimize their engineering processes and ultimately contribute to business growth and success.
Engineering Performance Metrics You Should Know
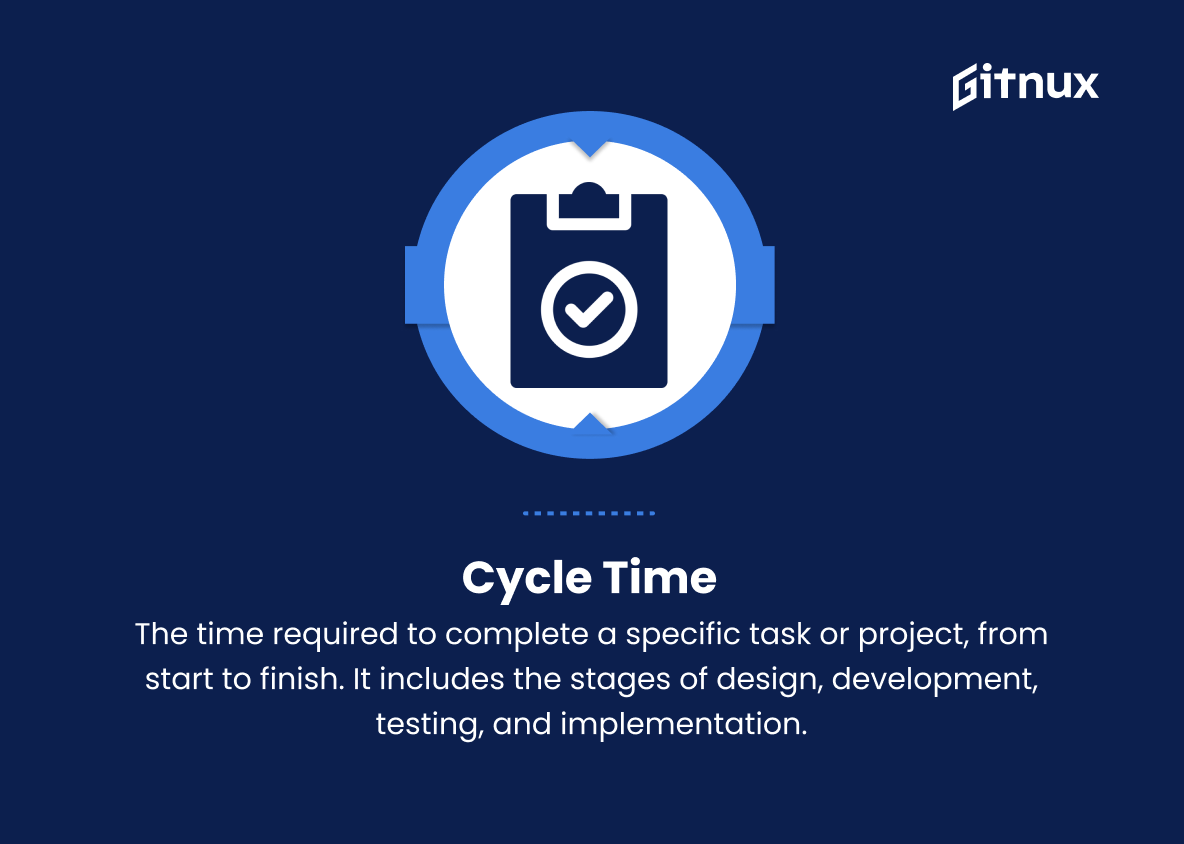
1. Cycle time
The time required to complete a specific task or project, from start to finish. It includes the stages of design, development, testing, and implementation.
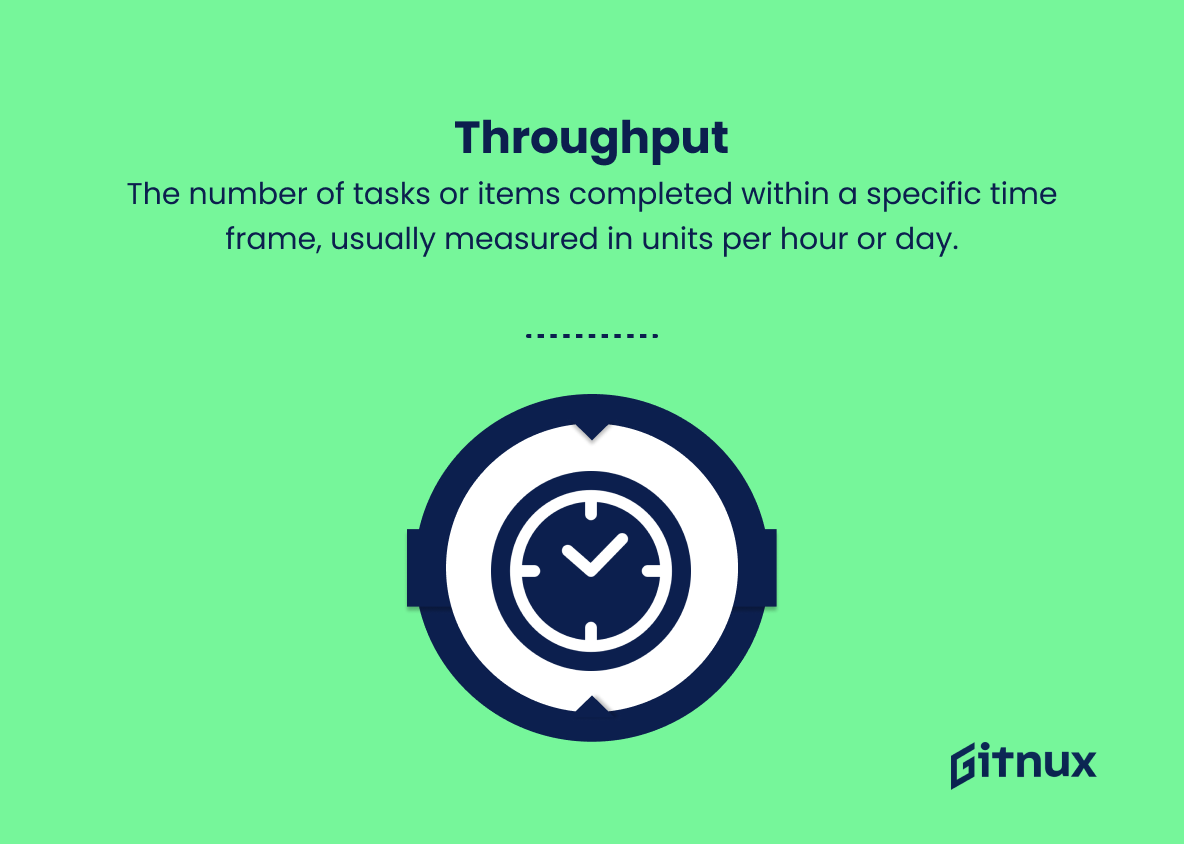
2. Throughput
The number of tasks or items completed within a specific time frame, usually measured in units per hour or day.
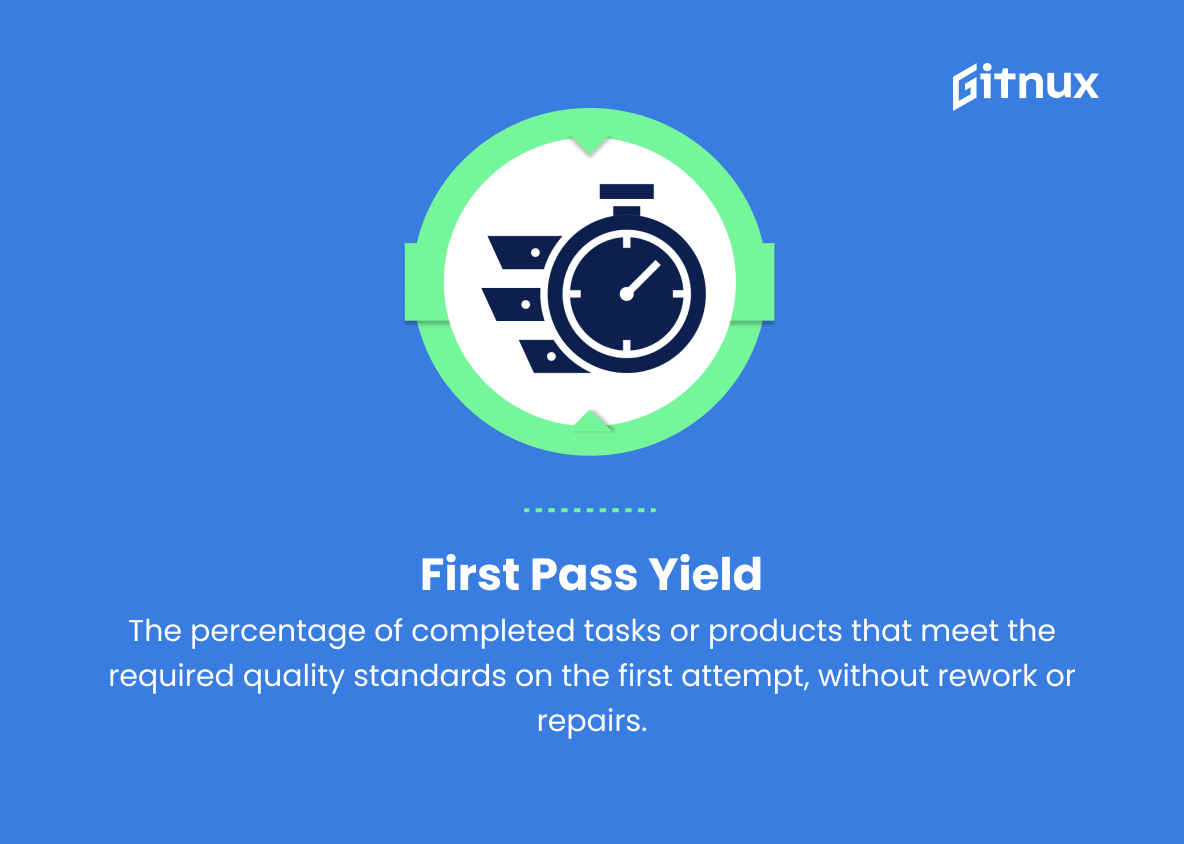
3. First pass yield
The percentage of completed tasks or products that meet the required quality standards on the first attempt, without rework or repairs.
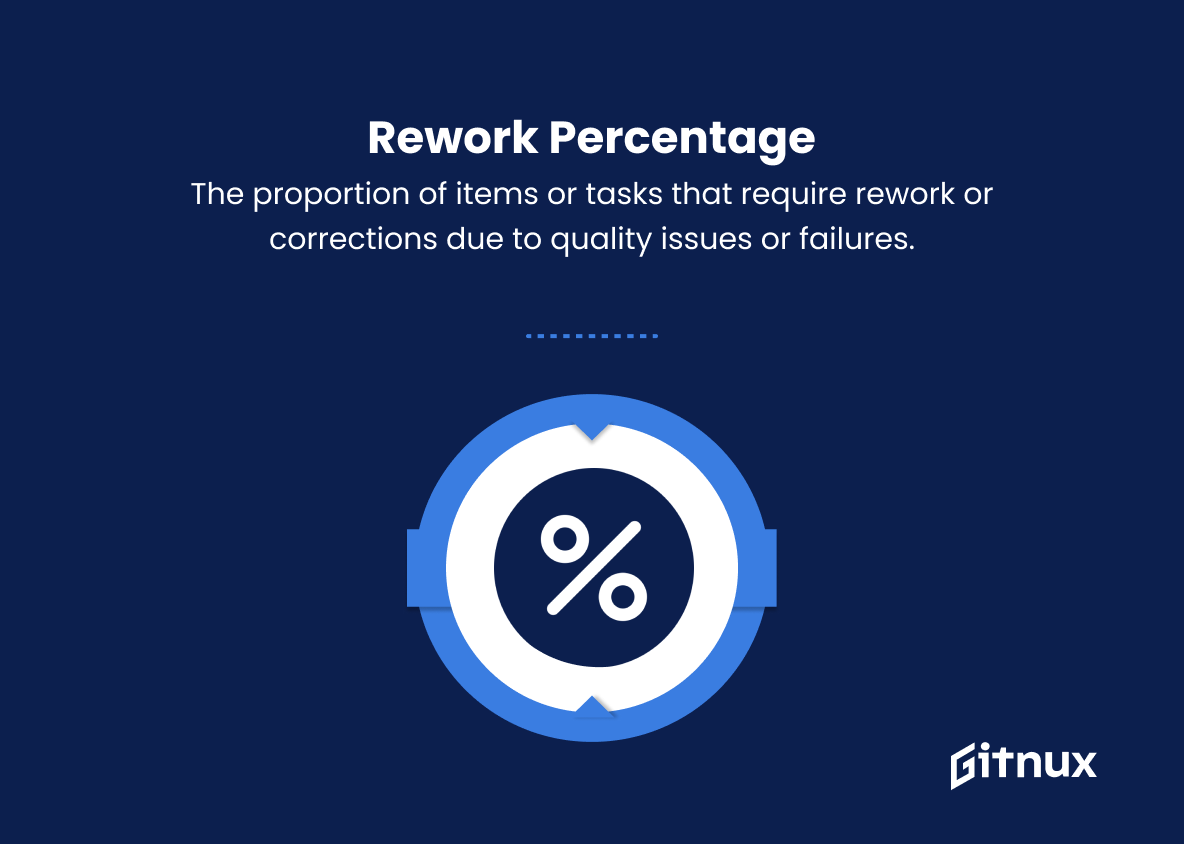
4. Rework percentage
The proportion of items or tasks that require rework or corrections due to quality issues or failures.
5. Defect density
The number of defects identified during testing or inspection, divided by the size of the product or system being tested (for example, the number of defects per thousand lines of code).
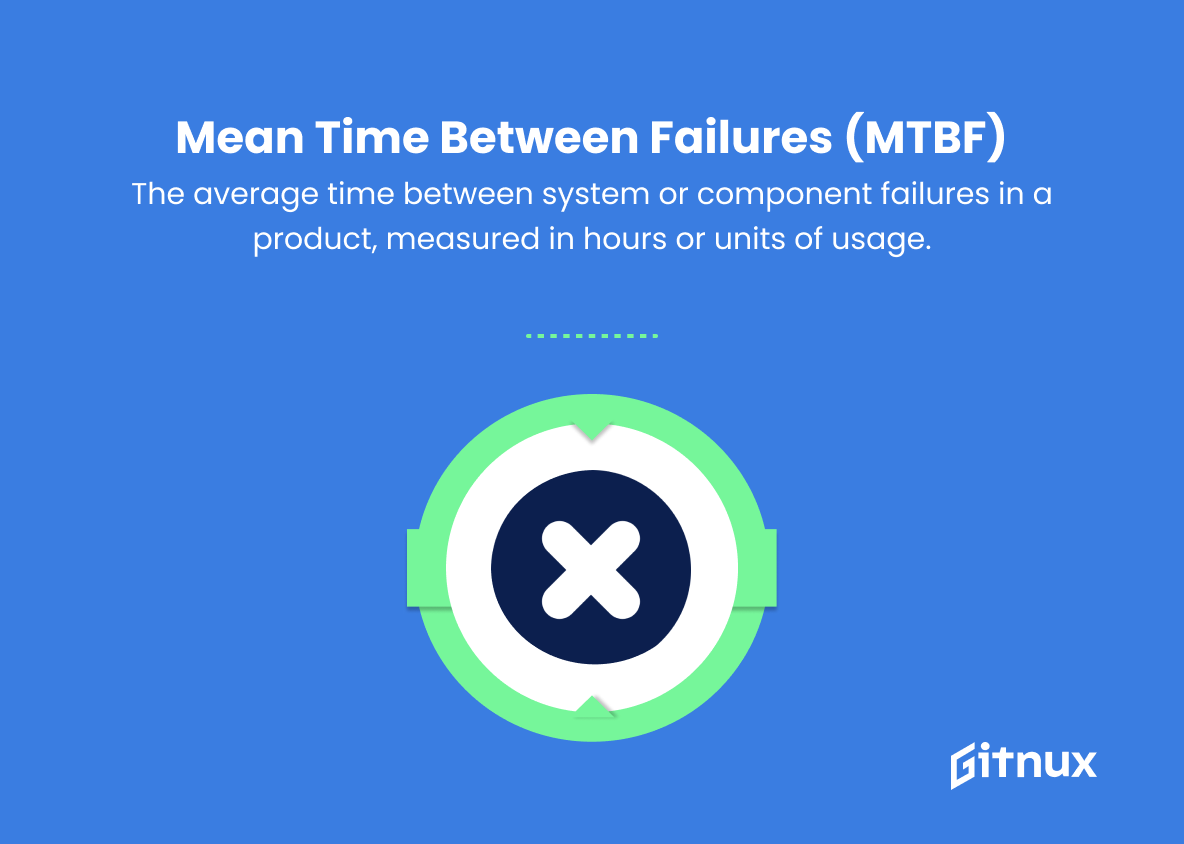
6. Mean time between failures (MTBF)
The average time between system or component failures in a product, measured in hours or units of usage.
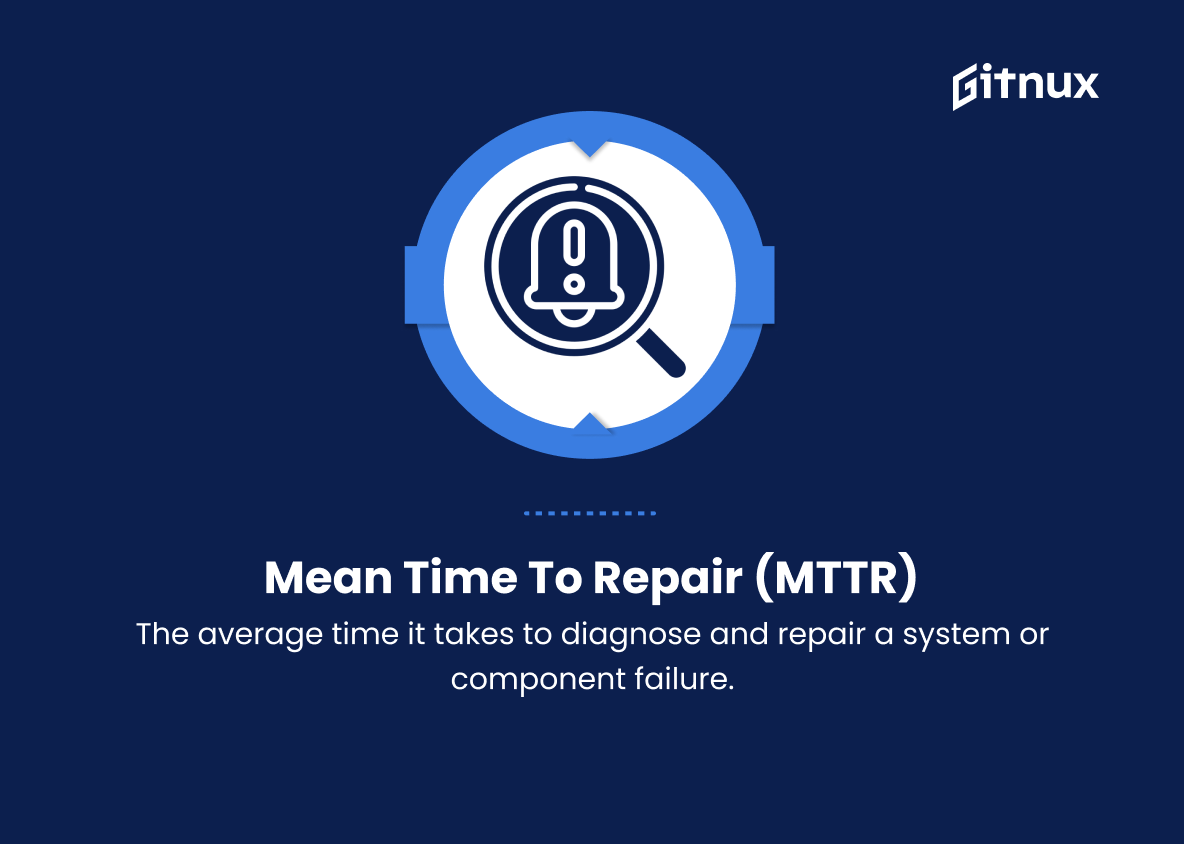
7. Mean time to repair (MTTR)
The average time it takes to diagnose and repair a system or component failure.
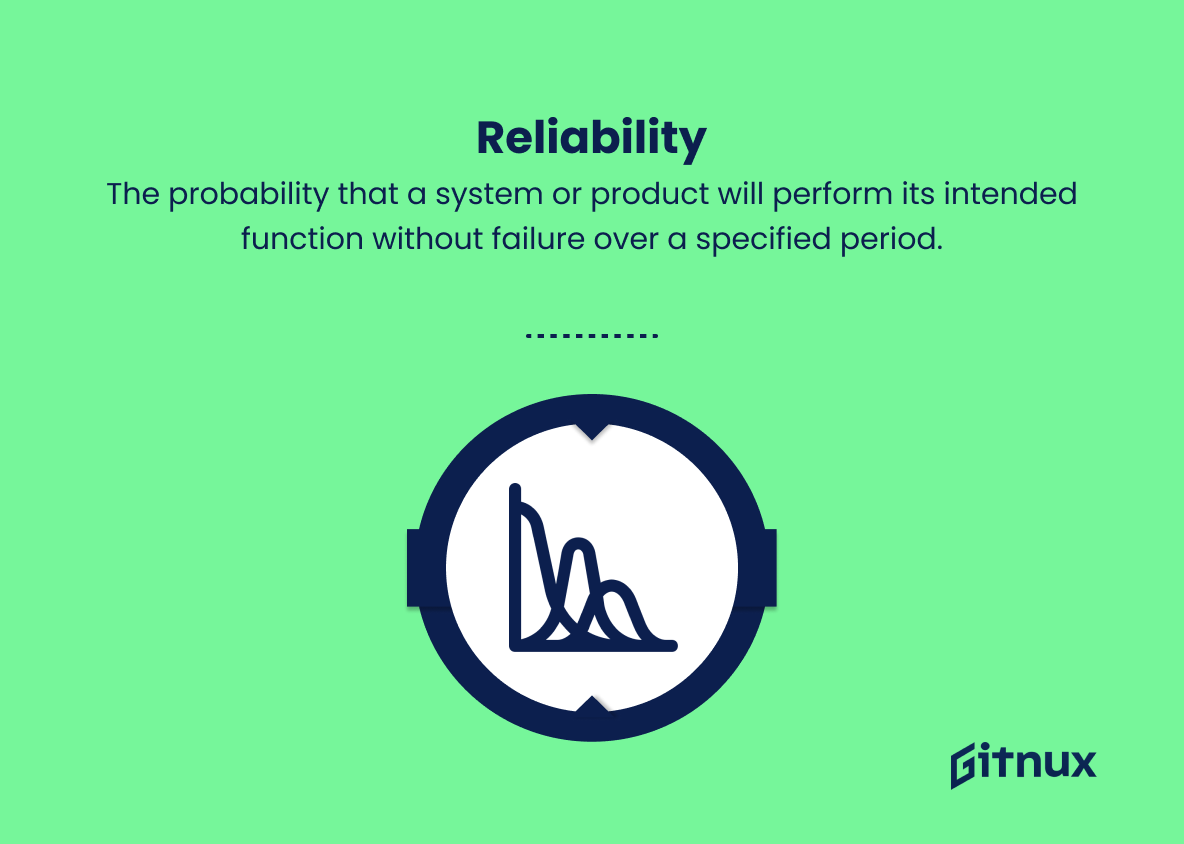
8. Reliability
The probability that a system or product will perform its intended function without failure over a specified period.
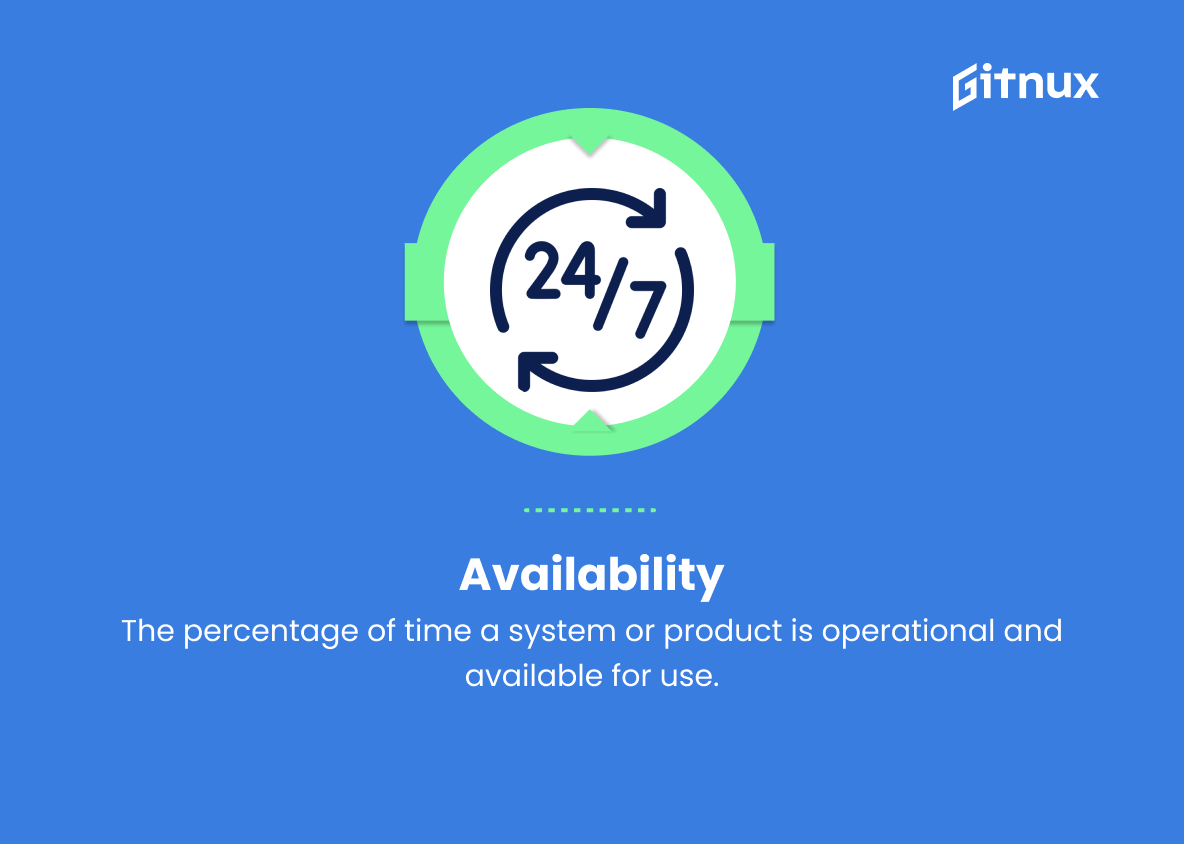
9. Availability
The percentage of time a system or product is operational and available for use.
10. Resource utilization
The percentage of available resources (such as staff, machinery, or materials) that are being effectively used on a project.
11. Schedule performance index (SPI)
A ratio of the work completed to the planned work, indicating the progress of a project against its schedule.
12. Cost performance index (CPI)
A ratio of the actual cost of work completed to the budgeted cost, indicating how effectively resources are being used.
13. Engineering change order (ECO) rate
The number of engineering change orders issued per project, serving as an indicator of the stability of a product’s design.
14. Innovation rate
The number of new ideas, inventions, or technologies generated and successfully incorporated into a project or product.
15. Staff engagement
The level of commitment, motivation, and satisfaction of engineering staff, often measured using surveys or other feedback methods.
16. Quality index
A composite score combining various quality-related metrics, such as defect density, first pass yield, and rework percentage, to provide an overall assessment of a project’s quality performance.
17. Time to market
The time it takes for a product to progress from concept to launch or commercialization, often used as an indicator of an organization’s ability to meet market demands quickly.
18. Return on investment (ROI)
The financial return generated by a project or product, typically calculated as the ratio of net profit to the initial investment.
Engineering Performance Metrics Explained
Engineering Performance Metrics are essential tools in evaluating the effectiveness and efficiency of engineering projects and processes. Cycle time, throughput, and first pass yield directly impact the overall output and cost-effectiveness of an engineering project, while rework percentage and defect density highlight areas where improvements can be made in terms of product quality. Metrics like Mean Time Between Failures (MTBF) and Mean Time To Repair (MTTR) help to assess product reliability and maintainability, while reliability and availability measure the overall dependability and performance of a system or product.
Resource utilization, schedule performance index (SPI), and cost performance index (CPI) are crucial factors in determining project management effectiveness, and engineering change order (ECO) rate gives insights into the stability of design. The innovation rate encourages the development and incorporation of new ideas and technologies in a project, while staff engagement helps to identify the overall satisfaction and enthusiasm of the engineering team.
A quality index can be used to evaluate the performance of a project in meeting quality standards comprehensively. Time to market is significant in maintaining competitiveness, and return on investment (ROI) is a valuable measure of a project’s profitability and value to an organization. These metrics, when carefully analyzed and addressed, can lead to significant improvements in engineering performance and success.
Conclusion
In conclusion, engineering performance metrics are essential in evaluating and optimizing the efficiency, quality, and overall success of engineering projects. They provide key insights into project performance and serve as critical tools for continuous improvement in processes and team dynamics.
By leveraging these metrics effectively, engineering teams have the opportunity to identify areas where they can innovate, streamline their efforts, and ensure the delivery of the best possible results. Ultimately, well-defined and carefully curated engineering performance metrics are a powerful asset for any organization looking to stay competitive in the rapidly evolving landscape of technology and engineering solutions.
