In today’s complex and rapidly evolving business landscape, effective problem management has become an essential aspect of organizational success. A proactive and strategic approach to identifying, analyzing, and resolving the root causes of recurring issues is crucial in ensuring seamless operations and minimizing potential risks. However, without the proper measurement of problem management performance, organizations may struggle to understand the true impact of their efforts and successfully drive continuous improvement. This is where problem management metrics come into play.
In this insightful blog post, we will delve into the world of problem management metrics, providing a comprehensive discussion on their importance, the different types of metrics, and how they can be utilized for driving measurable improvements in your organization’s problem management processes. By understanding these vital performance indicators, you will be empowered to effectively identify areas of improvement and implement strategic actions to enhance the overall efficacy of your organization’s problem management strategies. So, let us embark on this journey to fully grasp the significance of problem management metrics and unlock the true potential of an effective problem resolution framework.
Problem Management Metrics You Should Know
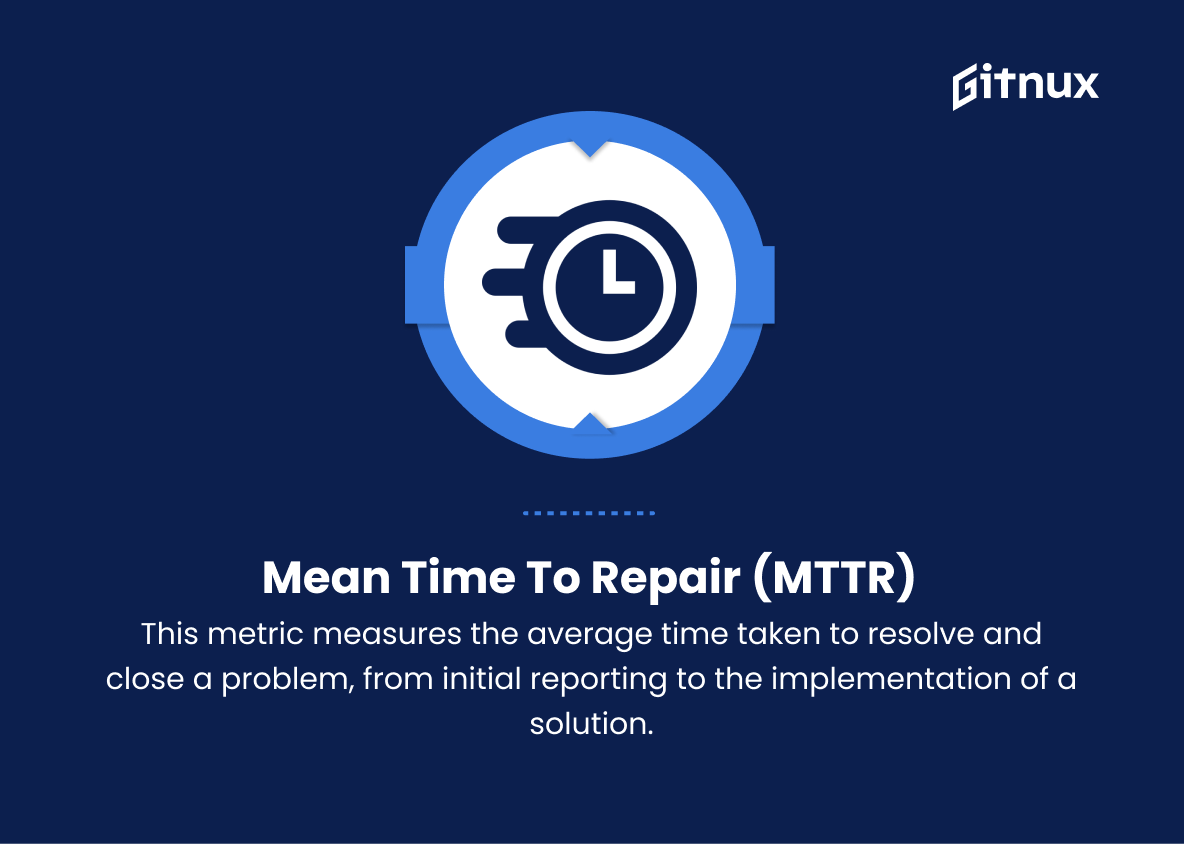
1. Mean Time To Repair (MTTR)
This metric measures the average time taken to resolve and close a problem, from initial reporting to the implementation of a solution.
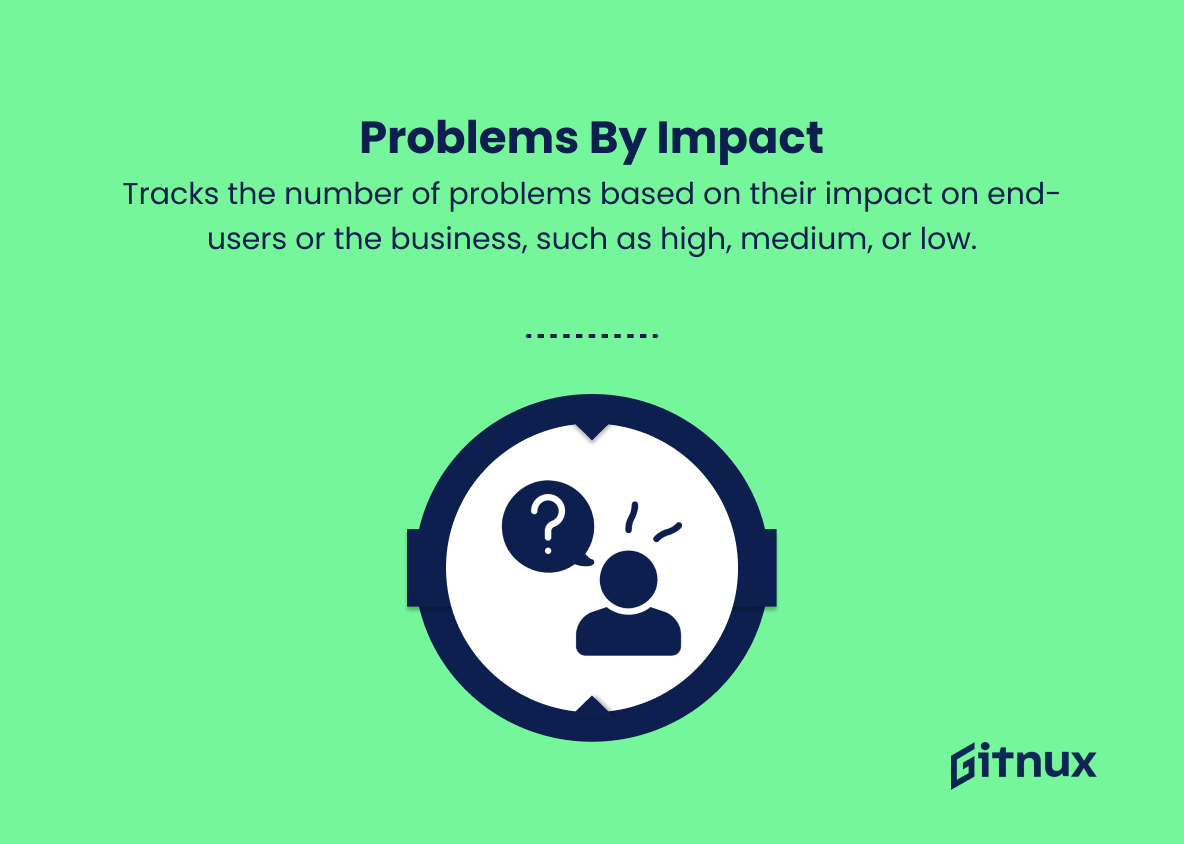
2. Problems by Impact
Tracks the number of problems based on their impact on end-users or the business, such as high, medium, or low.
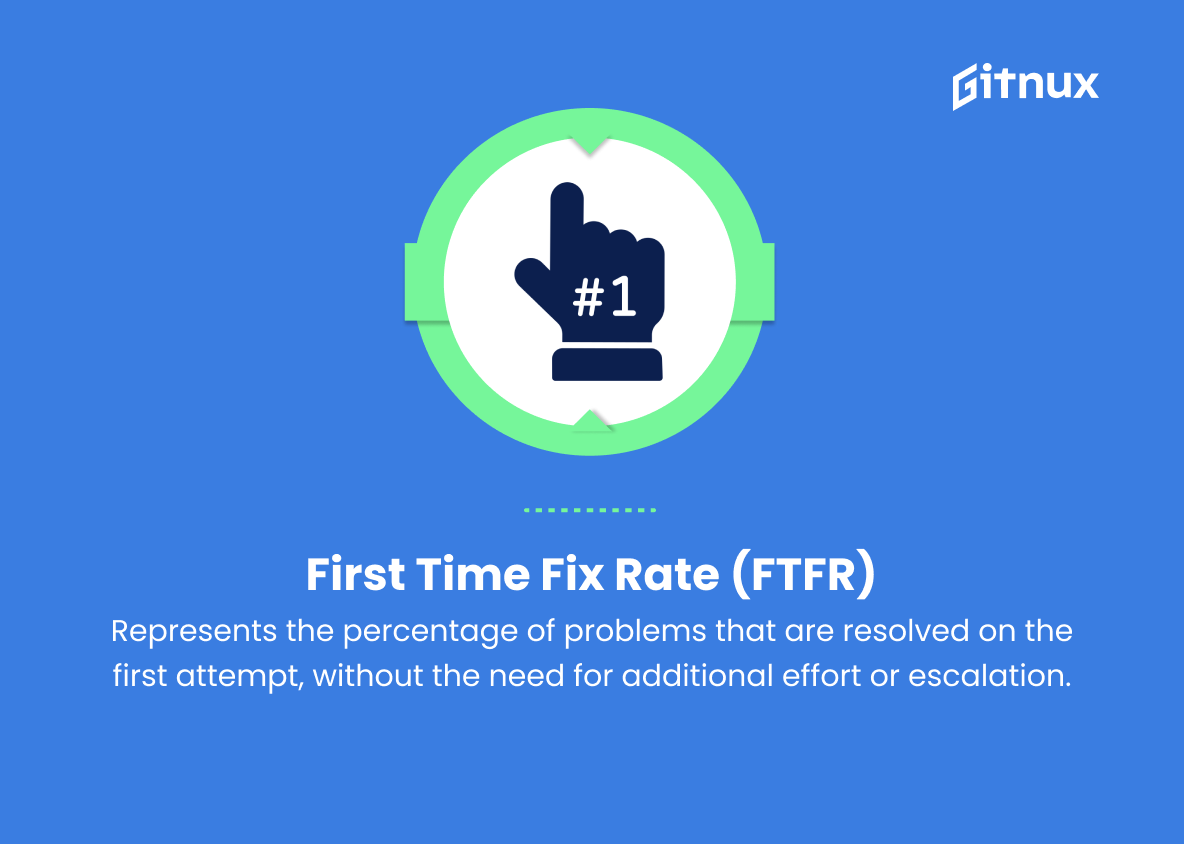
3. First Time Fix Rate (FTFR)
Represents the percentage of problems that are resolved on the first attempt, without the need for additional effort or escalation.
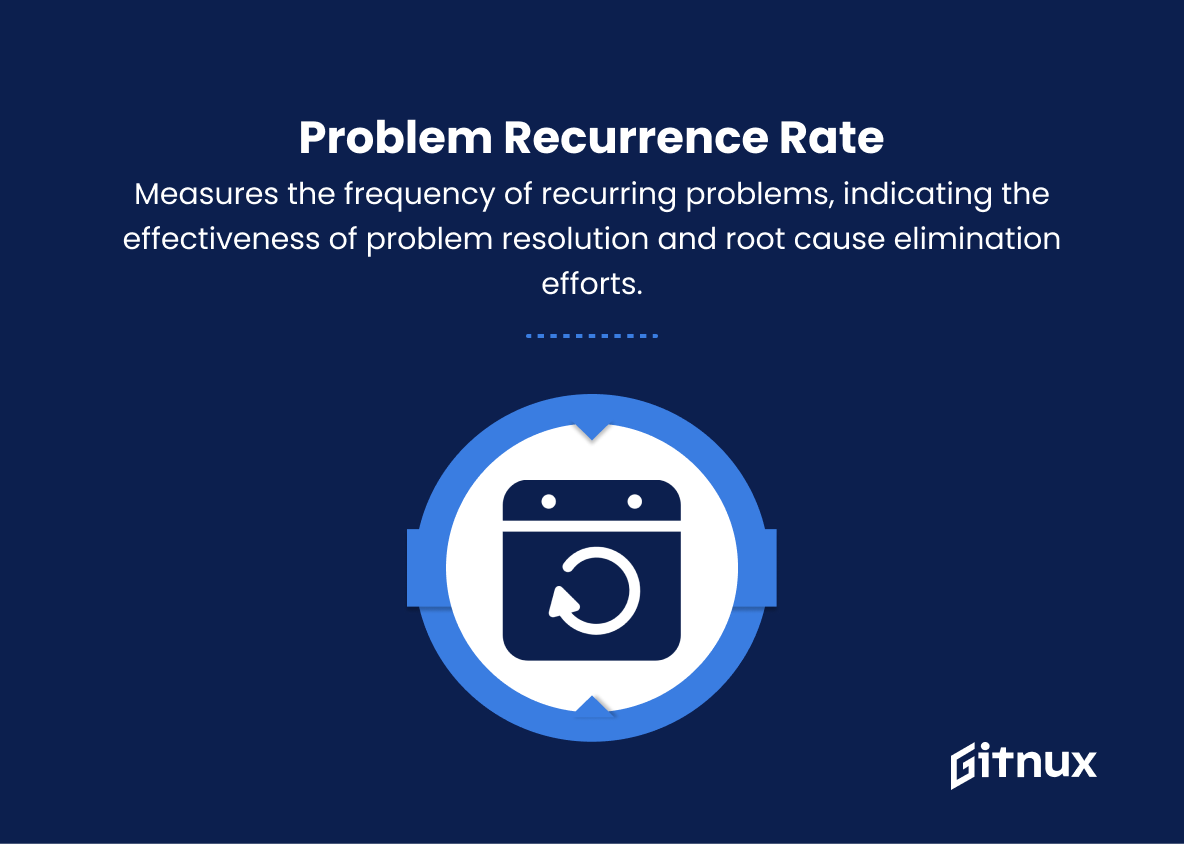
4. Problem Recurrence Rate
Measures the frequency of recurring problems, indicating the effectiveness of problem resolution and root cause elimination efforts.
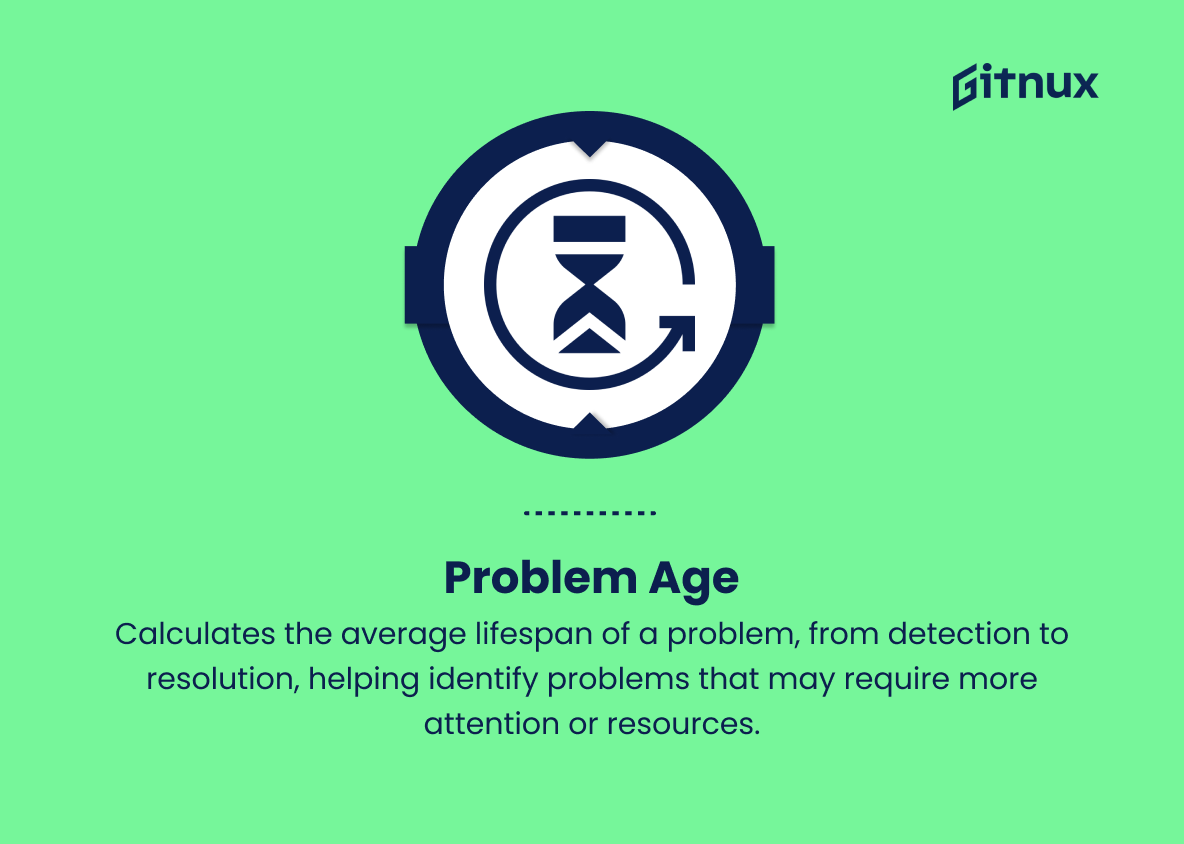
5. Problem Age
Calculates the average lifespan of a problem, from detection to resolution, helping identify problems that may require more attention or resources.
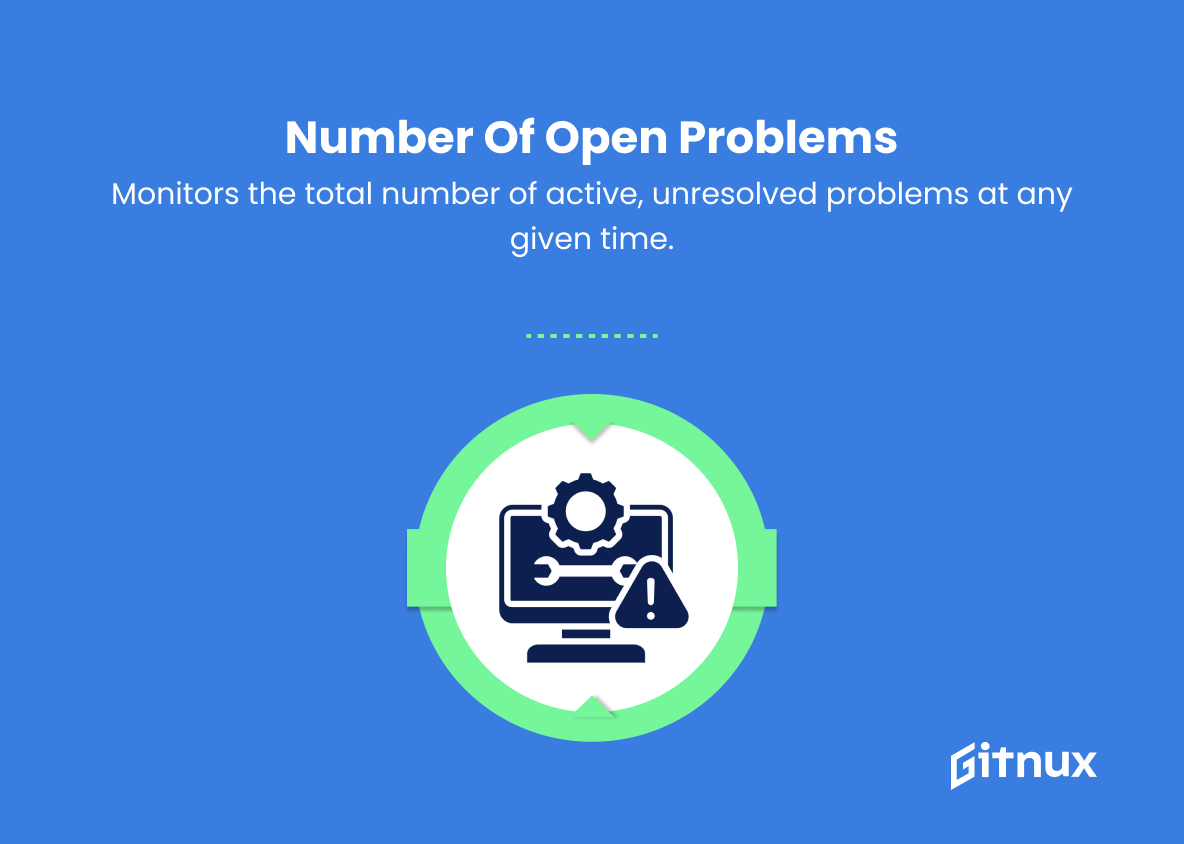
6. Number of Open Problems
Monitors the total number of active, unresolved problems at any given time.
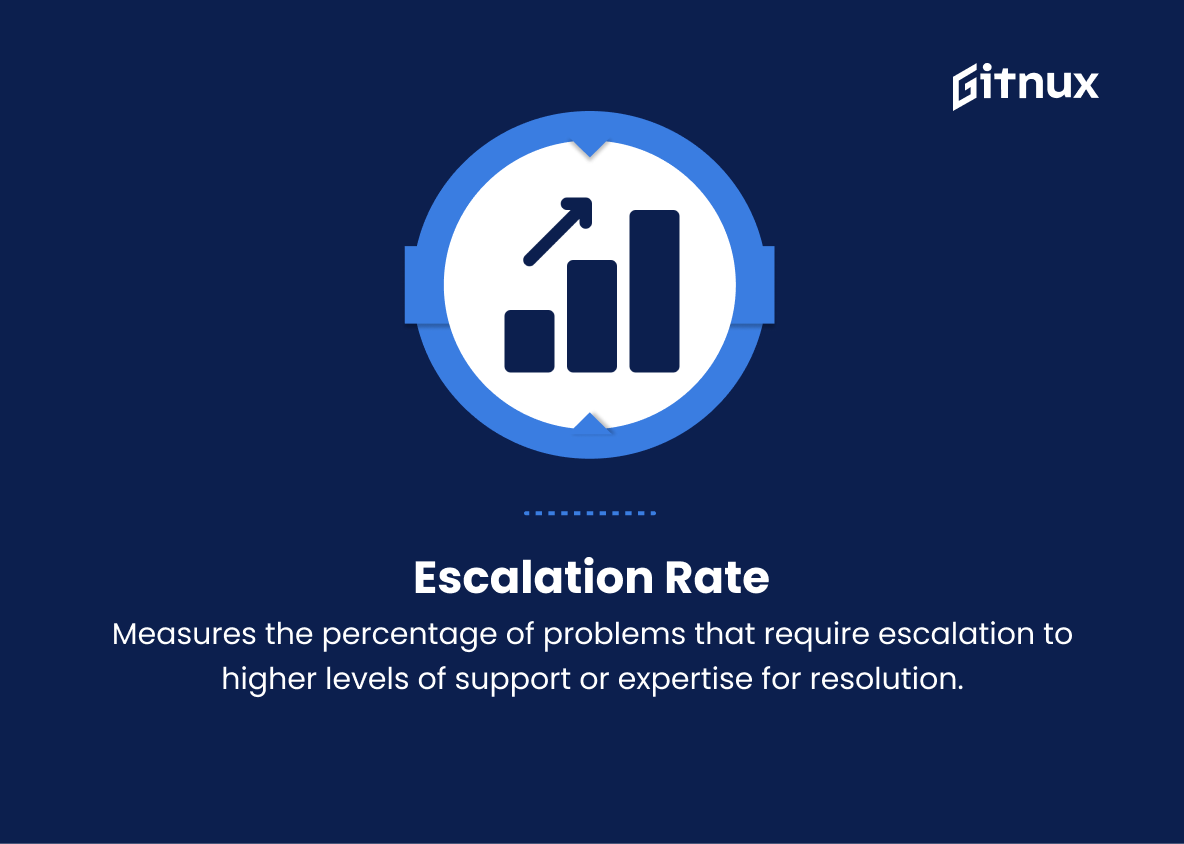
7. Escalation Rate
Measures the percentage of problems that require escalation to higher levels of support or expertise for resolution.
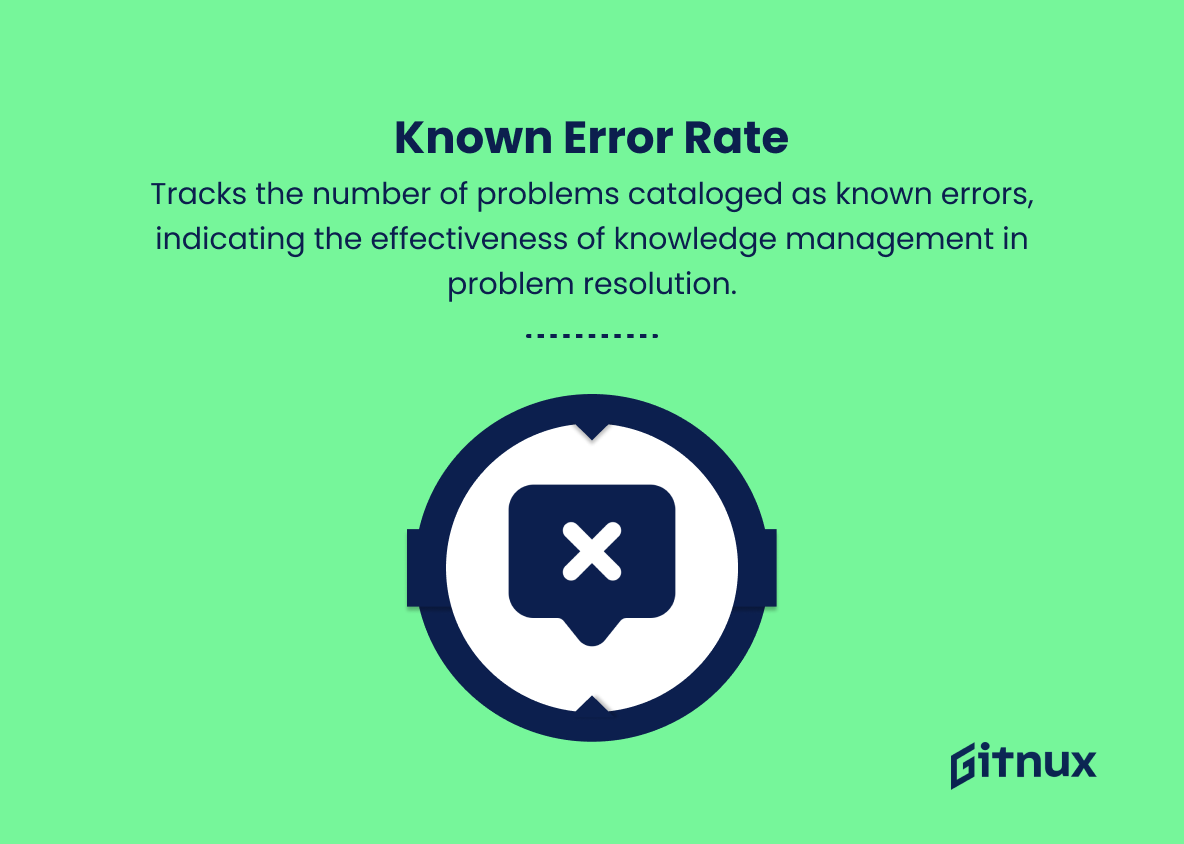
8. Known Error Rate
Tracks the number of problems cataloged as known errors, indicating the effectiveness of knowledge management in problem resolution.
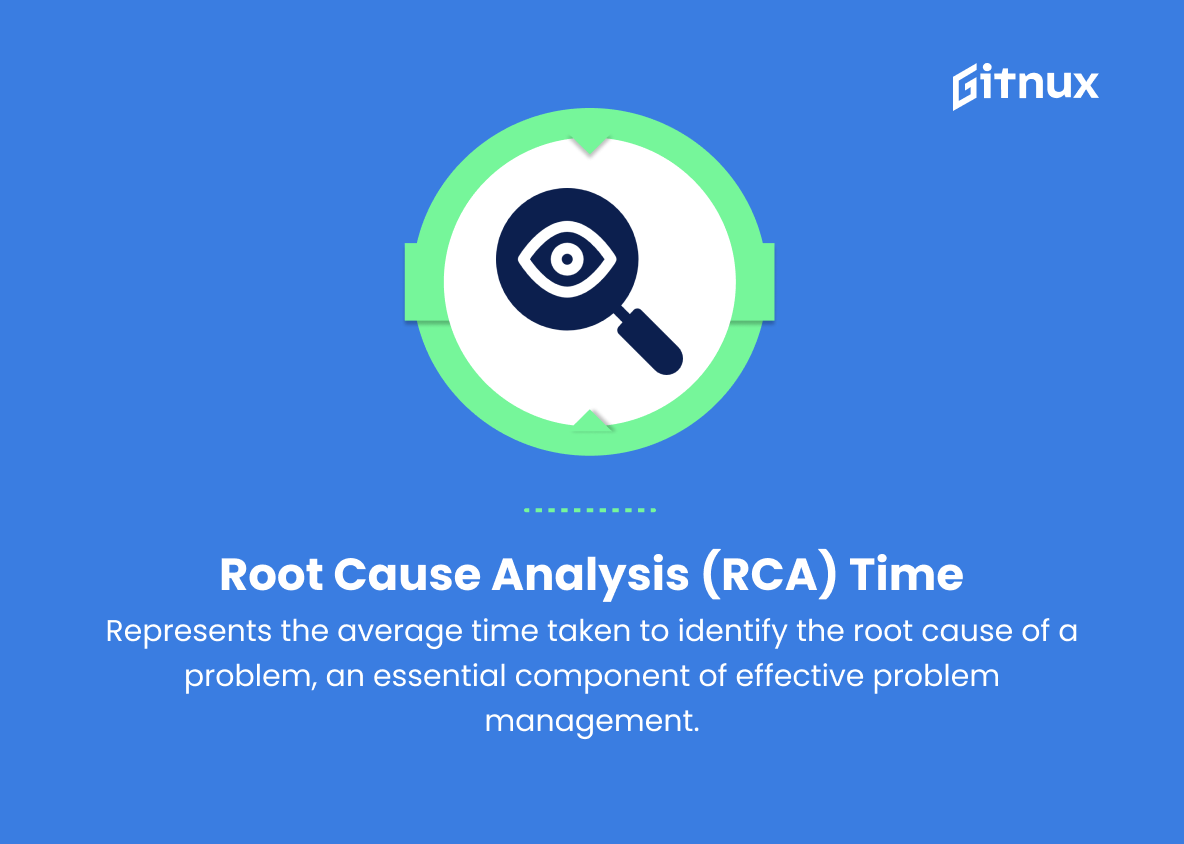
9. Root Cause Analysis (RCA) Time
Represents the average time taken to identify the root cause of a problem, an essential component of effective problem management.
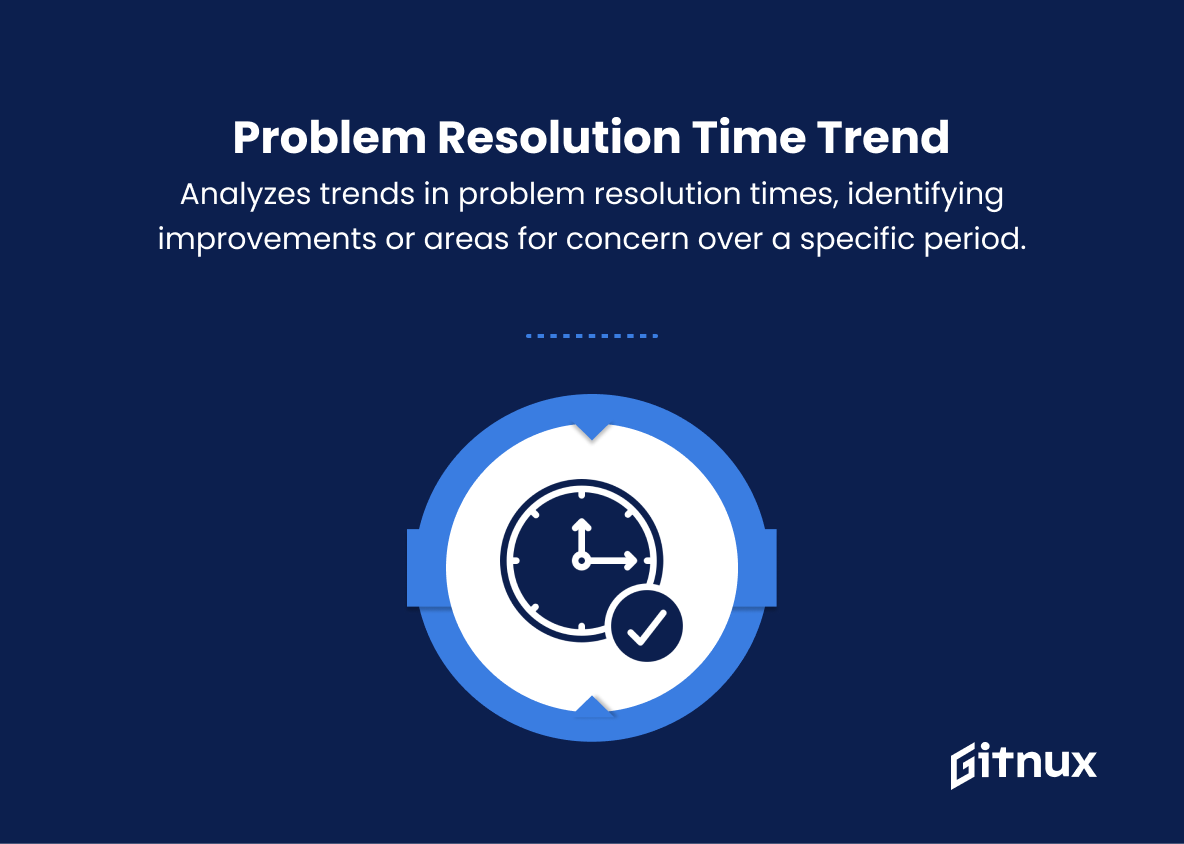
10. Problem Resolution Time Tren
Analyzes trends in problem resolution times, identifying improvements or areas for concern over a specific period.
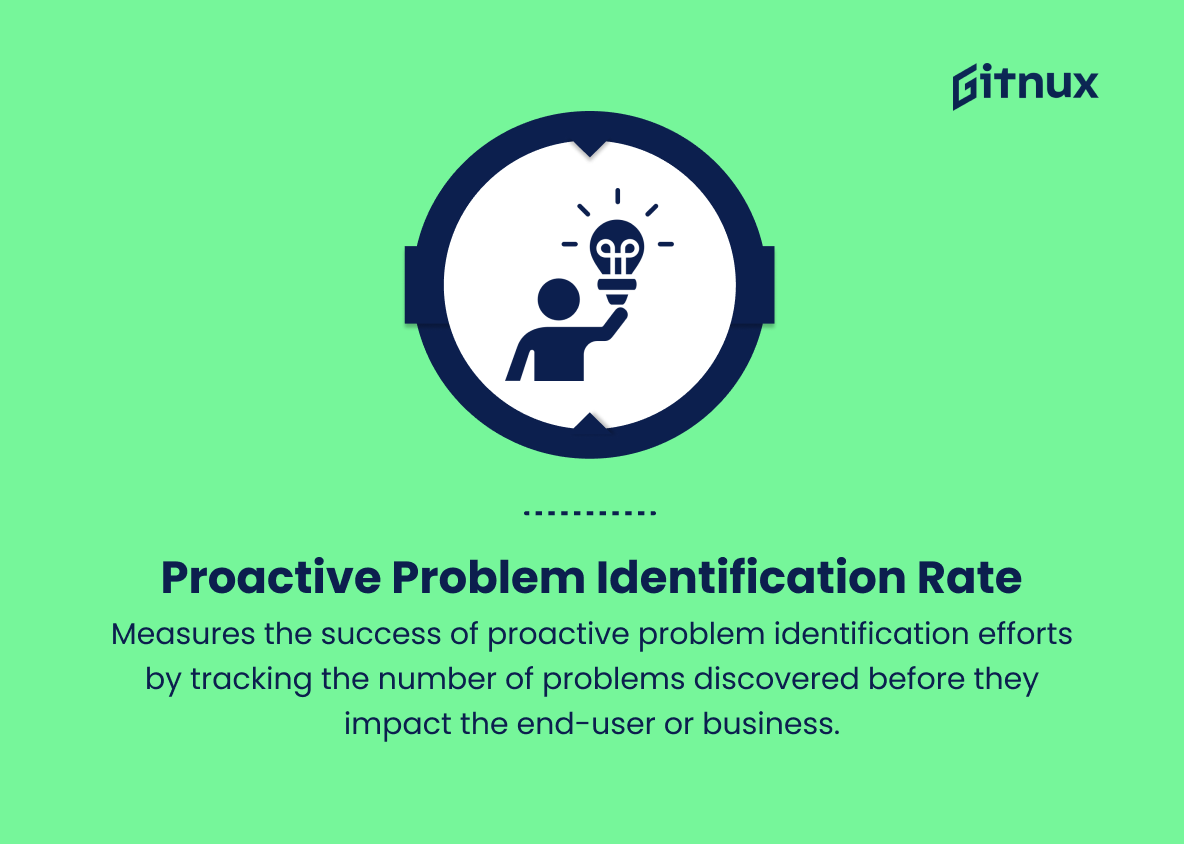
11. Proactive Problem Identification Rate
Measures the success of proactive problem identification efforts by tracking the number of problems discovered before they impact the end-user or business.
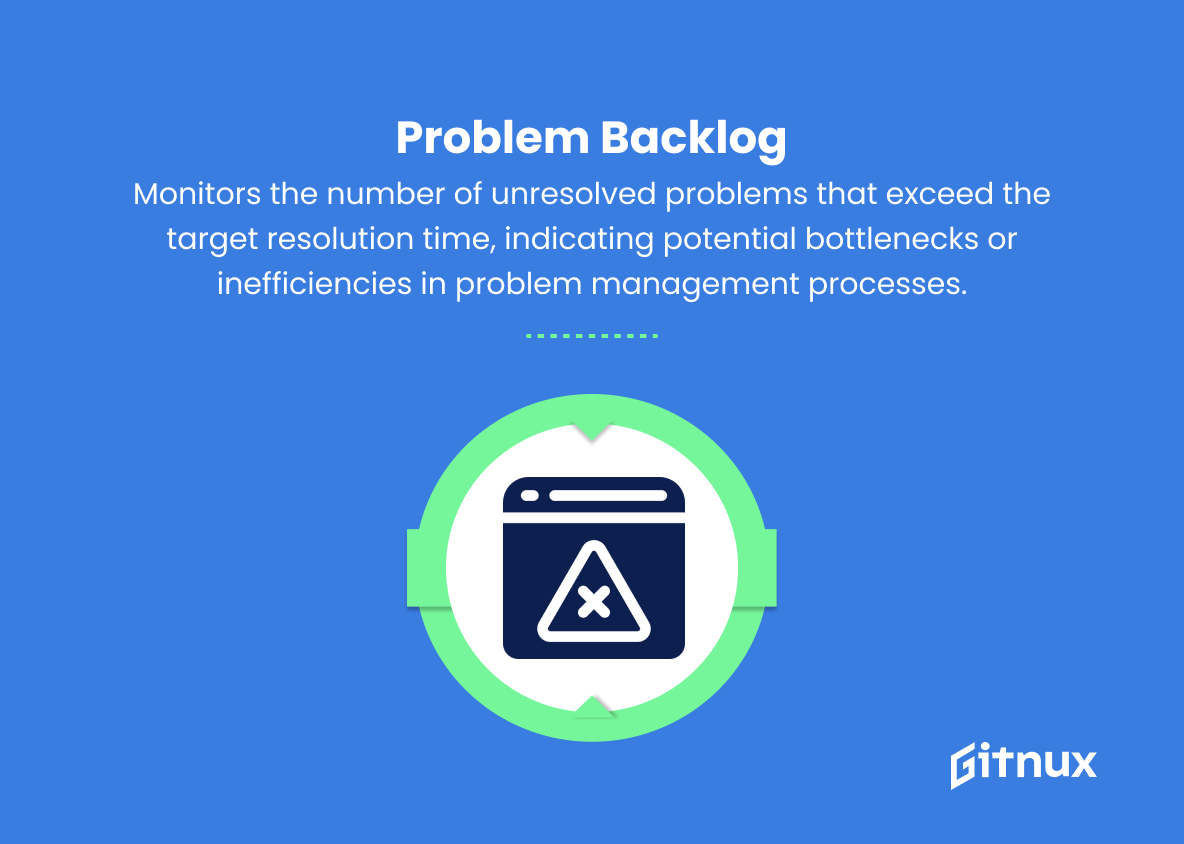
12. Problem Backlog
Monitors the number of unresolved problems that exceed the target resolution time, indicating potential bottlenecks or inefficiencies in problem management processes.
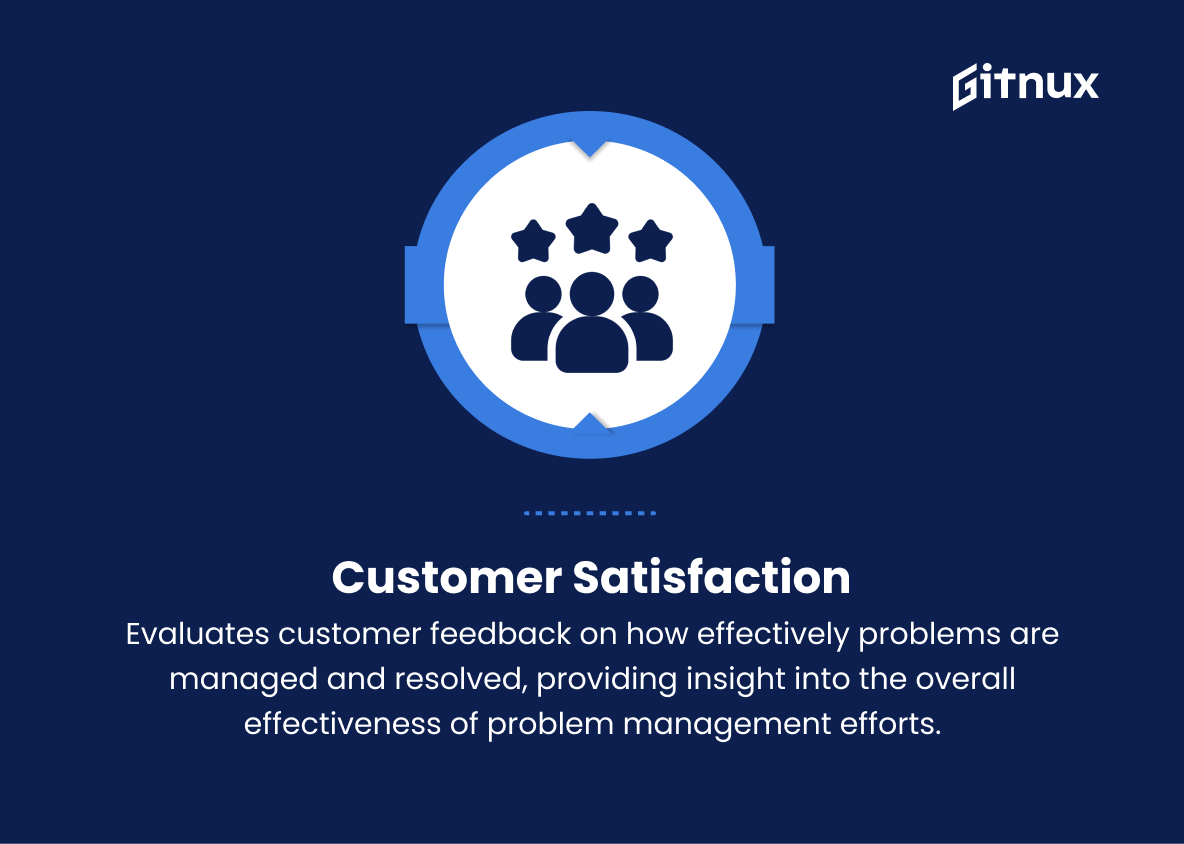
13. Customer Satisfaction
Evaluates customer feedback on how effectively problems are managed and resolved, providing insight into the overall effectiveness of problem management efforts.
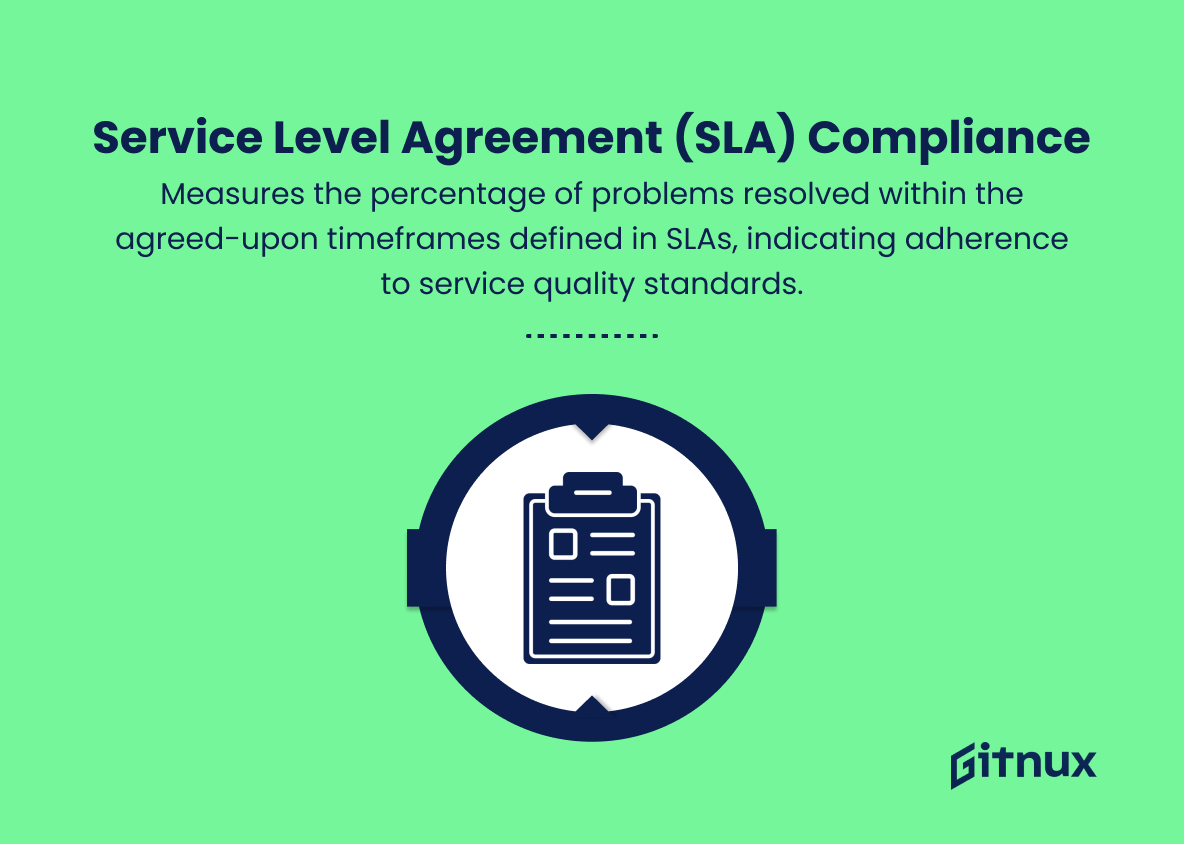
14. Service Level Agreement (SLA) Compliance
Measures the percentage of problems resolved within the agreed-upon timeframes defined in SLAs, indicating adherence to service quality standards.
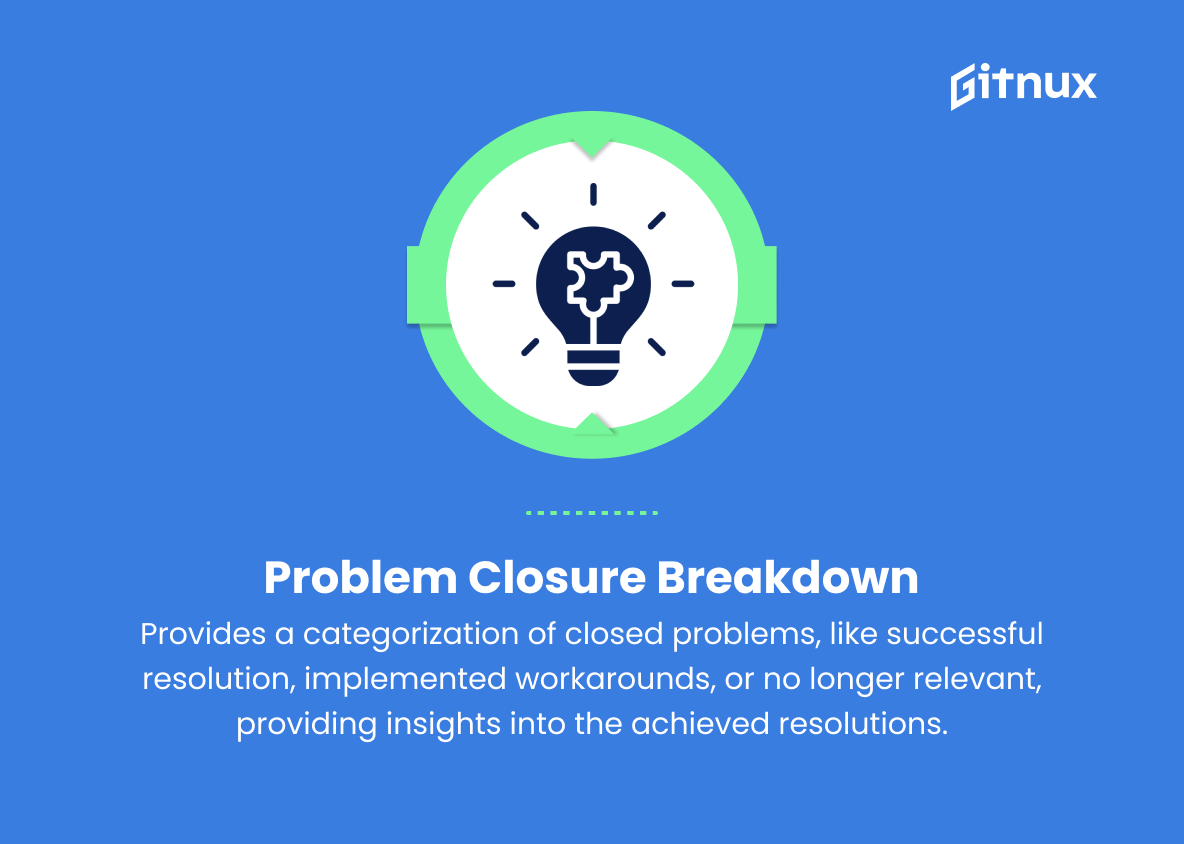
15. Problem Closure Breakdown
Provides a breakdown of problems closed by categories, such as successful resolution, workaround implemented, or no longer relevant, offering insights into the types of resolutions achieved.
Problem Management Metrics Explained
Problem Management Metrics play a crucial role in ensuring efficient problem resolution and effective management of IT services. Metrics such as Mean Time To Repair (MTTR) help organizations assess average resolution time, while Problems by Impact and First Time Fix Rate (FTFR) enable the identification of high-priority issues and effective first-attempt solutions. Metrics like Problem Recurrence Rate and Problem Age aid in determining the success of root cause elimination efforts and identifying problems requiring additional attention.
Monitoring the Number of Open Problems, Escalation Rate, and Known Error Rate allows organizations to gauge the effectiveness of support resources and knowledge management, while Root Cause Analysis (RCA) Time highlights the efficiency of root cause investigation processes. Organizations can also track improvements or concerns in resolution time through Problem Resolution Time Trend, discover bottlenecks in problem management processes using Problem Backlog, assess customer satisfaction, and ensure SLA compliance through these metrics.
Additionally, Problem Closure Breakdown helps provide insights into the types of resolutions organizations achieve, thus contributing to better decision-making and enhanced overall problem management efforts.
Conclusion
In summary, problem management metrics play a crucial role in shaping an organization’s ability to identify, analyze, resolve, and learn from challenges that may arise within IT processes. These metrics facilitate improved decision-making, streamlined operations, and long-term stability, ultimately contributing to overall business growth and success.
By implementing these key performance indicators and consistently monitoring their progress, companies are better equipped to minimize the potential negative impact of technical issues, enhance customer satisfaction, and maintain a competitive edge in today’s demanding market. It is essential for organizations to invest in developing their problem management practices and to continually review and refine their metrics to foster a proactive and efficient IT environment.
