In today’s data-driven business landscape, a comprehensive understanding of customer behavior is invaluable for companies seeking to enhance user satisfaction and foster long-term relationships. Churn metrics, or the analysis of customer attrition, play a crucial role in identifying potential areas of improvement and predicting revenue trends with precision.
This in-depth blog post aims to shed light on the significance of effective churn metrics, the process of their calculation, and valuable strategies for reducing churn rates, ultimately empowering businesses to maintain a competitive edge and achieve sustainable growth.
Churn Metrics You Should Know
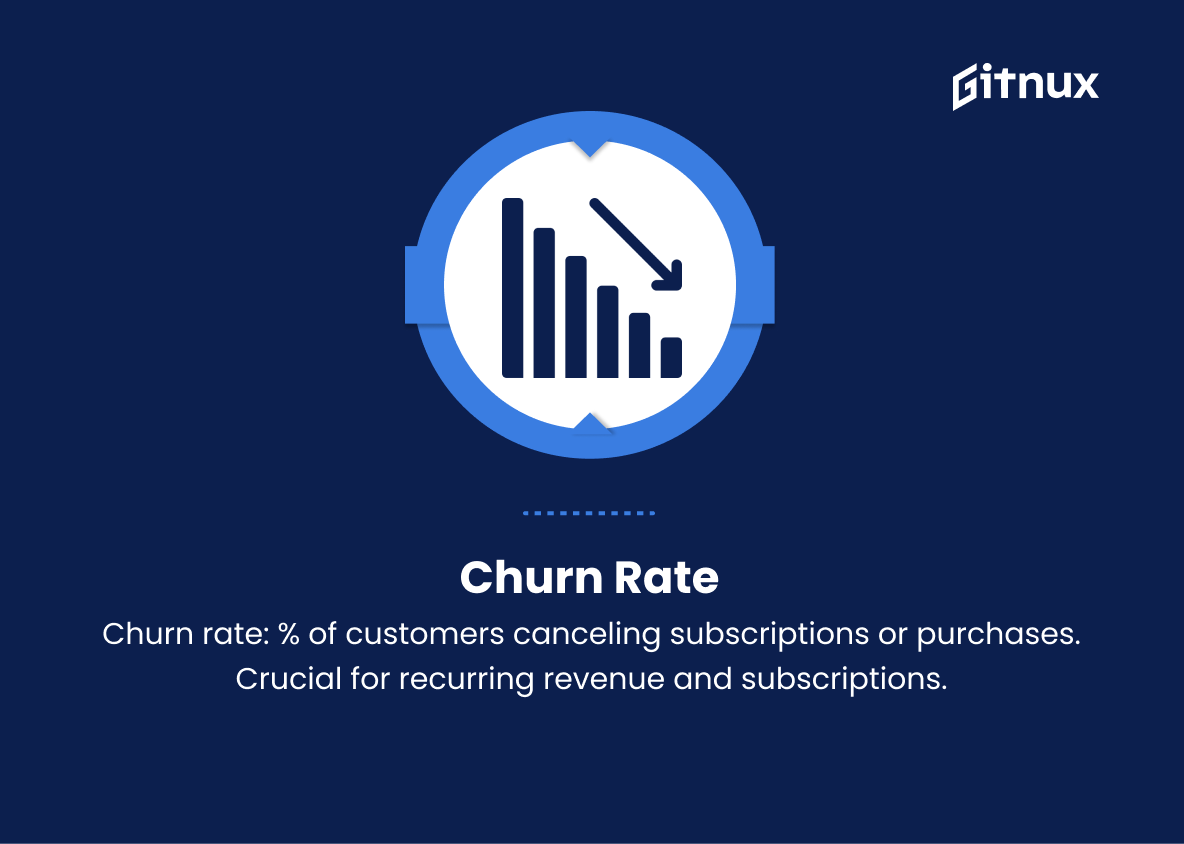
1. Churn Rate
Churn rate refers to the percentage of customers who cancel their subscription or stop buying from a company during a given time period, typically calculated on a monthly or annual basis. It is a critical metric for businesses with recurring revenue models or subscription-based services.
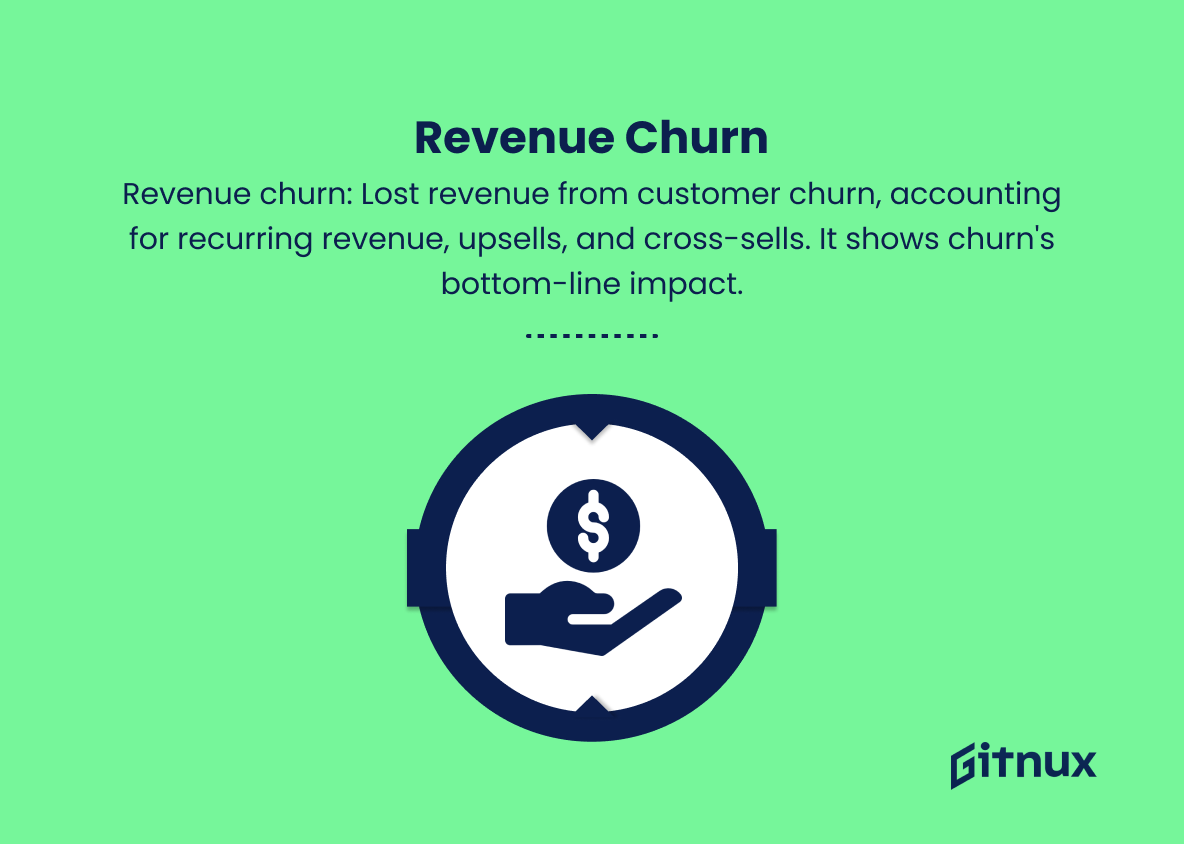
2. Revenue Churn
Revenue churn measures the lost revenue due to customer churn. It takes into account both the loss of recurring revenue and any upsells or cross-sells realized during the customer’s tenure. This metric helps businesses understand the impact of churn on their bottom line.
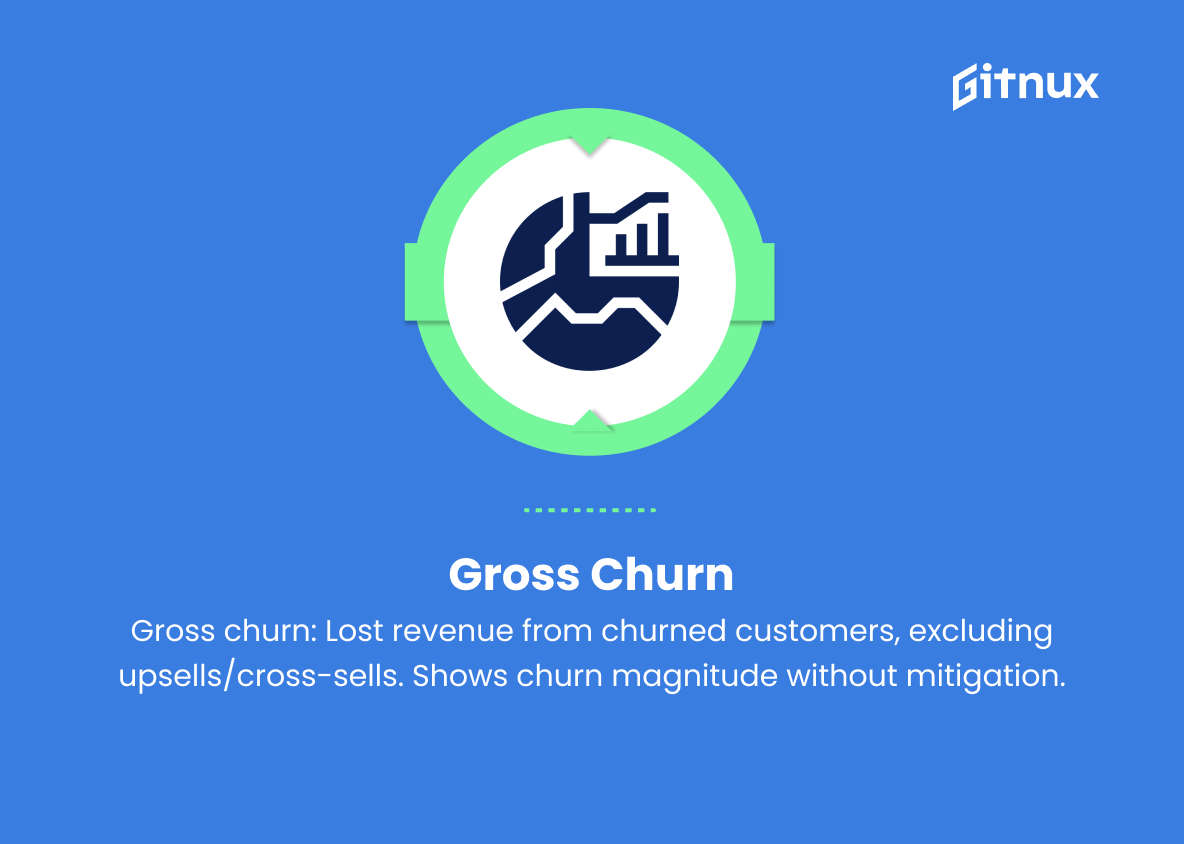
3. Gross Churn
Gross churn is the total lost revenue from churned customers before accounting for any new revenue from existing customers (such as upsells or cross-sells). Gross churn helps businesses understand the full magnitude of the churn issue without considering mitigating factors.
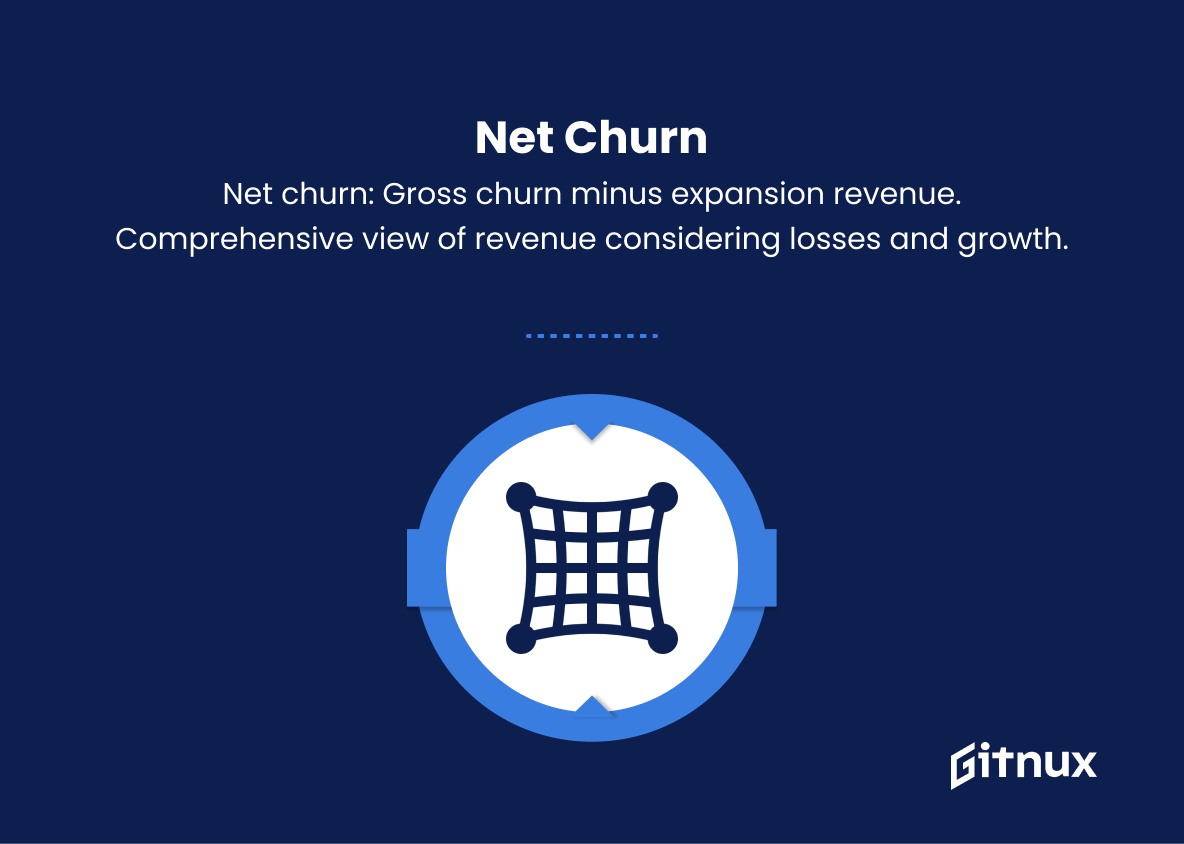
4. Net Churn
Net churn is the difference between gross churn and expansion revenue (additional revenue generated from existing customers). This metric takes into account both the loss of revenue from churned customers and the growth of revenue from retained customers, giving a more comprehensive view of a company’s revenue situation.
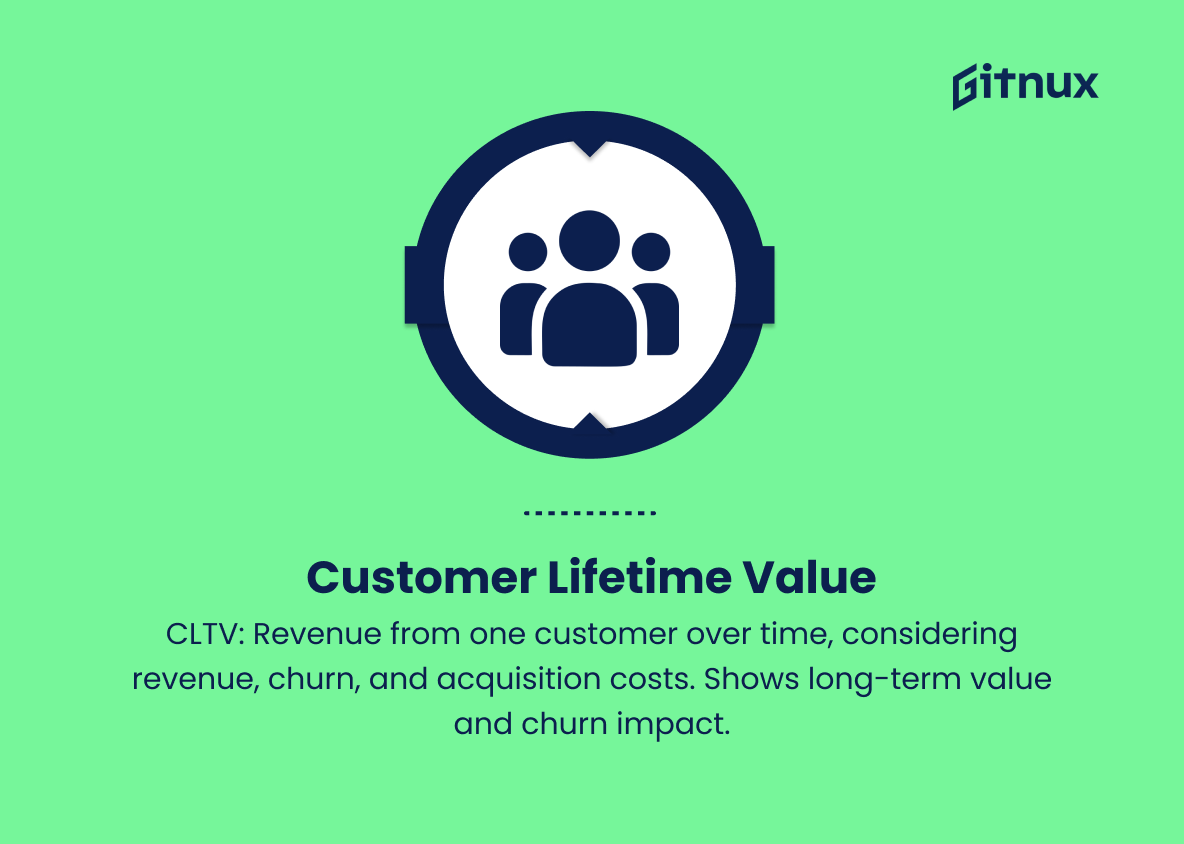
5. Customer Lifetime Value (CLTV)
CLTV is an estimate of the total revenue a business can expect from a single customer over the length of their relationship. It takes into account revenue, churn rate, and customer acquisition costs. CLTV helps businesses understand the long-term value of their customers and the impact of churn on that value.
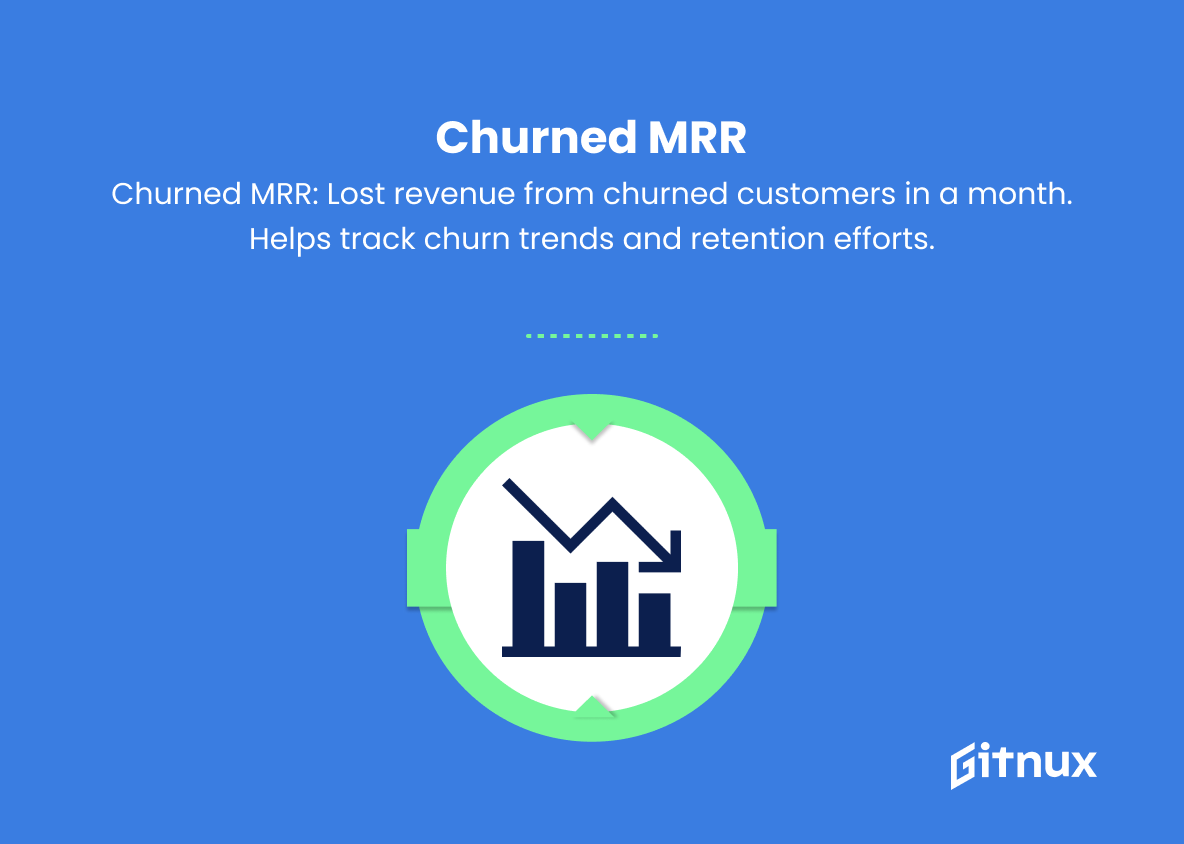
6. Churned MRR (Monthly Recurring Revenue)
Churned MRR refers to the total revenue lost from churned customers in a given month. Tracking the MRR churn can help businesses identify trends in customer churn and measure the effectiveness of retention efforts.
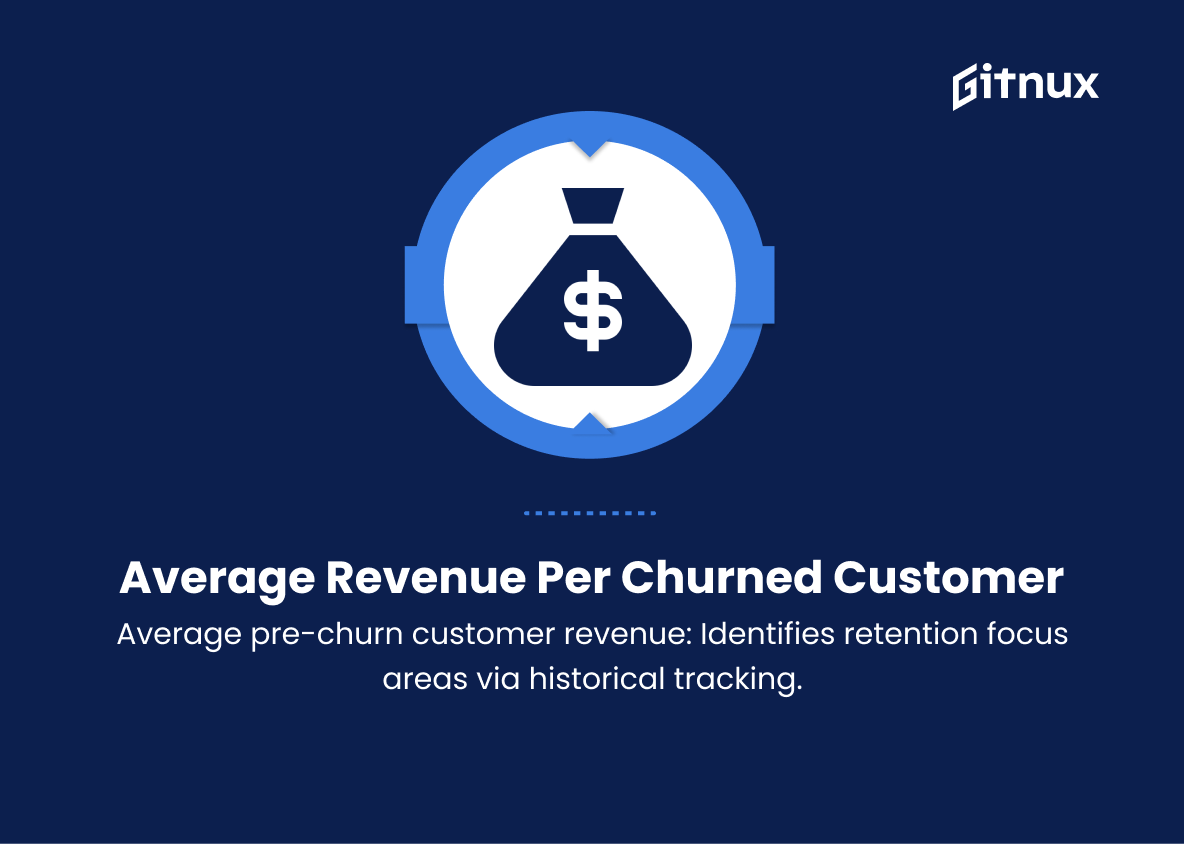
7. Average Revenue Per Churned Customer
This metric measures the average revenue generated by each customer before they churn. By tracking this metric over time, businesses can identify patterns that may point to specific areas of focus for customer retention efforts.
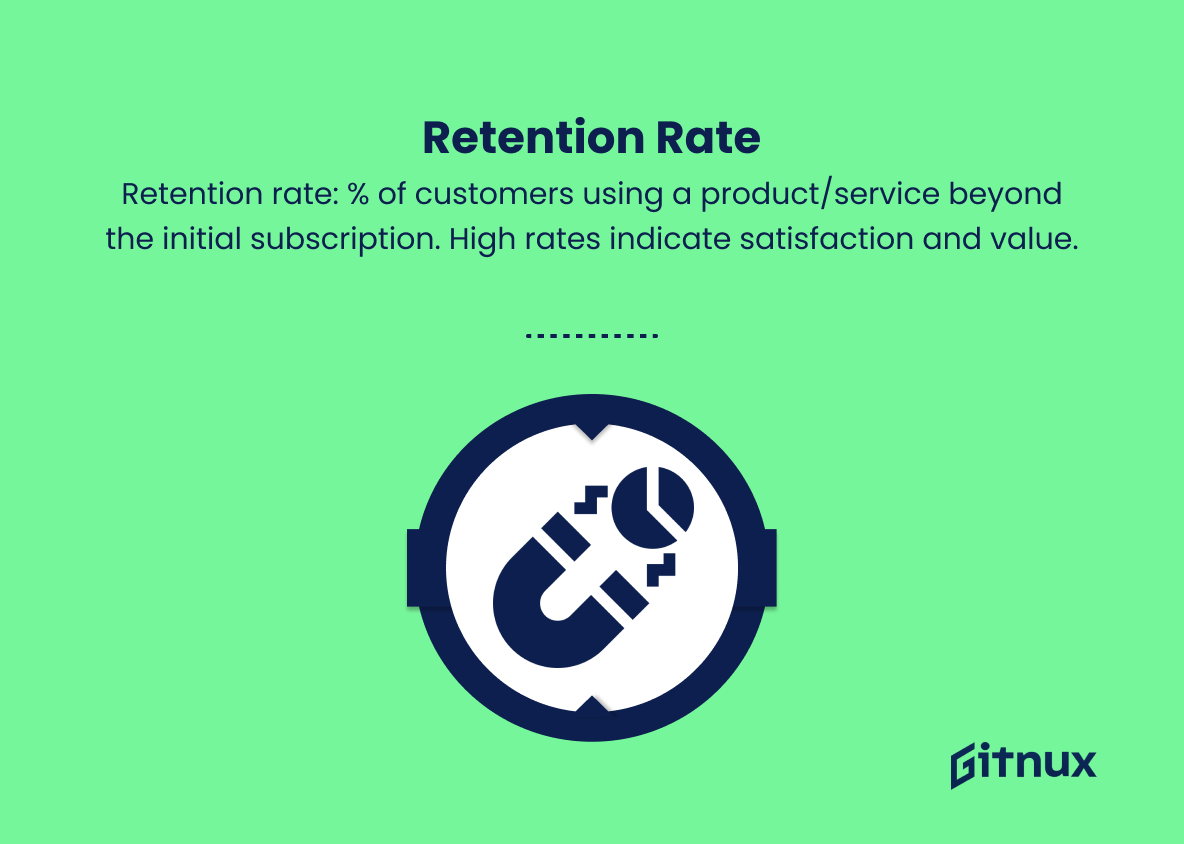
8. Retention Rate
The retention rate represents the percentage of customers that continue to use a product or service after the initial subscription period. A high retention rate is often an indicator of strong customer satisfaction and value.
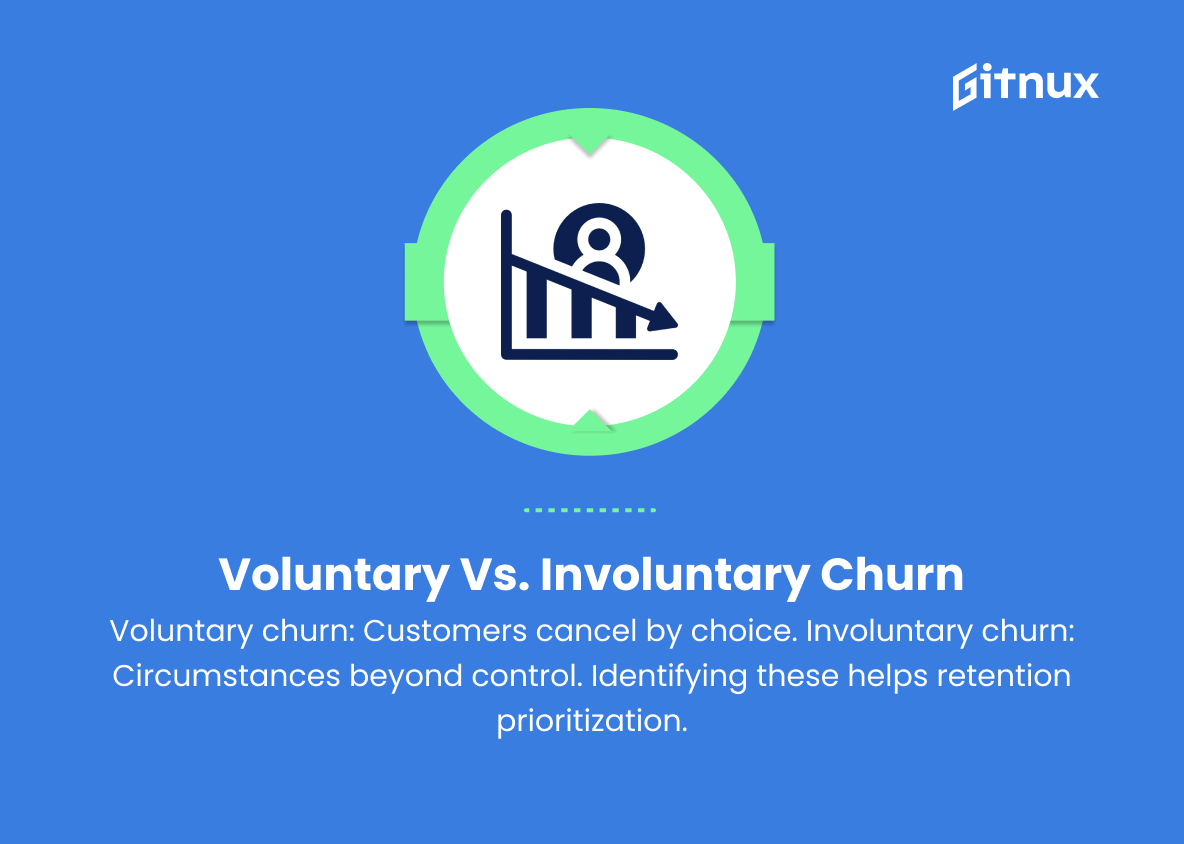
9. Voluntary vs. Involuntary Churn
Voluntary churn occurs when customers willingly choose to cancel their subscription or stop purchasing products, while involuntary churn refers to the loss of customers due to circumstances beyond their control, such as credit card expiration or business closures. Understanding the difference between these types of churn enables businesses to identify and prioritize their retention efforts.
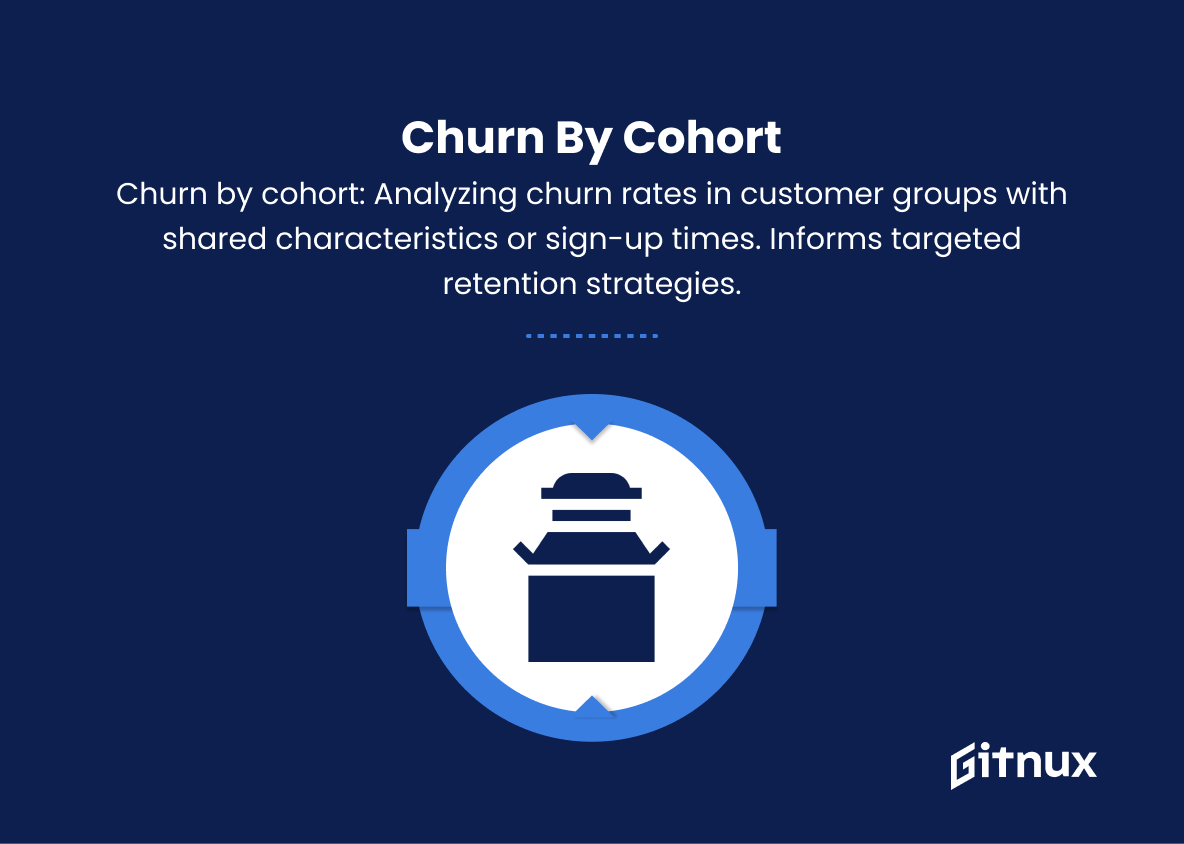
10. Churn by Cohort
Churn by cohort looks at the churn rate for groups of customers who joined at the same time or share a similar characteristic (e.g., industry, product tier, marketing channel). This metric can help businesses identify trends and patterns in customer churn unique to specific cohorts, informing more targeted retention strategies.
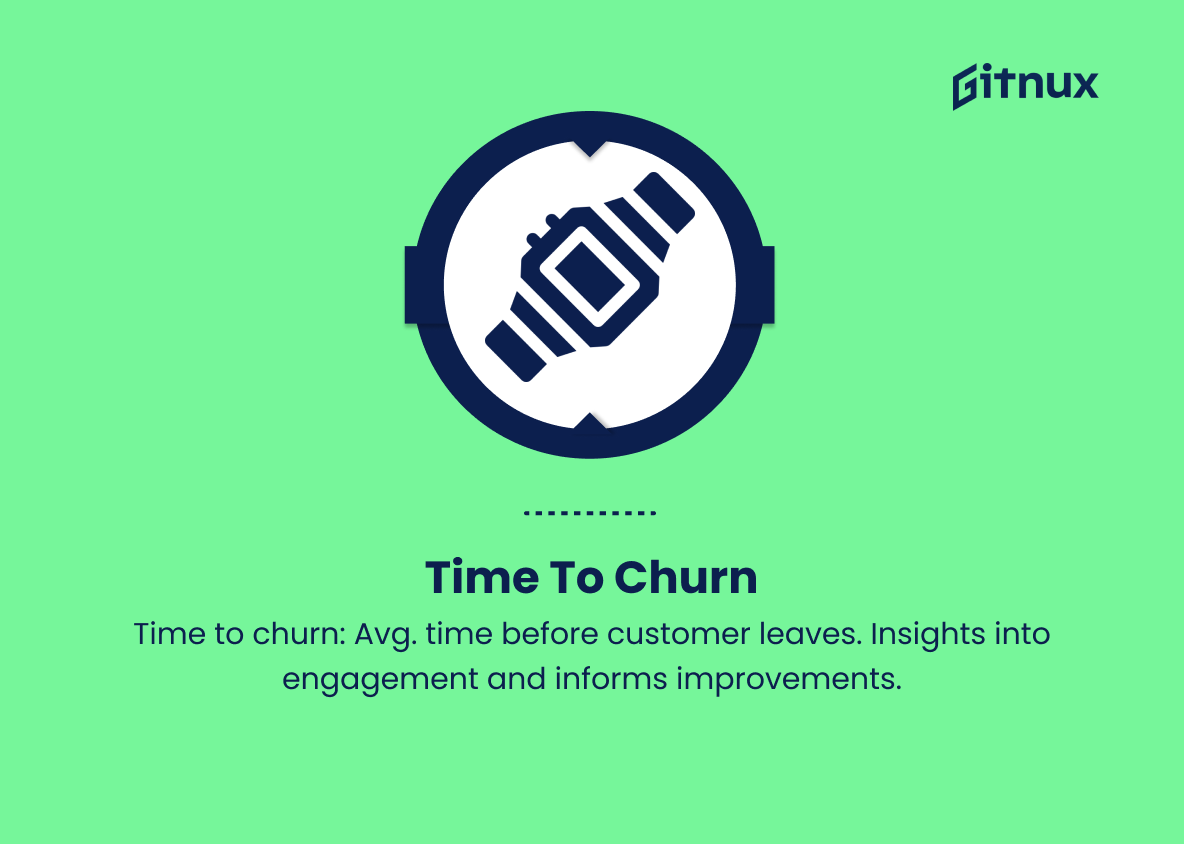
11. Time to Churn
Time to churn measures the average amount of time a customer stays with a company before churning. This metric can provide insight into how long customers engage with a product or service before deciding to leave, which can inform customer success and product improvement initiatives.
Churn Metrics Explained
Churn metrics are essential for businesses to understand their customer base and make informed decisions about retention strategies. They help companies assess the magnitude of customer loss (churn rate), determine the financial impact of churn (revenue churn, gross churn, and net churn), and evaluate the long-term value of customers (CLTV). Churn metrics also enable businesses to monitor the monthly recurring revenue lost from churned customers (churned MRR), analyze patterns in the average revenue generated by churned customers, and measure retention rates to gauge customer satisfaction levels.
To target retention efforts effectively, businesses must distinguish between voluntary and involuntary churn and monitor cohort-specific churn rates. Additionally, the time to churn metric provides valuable information on customer engagement duration, helping businesses prioritize improvements to their products or services to enhance customer satisfaction and retention. These diverse churn metrics are crucial for comprehending the dynamics of customer relationships and implementing successful retention strategies.
Conclusion
In summary, understanding and analyzing churn metrics is a crucial aspect of any business’s long-term success, particularly within the ever-competitive digital landscape. By delving into these key performance indicators and adjusting strategies accordingly, organizations can not only retain their current customer base but also detect areas for improvement and pave the way for growth.
By continually monitoring churn metrics, companies can keep a finger on the pulse, ensuring their practices are evolving in response to customer needs and expectations. Ultimately, proactively addressing and mitigating churn ensures a healthy, profitable, and sustainable business. So, take the time, invest in the right tools, and make churn metrics a staple in your data-driven decision-making process.
