

In today’s highly competitive business landscape, the success of professional service firms is increasingly dependent on their ability to effectively measure, manage, and optimize key performance indicators (KPIs). With a growing emphasis on data-driven decision-making, Professional Services Metrics have become an indispensable tool for evaluating organizational efficiency, profitability, and overall performance. In this insightful blog post, we will delve into the critical metrics that every professional service firm should monitor and analyze to guarantee continuous improvement and adaptability in the face of ever-evolving client needs and industry trends. From utilization rates and project margins to client satisfaction and employee retention, we will uncover the essential indicators that will empower your firm to make strategic decisions and drive sustainable growth.
Professional Services Metrics You Should Know
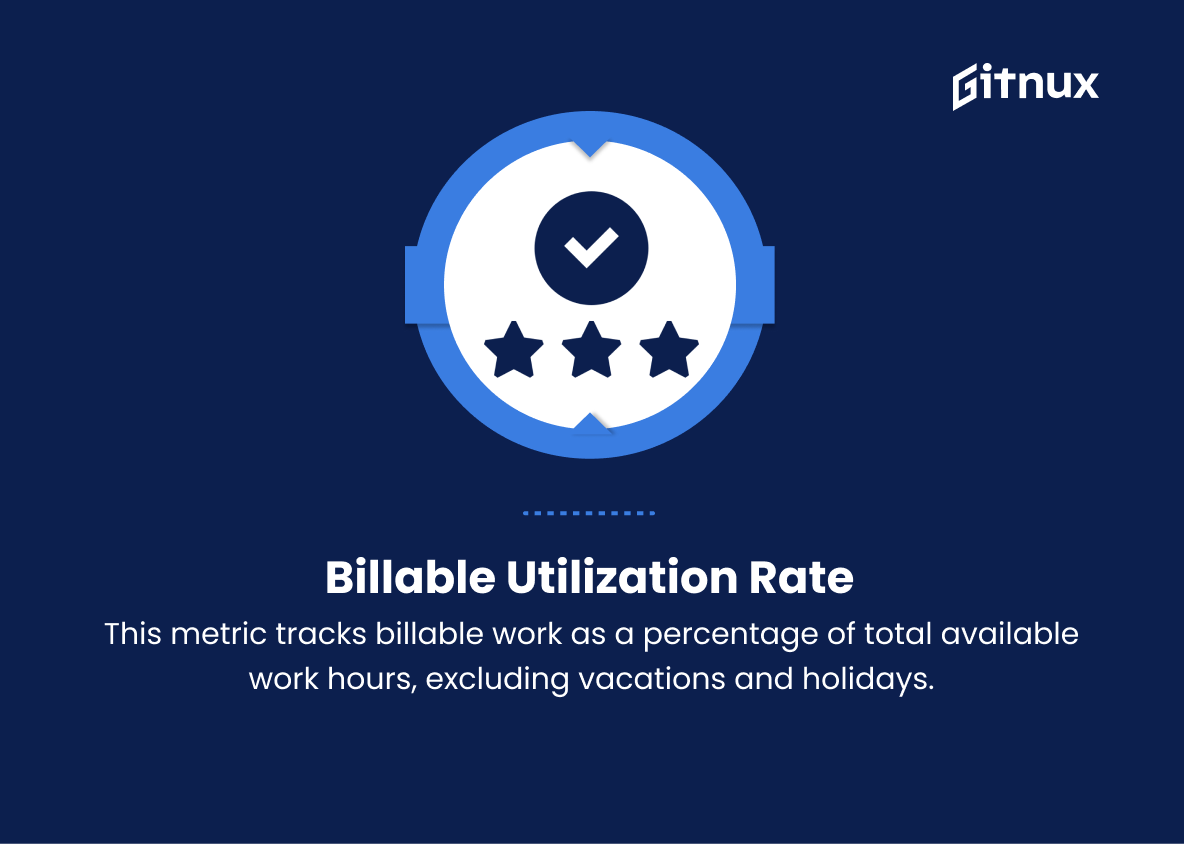
1. Billable Utilization Rate
This metric measures the percentage of time spent by employees on billable activities (project work for clients) compared to their total available work hours (excluding vacations, holidays, etc.).
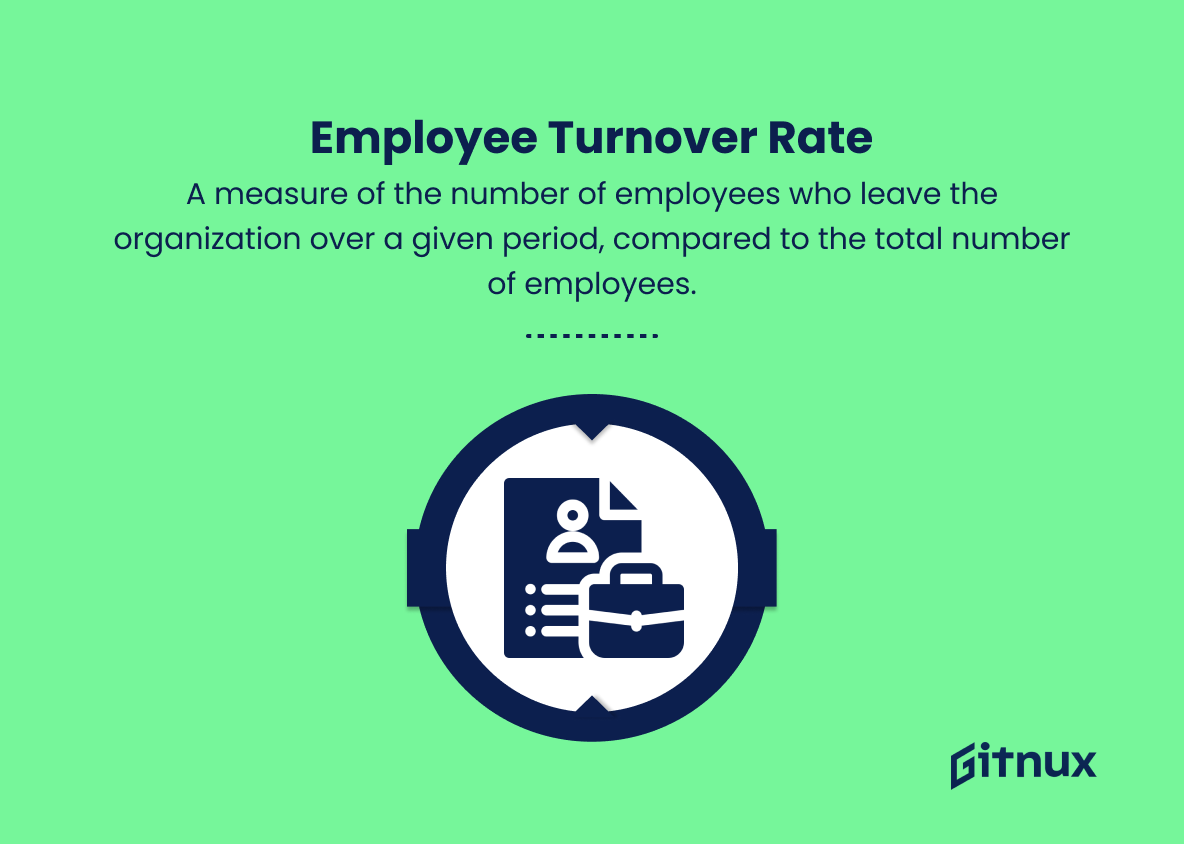
2. Employee Turnover Rate
A measure of the number of employees who leave the organization over a given period, compared to the total number of employees. A high turnover rate may indicate issues with employee satisfaction, management, or company culture.
3. Client Satisfaction Score (CSAT)
A metric measuring the overall satisfaction of clients with the professional services provided. This can be gathered through surveys, interviews, and other methods to gauge client sentiment towards the service.
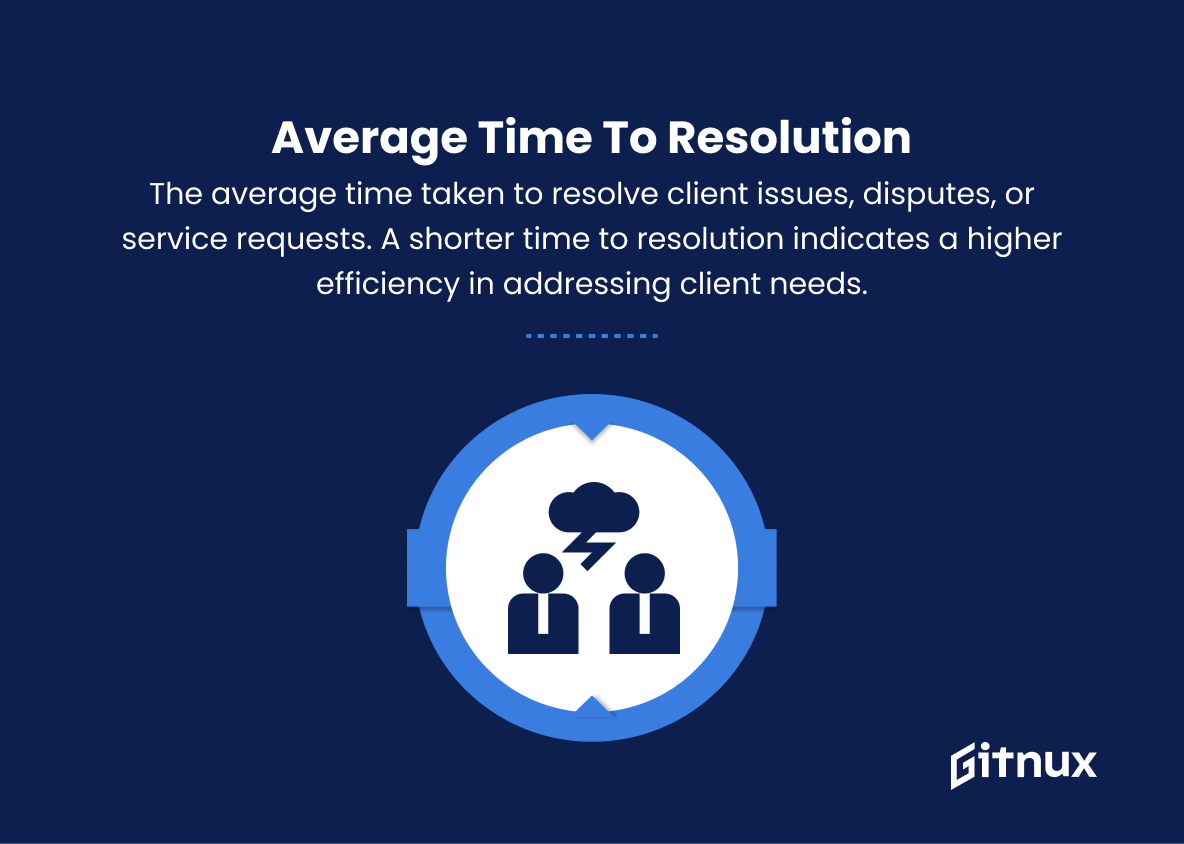
4. Average Time to Resolution
The average time taken to resolve client issues, disputes, or service requests. A shorter time to resolution indicates a higher efficiency in addressing client needs.
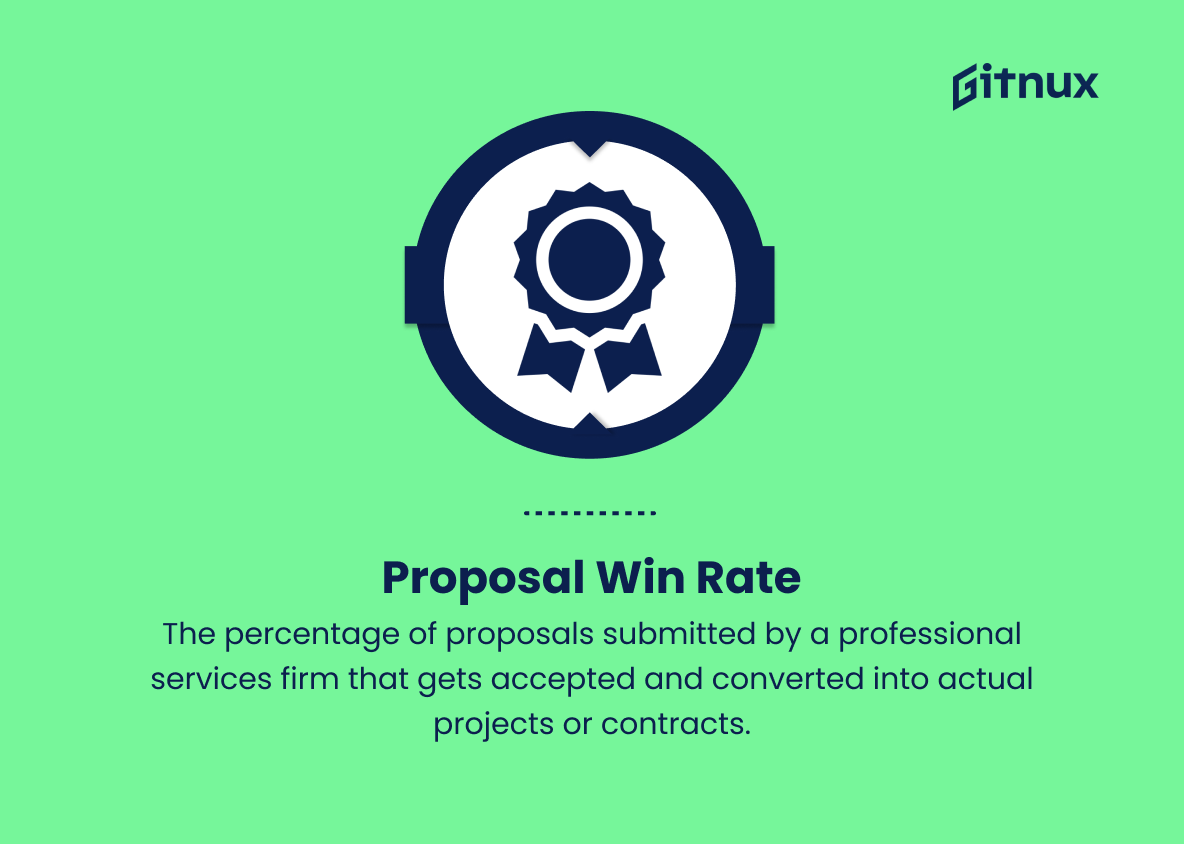
5. Proposal Win Rate
The percentage of proposals submitted by a professional services firm that gets accepted and converted into actual projects or contracts. This indicates how well the firm’s proposals align with client requirements and expectations.
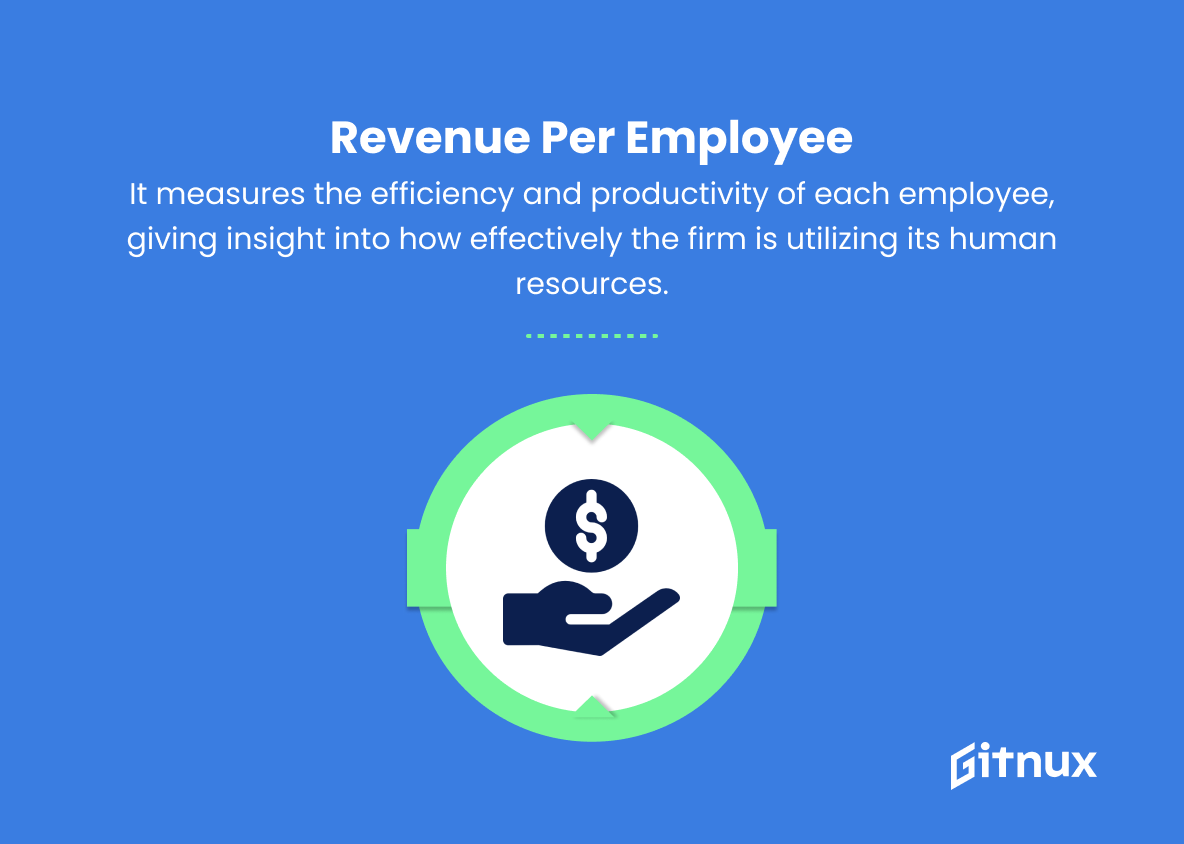
6. Revenue per Employee
This metric divides the company’s total revenue by the number of employees. It measures the efficiency and productivity of each employee, giving insight into how effectively the firm is utilizing its human resources.
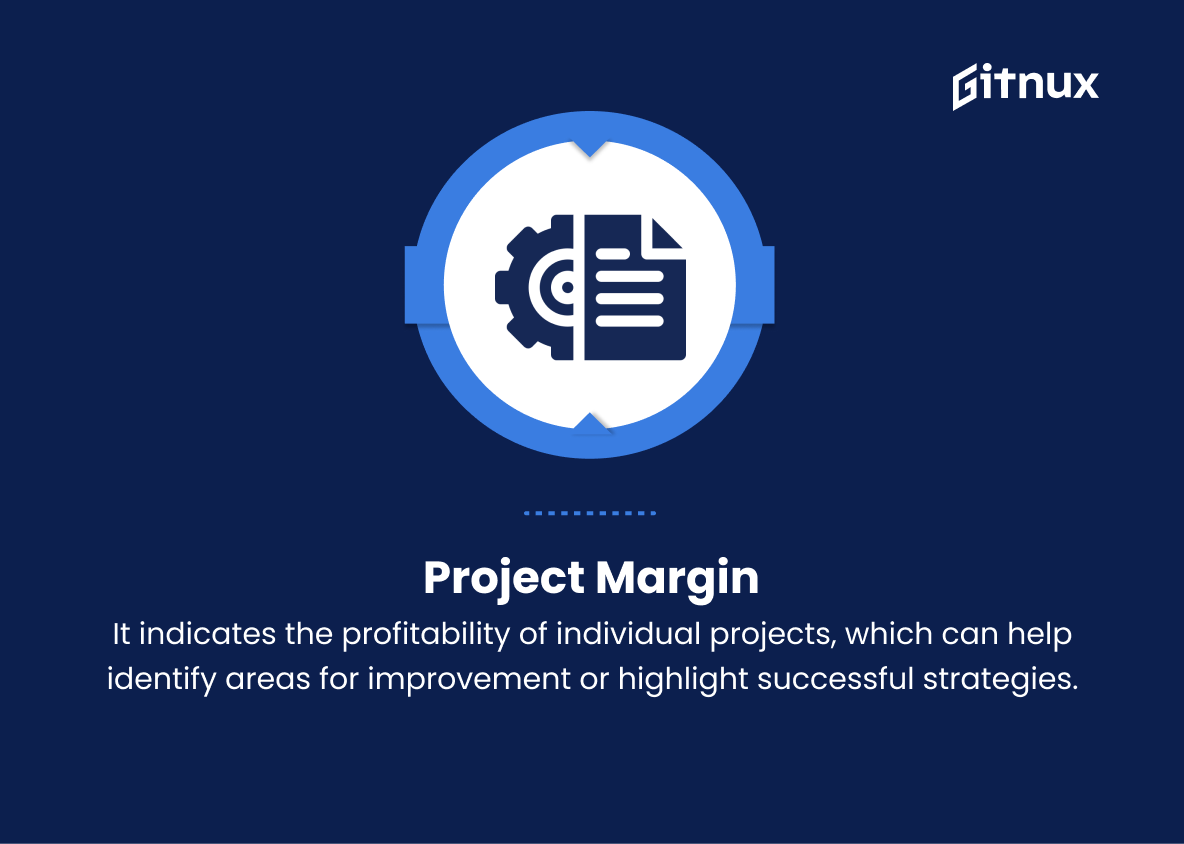
7. Project Margin
The difference between a project’s revenue and its direct costs, expressed as a percentage. It indicates the profitability of individual projects, which can help identify areas for improvement or highlight successful strategies.
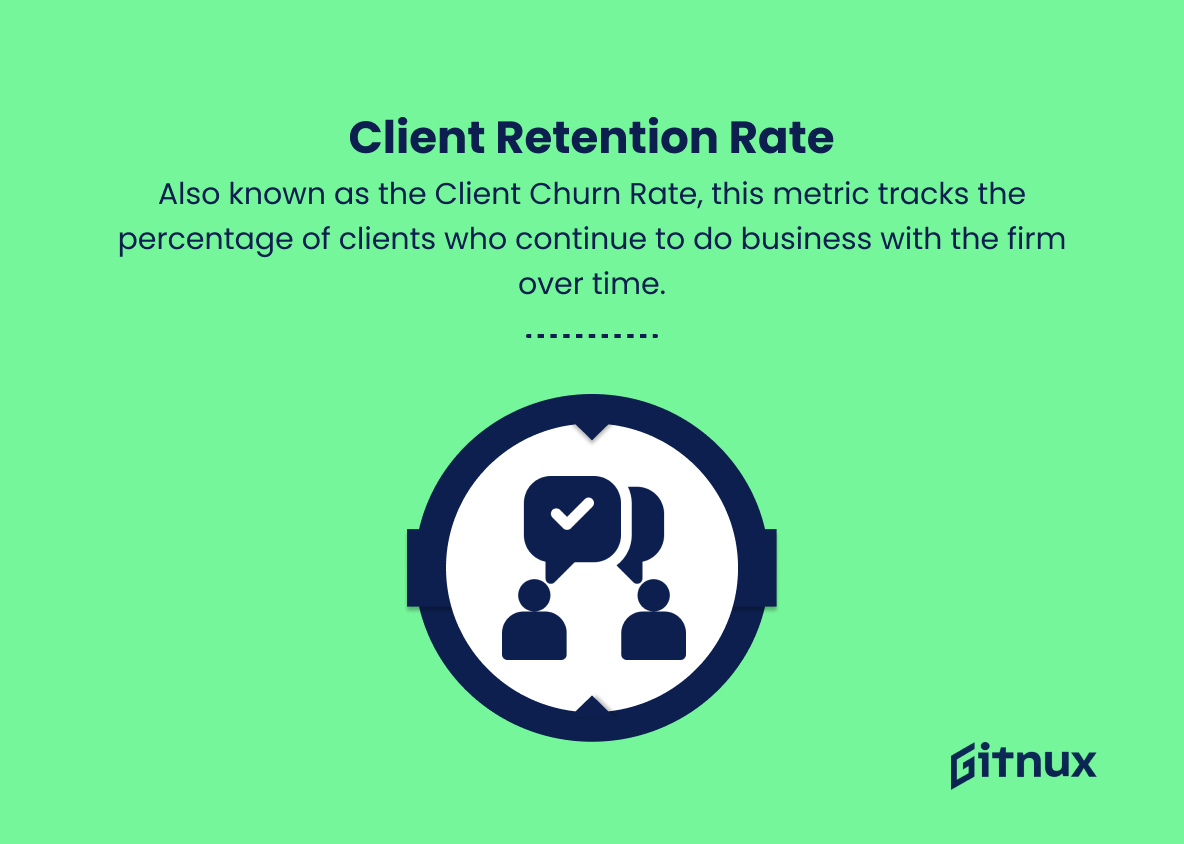
8. Client Retention Rate
Also known as the Client Churn Rate, this metric tracks the percentage of clients who continue to do business with the firm over time. A high retention rate suggests that clients see value in the services provided and are satisfied with the service quality.
9. Employee Training and Development Hours
The average number of hours dedicated to employee training and skills development. This metric showcases the company’s commitment to nurturing talent and ensuring that employees are equipped with the skills and knowledge necessary to serve clients effectively.
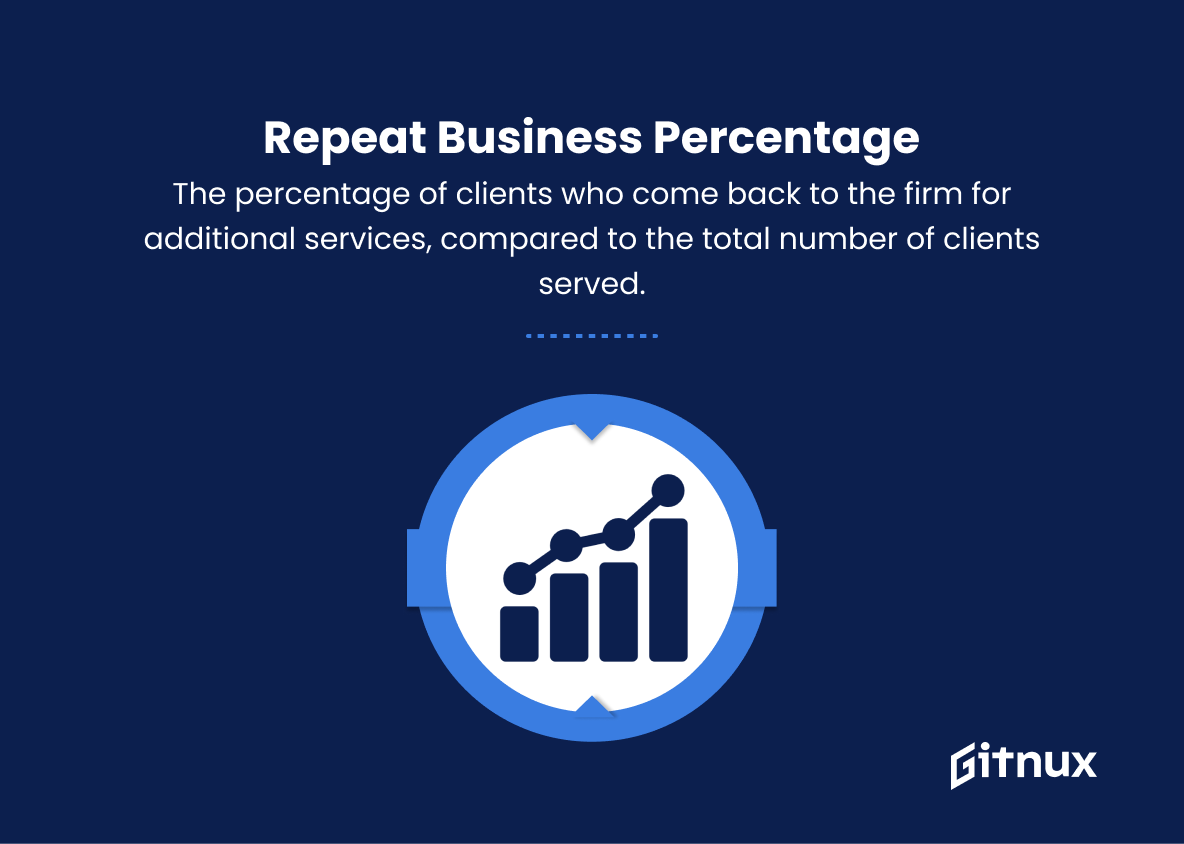
10. Repeat Business Percentage
The percentage of clients who come back to the firm for additional services, compared to the total number of clients served. This is an indicator of client loyalty and satisfaction and can help uncover areas of service excellence or opportunities to improve client experiences.
Professional Services Metrics Explained
The importance of these Professional Services Metrics lies in their ability to provide valuable insight into various aspects of a company’s performance and overall health. Billable Utilization Rate indicates the efficiency of employees in generating revenue through billable work, while Employee Turnover Rate and Client Satisfaction Score (CSAT) shed light on employee satisfaction and client sentiment, respectively. Meanwhile, Average Time to Resolution and Proposal Win Rate measure the quality and competitiveness of service delivery, while Revenue per Employee and Project Margin are key indicators of financial health and profitability.
Client Retention Rate and Employee Training and Development Hours show a firm’s commitment to client satisfaction and personnel development, ultimately contributing to the firm’s overall success. Lastly, Repeat Business Percentage is a vital measure of client loyalty, which can help a company identify areas of strength and opportunities for improvement, thereby ensuring long-term growth and success.
Conclusion
In closing, effective Professional Services Metrics are crucial for the success and growth of any company offering specialized services. By monitoring and analyzing key performance indicators such as utilization rates, project margins, client satisfaction, and staff turnover, businesses can make informed decisions that positively impact their bottom line. Furthermore, these metrics provide insights into areas requiring improvement and highlight opportunities for growth, enabling organizations to adapt and thrive in an increasingly competitive service landscape. As businesses continue to evolve, prioritizing and refining these metrics will ensure a proactive approach to increasing efficiency, productivity, and overall client satisfaction, ultimately leading to long-lasting success.
