

In an ever-evolving digital landscape, it is crucial for ecommerce businesses to optimize their search metrics in order to stay ahead of the competition and maintain strong visibility in an increasingly crowded marketplace. As more customers turn to the internet for shopping, search rankings and user behavior metrics play a significant role in driving traffic, generating leads, and ultimately, boosting sales.
This blog post delves into the nuances of ecommerce search metrics, dissecting the key performance indicators that matter most, and sharing insights on how online businesses can harness the power of data-driven strategies to ensure a successful and sustainable digital presence.
Ecommerce Search Metrics You Should Know
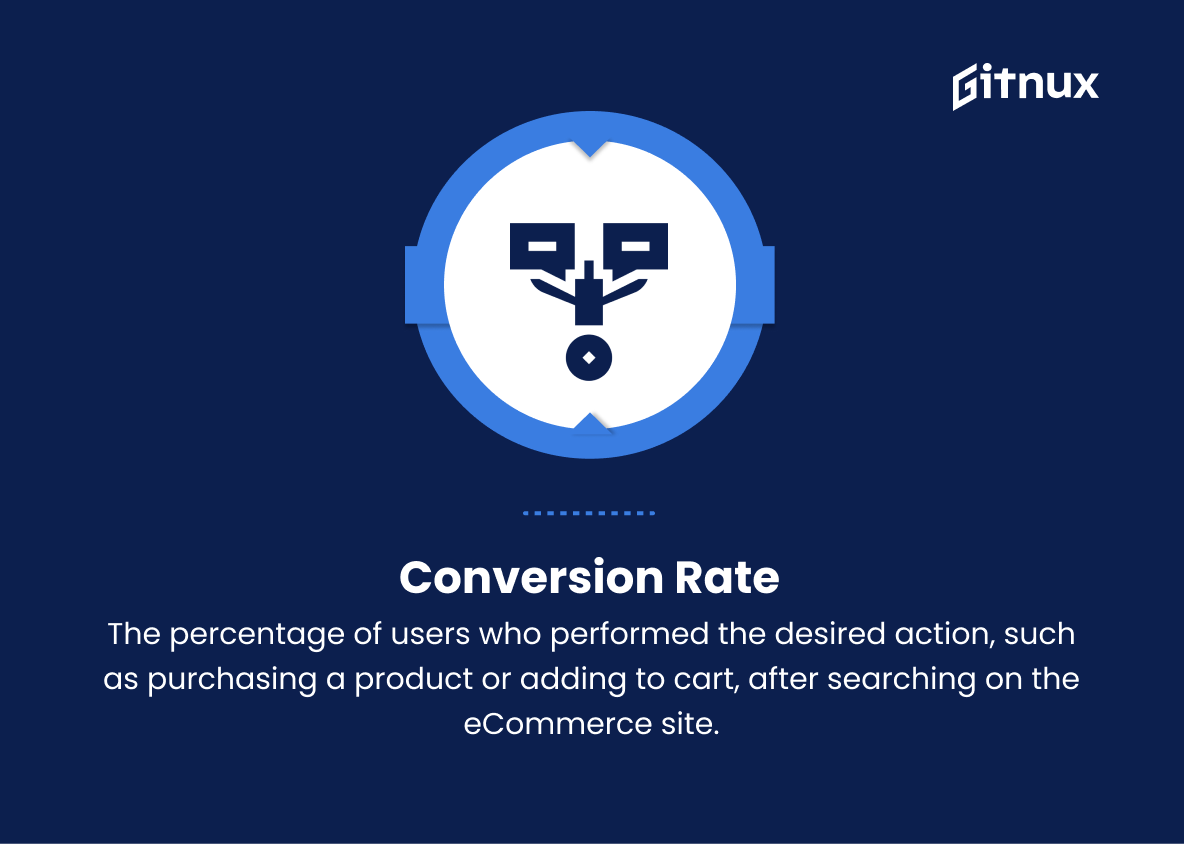
1. Conversion Rate
The percentage of users who performed the desired action, such as purchasing a product or adding to cart, after searching on the eCommerce site. This metric shows the effectiveness of the search feature in driving sales.
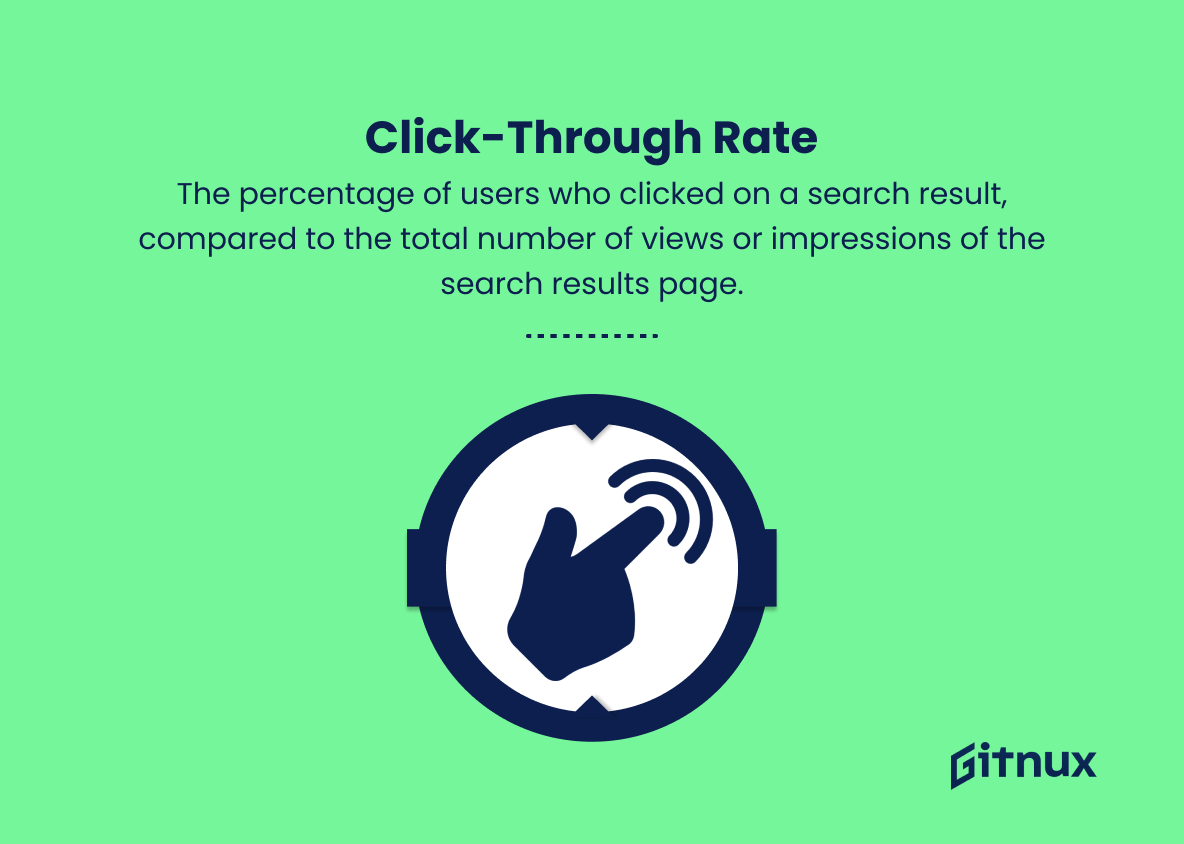
2. Click-Through Rate (CTR)
The percentage of users who clicked on a search result, compared to the total number of views or impressions of the search results page. This metric indicates the relevance of search results to users’ queries.
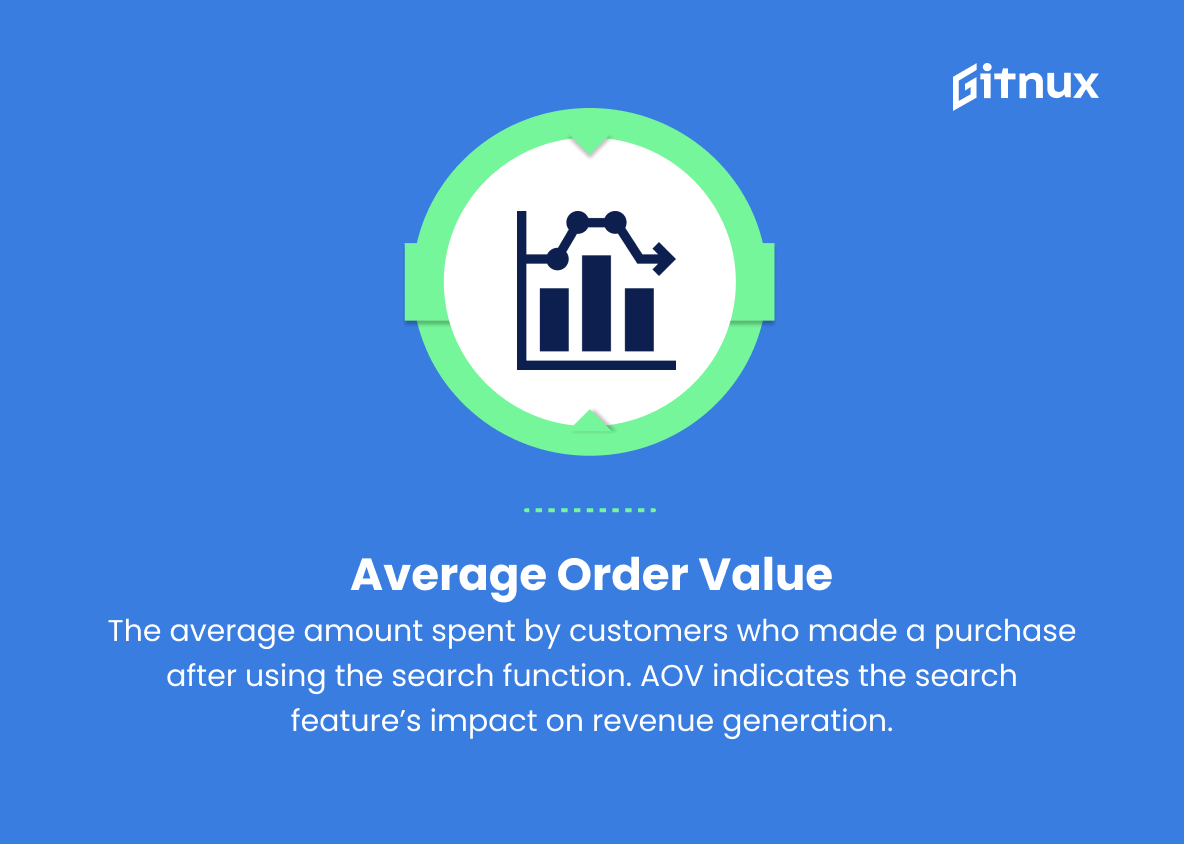
3. Average Order Value (AOV)
The average amount spent by customers who made a purchase after using the search function. AOV indicates the search feature’s impact on revenue generation.
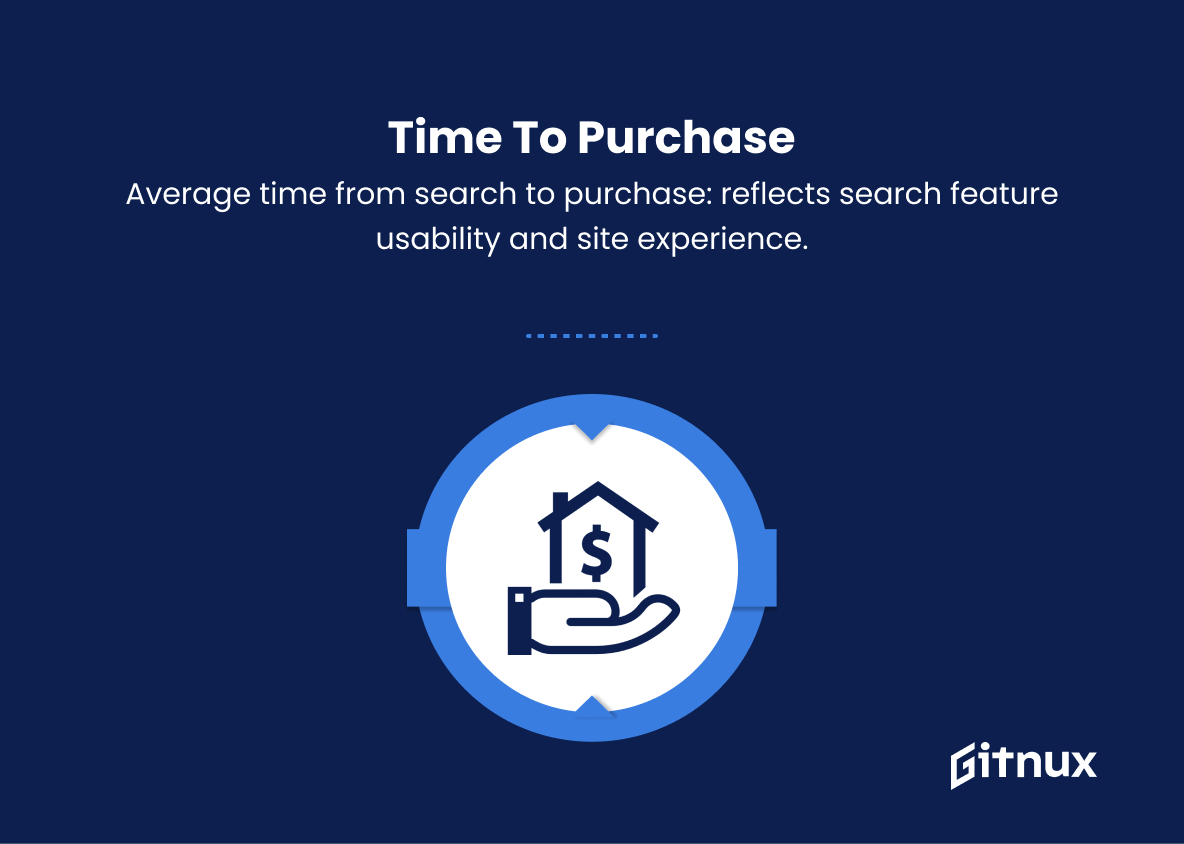
4. Time to Purchase
The average time taken by users to make a purchase after performing a search. This metric can indicate the user-friendliness of the search feature as well as the overall site experience.
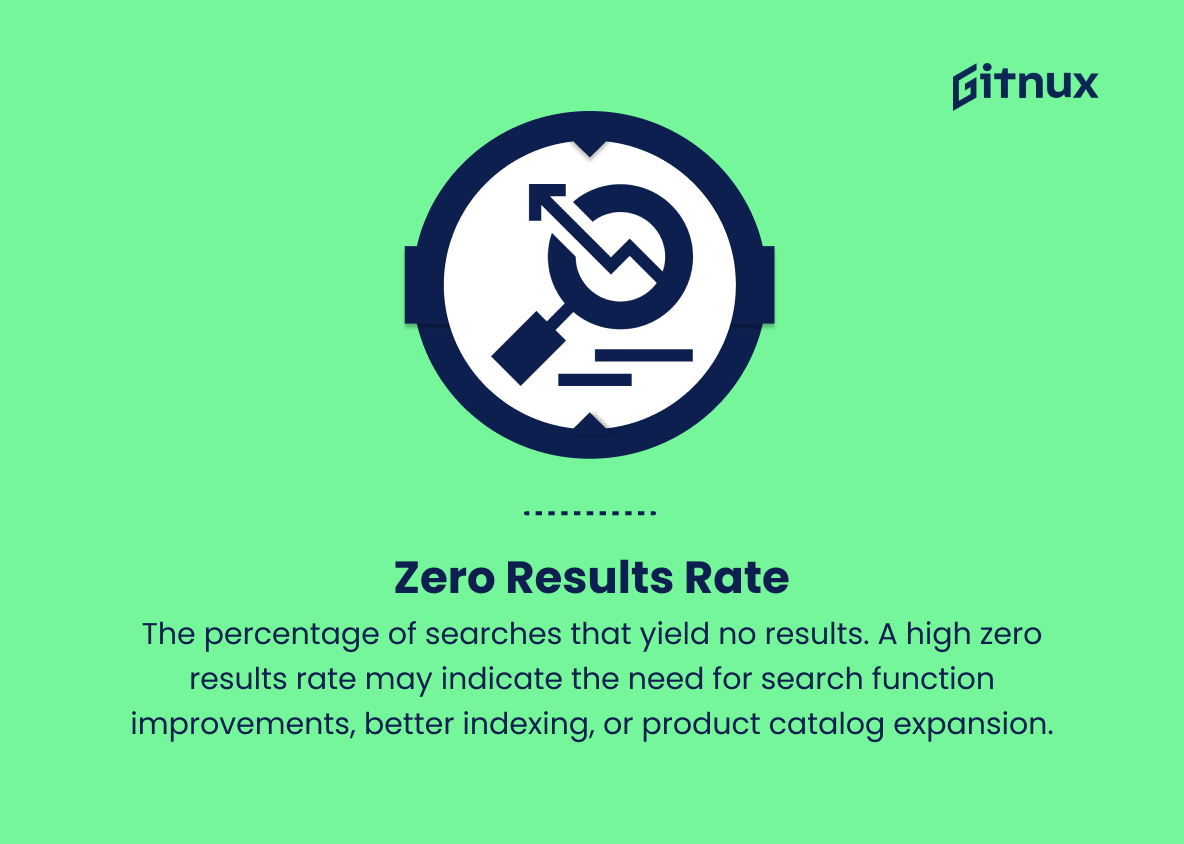
5. Zero Results Rate
The percentage of searches that yield no results. A high zero results rate may indicate the need for search function improvements, better indexing, or product catalog expansion.
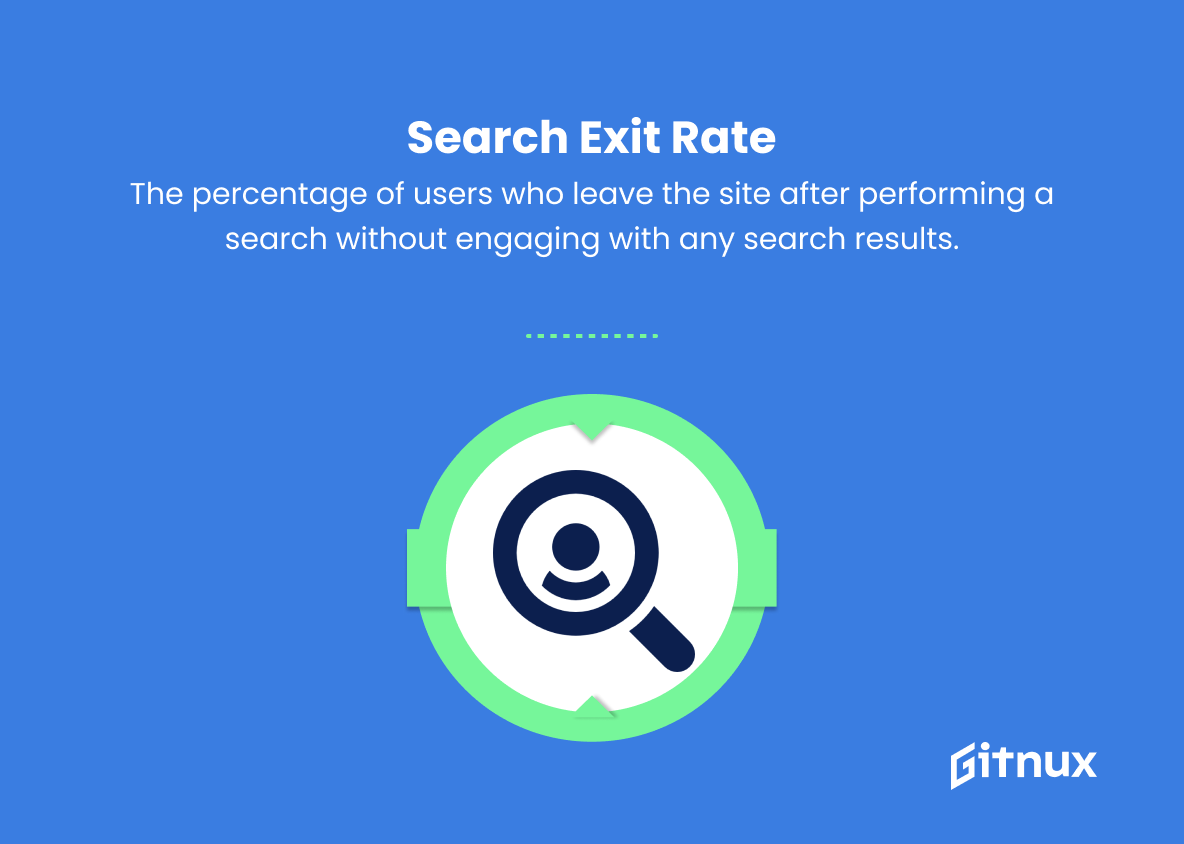
6. Search Exit Rate
The percentage of users who leave the site after performing a search without engaging with any search results. This metric may indicate that search results are not relevant or fail to meet user expectations.
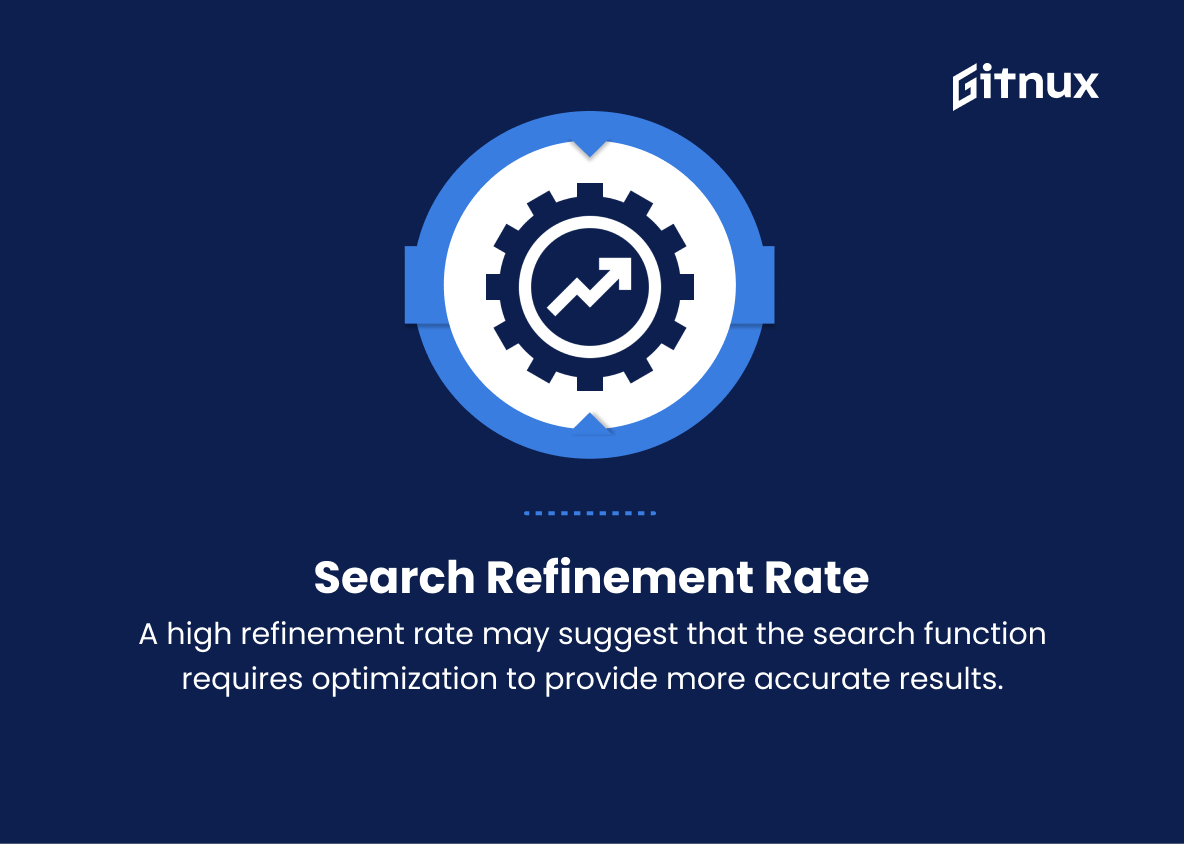
7. Search Refinement Rate
The percentage of users who modify their search queries to find desired products. A high refinement rate may suggest that the search function requires optimization to provide more accurate results.
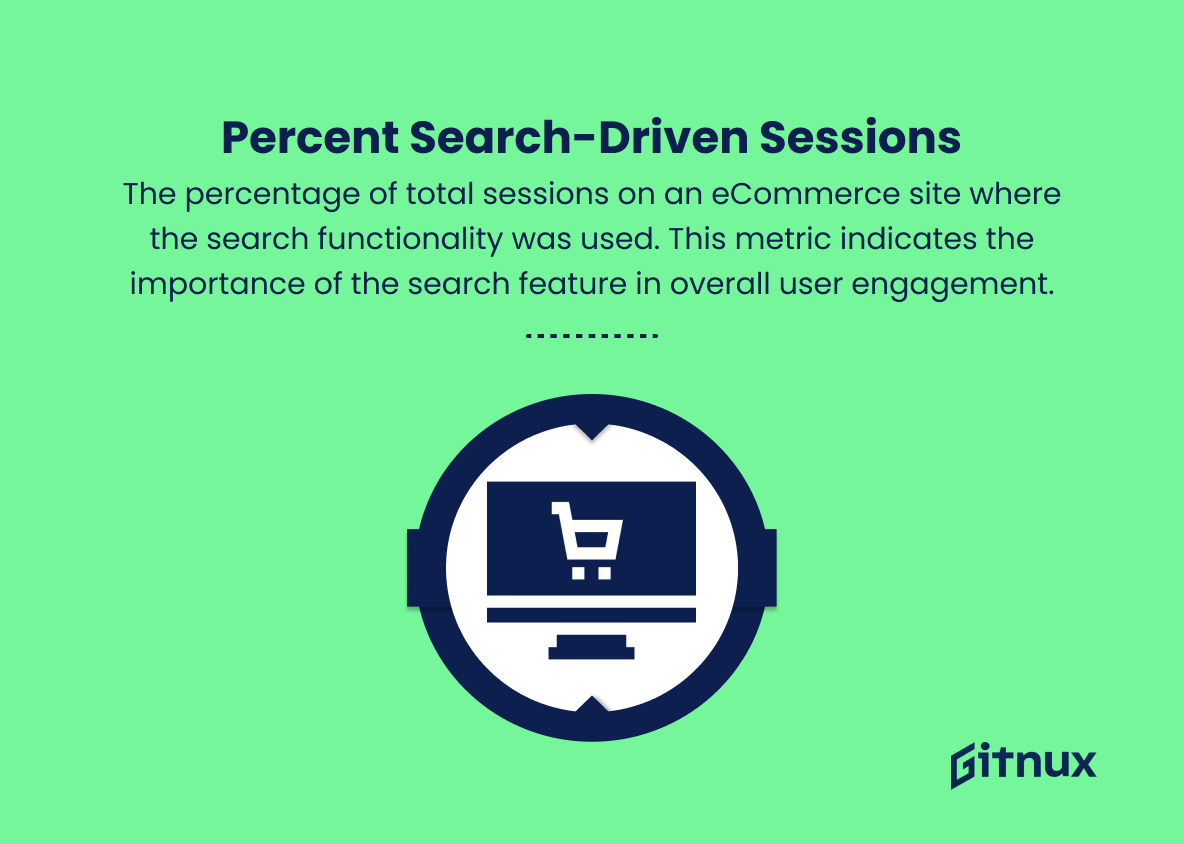
8. Percent Search-driven Sessions
The percentage of total sessions on an eCommerce site where the search functionality was used. This metric indicates the importance of the search feature in overall user engagement.
9. Search Depth
The average number of search results pages viewed by users per search session. This metric provides insights into user engagement with search results, and a high search depth may indicate that relevant results are not displayed on the first page.
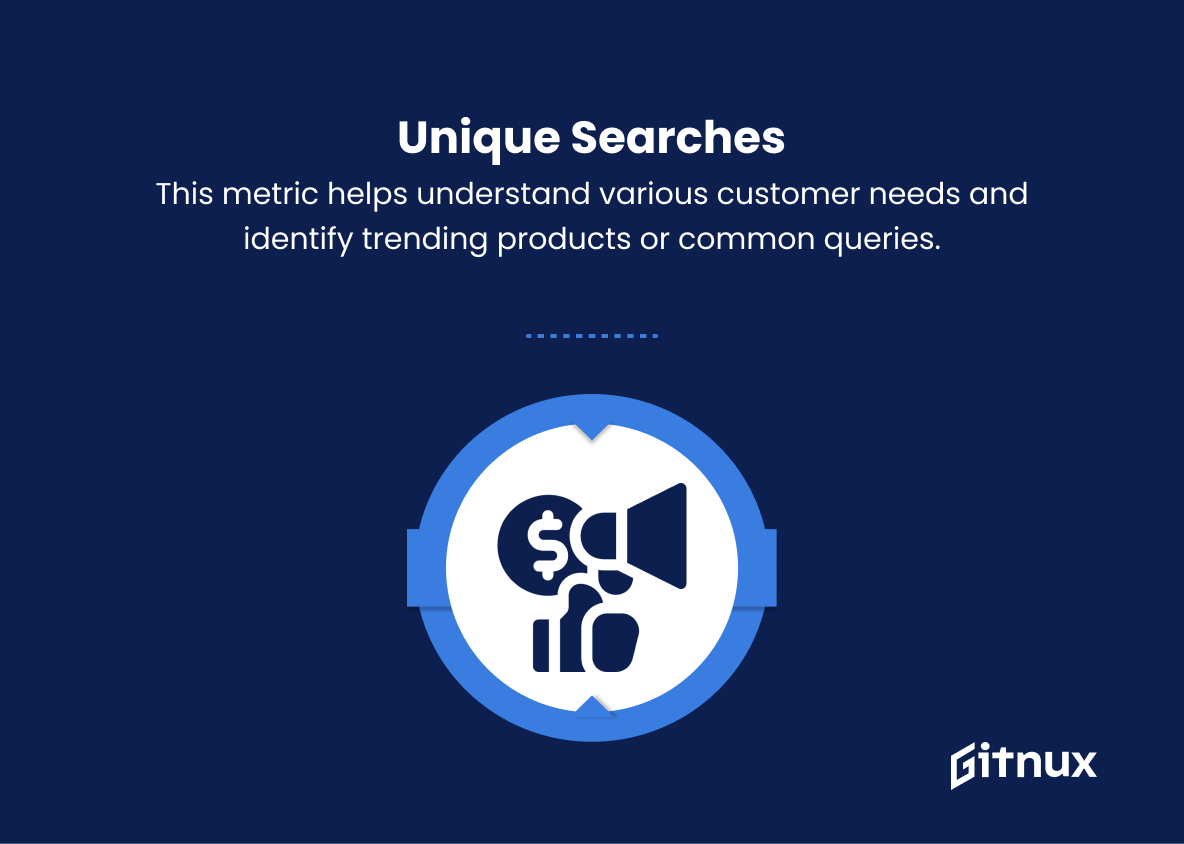
10. Unique Searches
The total number of unique search queries performed during a specific period. This metric helps understand various customer needs and identify trending products or common queries.
11. Top Search Queries
The most frequently searched terms on the eCommerce platform. Analyzing top search queries can provide insights into product demand and customer interests and inform marketing, merchandising, or content strategies.
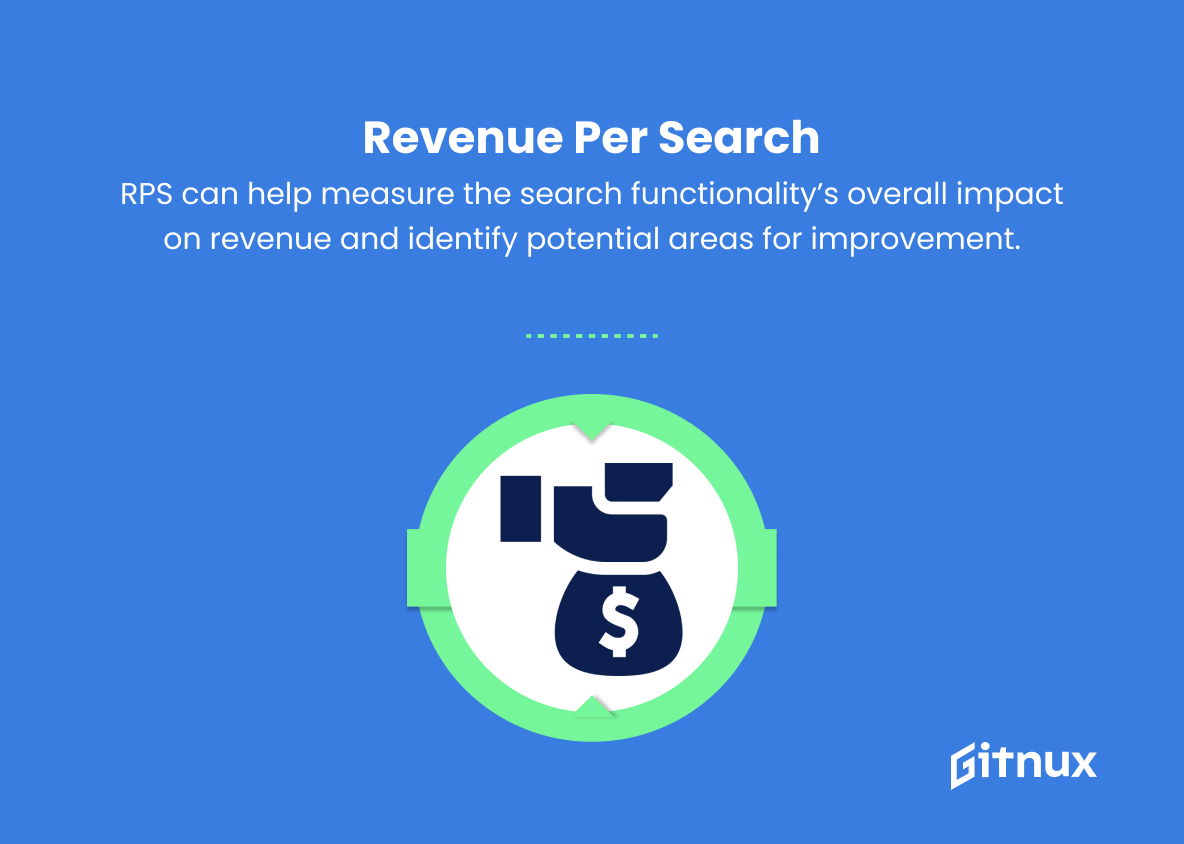
12. Revenue per Search (RPS)
The average revenue generated from each search performed on an eCommerce site. RPS can help measure the search functionality’s overall impact on revenue and identify potential areas for improvement.
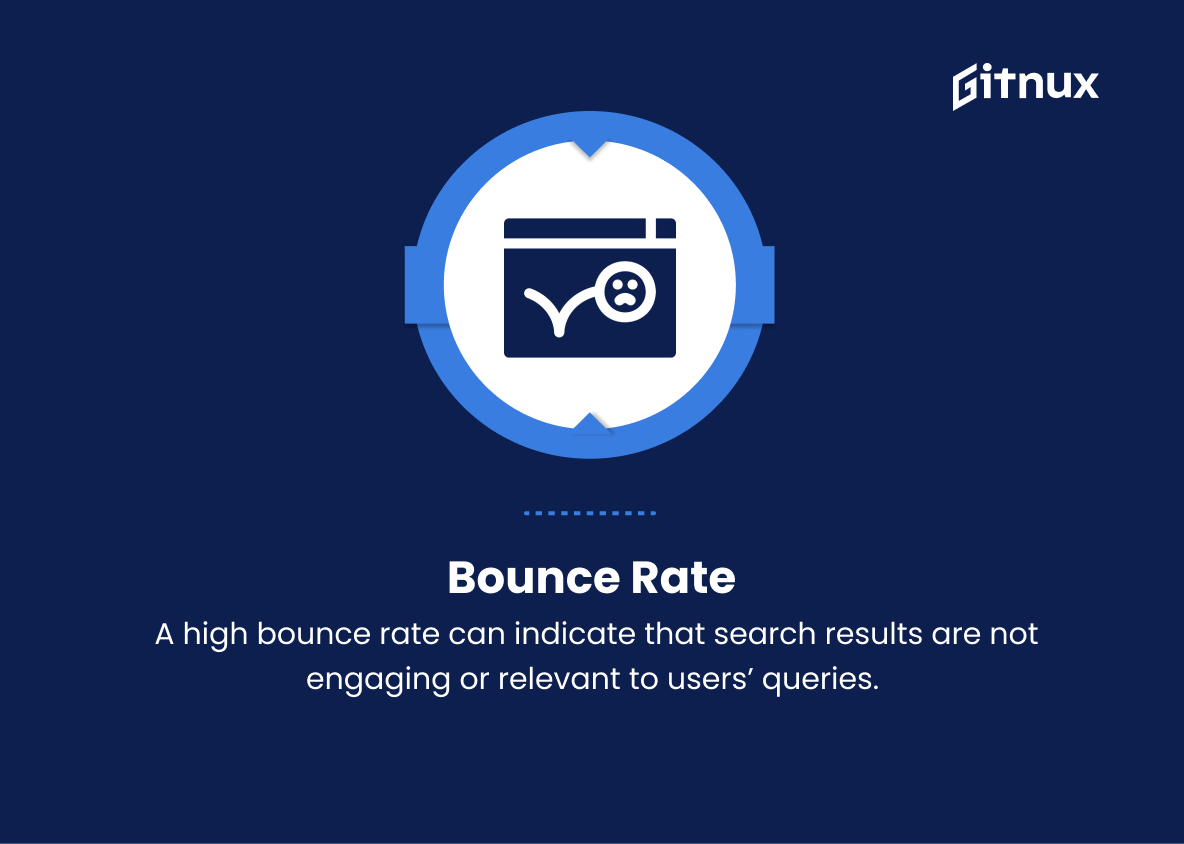
13. Bounce Rate
The percentage of users who leave the website after viewing only one page, such as search results. A high bounce rate can indicate that search results are not engaging or relevant to users’ queries.
Ecommerce Search Metrics Explained
Ecommerce search metrics are crucial for understanding user behavior on an online platform and optimizing the overall shopping experience. Conversion Rate shows the effectiveness of the search feature in driving sales, while Click-Through Rate (CTR) indicates the relevance of search results to users’ queries. Average Order Value (AOV) reflects the search feature’s impact on revenue generation, whereas Time to Purchase measures user-friendliness and site experience.
Zero Results Rate, Search Exit Rate, and Search Refinement Rate all highlight areas where search functionality may need improvement. Percent Search-driven Sessions and Search Depth demonstrate user engagement with the search feature, and Unique Searches, Top Search Queries, and Revenue per Search (RPS) help understand customer needs and search functionality’s overall impact on revenue. Finally, the Bounce Rate can be used as an indicator of the relevance and engagement of search results to users’ queries. Evaluating these metrics informs marketing and merchandising strategies while creating a more seamless and enjoyable user experience.
Conclusion
In summary, understanding and analyzing eCommerce search metrics is vital for success in the world of digital commerce. By closely monitoring these metrics, businesses can identify areas of improvement, optimize the overall user experience, and streamline their sales funnel. Furthermore, keeping an eye on search trends and adapting strategies accordingly can prove instrumental in gaining a competitive edge and nurturing customer loyalty.
As eCommerce continues to evolve, staying abreast of advancements in search metrics will only become more critical to achieve and maintain success. To truly thrive in this dynamic industry, remain vigilant, continuously explore new possibilities, and never underestimate the power of data-driven insights.
