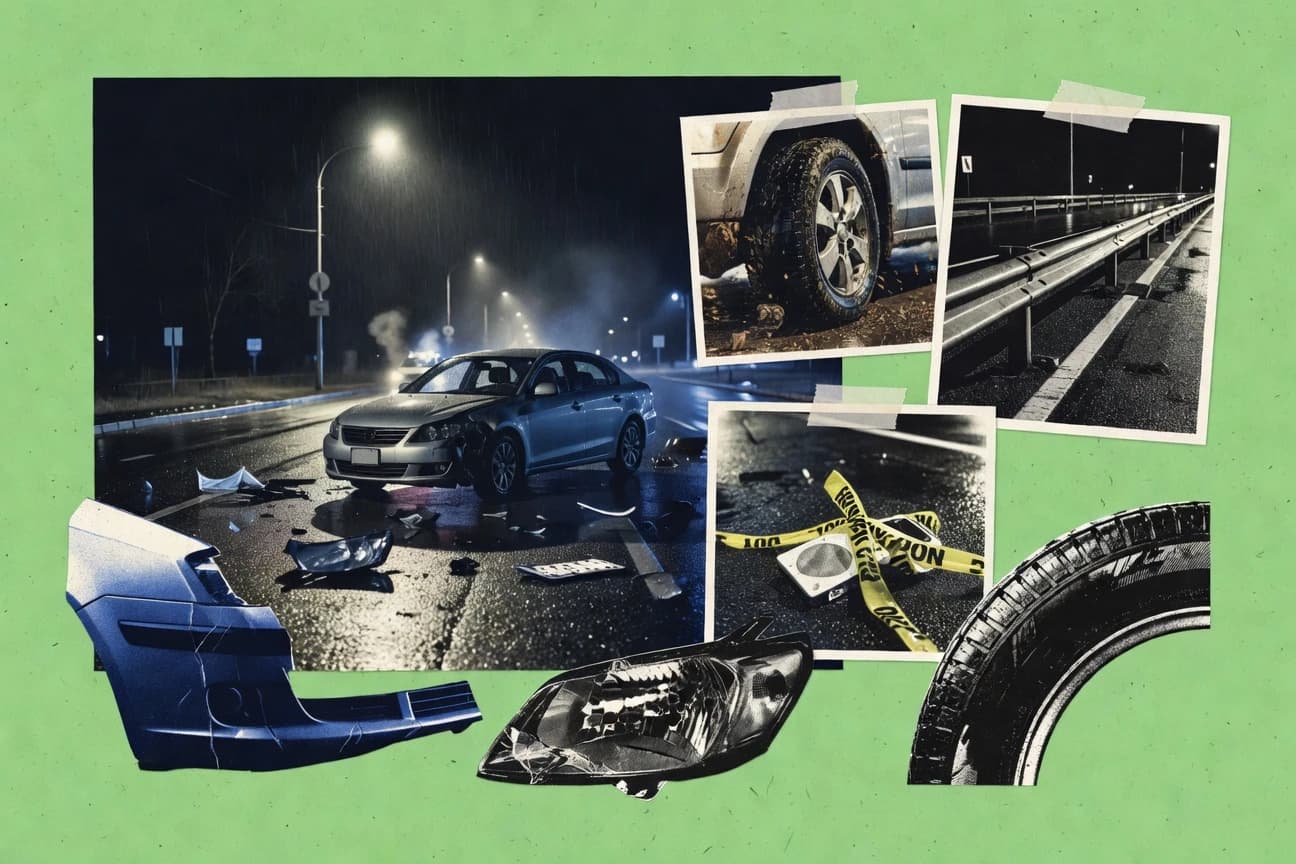
GITNUXREPORT 2026

Vehicle Accident Statistics

Despite a slight decline, road fatalities worldwide remain an urgent and devastating crisis.

How We Build This Report

01
Primary Source Collection

Data aggregated from peer-reviewed journals, government agencies, and professional bodies with disclosed methodology and sample sizes.

02
Editorial Curation

Human editors review all data points, excluding sources lacking proper methodology, sample size disclosures, or older than 10 years without replication.

03
AI-Powered Verification

Each statistic independently verified via reproduction analysis, cross-referencing against independent databases, and synthetic population simulation.

04
Human Cross-Check

Final human editorial review of all AI-verified statistics. Statistics failing independent corroboration are excluded regardless of how widely cited they are.

Statistics that could not be independently verified are excluded regardless of how widely cited they are elsewhere.

Our process →

Key Statistics

Statistic 1

Distracted driving caused 3,308 deaths and 289,310 injuries in US 2022

Statistic 2

Speeding was involved in 29% of US fatal crashes in 2022, totaling 12,151 deaths

Statistic 3

Alcohol-impaired driving accounted for 31% of US traffic fatalities in 2022 (13,524 deaths)

Statistic 4

Drowsy driving leads to ~91 fatalities daily worldwide

Statistic 5

In EU, 25% of road deaths due to speeding in 2022

Statistic 6

Red-light running causes 939 US deaths yearly average 2017-2021

Statistic 7

Wrong-way driving crashes kill 355 people annually in US

Statistic 8

In Australia, 30% of fatal crashes involve alcohol or drugs

Statistic 9

Failure to yield caused 12% of US intersection crashes in 2021

Statistic 10

Globally, 20% of fatal crashes involve heavy vehicles

Statistic 11

In UK, driver error or mistake in 88% of reported accidents 2022

Statistic 12

Weather-related crashes: 21% of US vehicle miles traveled affected, 543,000 crashes yearly

Statistic 13

Cellphone use distraction in 8% of fatal US crashes 2022

Statistic 14

In India, 45% of accidents due to overspeeding in 2021

Statistic 15

Roadway departure crashes: 53% of US fatalities 2022 (22,692 deaths)

Statistic 16

In Canada, 30% of fatal collisions involve impairment

Statistic 17

Bicycle-motor vehicle crashes: 75% due to driver failure to yield

Statistic 18

In South Africa, 35% of crashes due to speeding

Statistic 19

Rear-end crashes comprise 29% of all US police-reported crashes

Statistic 20

Japan: 40% of accidents from careless driving in 2022

Statistic 21

Animal-vehicle collisions: 1.33 million yearly in US

Statistic 22

In Brazil, 33% of fatal accidents due to speeding

Statistic 23

Intersection-related crashes: 40% of US crash deaths

Statistic 24

Fatigue-related crashes: 13-20% in commercial vehicles

Statistic 25

In Germany, 33% of accidents caused by violation of right-of-way

Statistic 26

Rollover crashes: 33% of passenger vehicle occupant deaths in US SUVs

Statistic 27

In France, 18% of fatal accidents due to alcohol

Statistic 28

Lane departure: primary factor in 29% of fatal crashes US

Statistic 29

In 2022, 62% of US traffic fatalities were male drivers aged 16-34

Statistic 30

Males comprise 71% of all US driver fatalities in 2022

Statistic 31

Drivers aged 16-20 had a fatal crash rate of 7.6 per 100 million miles in 2021

Statistic 32

Globally, 73% of road deaths among males aged 5-29 years

Statistic 33

In US, 18% of traffic deaths were occupants of large trucks, mostly male

Statistic 34

Elderly drivers (75+) had 1.95 fatality rate per 100 million miles in 2021

Statistic 35

African Americans represent 13% of US population but 25% of pedestrian deaths

Statistic 36

In EU, 21% of road deaths are young males 18-24 years old

Statistic 37

US teen drivers (16-19): 8% of all drivers but 12% of fatalities

Statistic 38

Rural areas account for 53% of US traffic deaths despite 19% population

Statistic 39

In Australia, males 17-25 years old highest risk group for fatal crashes

Statistic 40

Hispanic drivers in US: fatality rate 10.9 per 100k, higher than whites

Statistic 41

Children 12 and under: 618 US deaths in 2022

Statistic 42

In UK, 25% of car driver deaths are under 30 years

Statistic 43

Females represent 28% of US driver fatalities but lower mileage

Statistic 44

In Canada, Indigenous people 5% population but 12% fatalities

Statistic 45

Motorcyclists: 92% male in US fatal crashes 2022

Statistic 46

Urban areas: higher pedestrian deaths, 58% of US total in 2022

Statistic 47

In India, 45% of fatalities are two-wheeler riders, mostly young males

Statistic 48

US drivers 85+: 2nd highest crash death rate after 16-19

Statistic 49

Low-income countries: 92% of deaths but 60% vehicles

Statistic 50

In South Africa, 60% fatalities male, peak 20-29 years

Statistic 51

Occupational drivers: 25% of US road deaths

Statistic 52

In Japan, elderly (65+) 25% of fatalities despite 29% population

Statistic 53

Pedestrians 65+: 21% of pedestrian deaths in US

Statistic 54

In Brazil, 50% road deaths young adults 18-34

Statistic 55

US night-time driving: 55% of fatalities occur 6pm-6am

Statistic 56

Females in LMICs: higher pedestrian vulnerability

Statistic 57

In Germany, foreign nationals 12% population, 20% fatalities

Statistic 58

Children under 15: 7% global road deaths, mostly pedestrians

Statistic 59

US commercial truck drivers: 7% of road user deaths

Statistic 60

The total economic cost of US motor vehicle crashes in 2019 was $340 billion, including medical and productivity losses

Statistic 61

Globally, road crashes cost 3% of GDP annually, $1.7 trillion in 2021

Statistic 62

US crash-related medical costs: $37.5 billion in 2019

Statistic 63

Lifetime economic costs of fatal crashes: $242 billion yearly in US

Statistic 64

EU road accidents cost €130 billion in 2021, 1% of GDP

Statistic 65

Australia: $45 billion annual cost from road trauma in 2022

Statistic 66

India: road accidents cost 3% GDP, ₹10.8 lakh crore in 2021

Statistic 67

US property damage from crashes: $88 billion in 2019

Statistic 68

UK: £36 billion annual cost of road collisions in 2022

Statistic 69

Workplace lost time from crashes: $69 billion in US 2019

Statistic 70

Canada: $28 billion societal cost of collisions in 2022

Statistic 71

Brazil: R$100 billion annual economic loss from traffic accidents

Statistic 72

Insurance payouts for US auto crashes: $160 billion yearly

Statistic 73

Global truck crash costs: $512 billion annually

Statistic 74

In California, crash costs exceed $50 billion yearly

Statistic 75

Productivity losses from fatal crashes: $184 billion in US 2019

Statistic 76

South Africa: R160 billion annual road crash economic cost

Statistic 77

France: €46 billion cost of road insecurity in 2022

Statistic 78

US pedestrian crash costs: $15 billion medical annually

Statistic 79

Japan: ¥8.2 trillion economic loss from traffic accidents 2022

Statistic 80

Emergency medical services for crashes: $19 billion US yearly

Statistic 81

In Texas, crash economic burden $90 billion annually

Statistic 82

China: road safety costs 2% GDP, trillions yuan yearly

Statistic 83

Rehabilitation costs for serious injuries: $22 billion US

Statistic 84

UK human capital approach: £20 billion from fatalities alone

Statistic 85

Motorcycle crash costs higher per crash: $3.5 million fatal US

Statistic 86

Germany: €27 billion material damage from accidents 2022

Statistic 87

Congestion from crashes: $50 billion US yearly delay costs

Statistic 88

In Mexico, accidents cost 1.5% GDP, $20 billion USD

Statistic 89

Legal and court costs for crashes: $6 billion US annually

Statistic 90

Italy: €30 billion social cost of road accidents 2022

Statistic 91

Pain and suffering valuation: $100+ billion in US crash costs

Statistic 92

In 2022, the United States recorded 42,795 motor vehicle crash fatalities, marking a slight 0.3% decrease from 42,939 in 2021

Statistic 93

Globally, road traffic crashes killed approximately 1.19 million people in 2023, with 90% occurring in low- and middle-income countries

Statistic 94

In the EU, 19,976 people died in road accidents in 2022, a 3% reduction from 2021

Statistic 95

Australia saw 1,194 road fatalities in 2022, with a rate of 4.5 deaths per 100,000 population

Statistic 96

In 2021, India reported over 153,972 road accident deaths, accounting for 11% of global road fatalities

Statistic 97

US pedestrian fatalities reached 7,522 in 2022, up 1% from 2021 and 77% since 2013

Statistic 98

Motorcycle rider deaths in the US totaled 5,579 in 2022, representing 13% of all traffic fatalities

Statistic 99

In 2023 preliminary data, California had the highest number of traffic fatalities at 4,017

Statistic 100

Brazil recorded 31,635 road deaths in 2021, with a rate of 15 per 100,000 inhabitants

Statistic 101

UK road deaths fell to 1,558 in 2022, the lowest since records began in 1921

Statistic 102

In 2022, 13,524 people died in alcohol-impaired driving crashes in the US, 31% of all traffic deaths

Statistic 103

China had an estimated 260,000 road traffic deaths in 2021

Statistic 104

Japan reported 2,604 traffic accident deaths in 2022, down 9.4% from previous year

Statistic 105

South Africa recorded 12,921 road fatalities in 2022, a rate of 21.1 per 100,000 population

Statistic 106

In 2022, Texas had 4,481 traffic fatalities, highest among US states

Statistic 107

Globally, 20-50 million non-fatal injuries occur annually from road crashes

Statistic 108

Canada reported 1,931 road deaths in 2022, down 2% from 2021

Statistic 109

In 2021, Nigeria had about 40,000 road accident deaths

Statistic 110

Germany saw 2,788 road fatalities in 2022

Statistic 111

In 2022, Florida recorded 3,563 traffic deaths

Statistic 112

Worldwide, males account for 77% of all road traffic deaths

Statistic 113

New Zealand had 347 road deaths in 2022, rate of 6.6 per 100,000

Statistic 114

In 2023 Q1-Q3, US fatalities totaled 29,138

Statistic 115

Mexico reported 16,000 road deaths in 2022

Statistic 116

In 2022, over 6,000 cyclists died on US roads

Statistic 117

France had 3,546 road deaths in 2022, down 4.6%

Statistic 118

In 2021, Pakistan estimated 27,000 road fatalities

Statistic 119

US large truck crash deaths: 5,788 in 2021

Statistic 120

Italy recorded 3,039 road fatalities in 2022

Statistic 121

In 2022, Georgia (US state) had 1,765 traffic deaths

Statistic 122

The US had 12.9 traffic deaths per 100,000 population in 2022

Statistic 123

In 2022, approximately 5 million people were injured in US motor vehicle crashes

Statistic 124

Globally, road crashes cause 20-50 million non-fatal injuries yearly, many resulting in disability

Statistic 125

EU reported 110,937 serious injuries from road accidents in 2022

Statistic 126

Australia had 35,000 serious injuries in road crashes in 2022

Statistic 127

In 2021, India saw 451,361 non-fatal road injuries

Statistic 128

US saw 2.4 million emergency department visits for motor vehicle crash injuries in 2021

Statistic 129

UK reported 130,841 road casualties in 2022, including 78,710 slight injuries

Statistic 130

In 2022, 419,000 people suffered police-reported injuries in US crashes

Statistic 131

Canada had 117,876 injury collisions in 2022

Statistic 132

Brazil reported 156,000 hospitalized road injury victims in 2021

Statistic 133

In 2022, California recorded over 250,000 injury crashes

Statistic 134

Globally, 90% of road injury morbidity occurs in low/middle-income countries

Statistic 135

US seatbelt non-use led to 13,384 deaths and ~300,000 injuries in 2021

Statistic 136

Japan had 358,000 traffic accident injuries in 2022

Statistic 137

South Africa reported 147,000 road injuries in 2022

Statistic 138

In 2022, Texas had 155,000 injury crashes

Statistic 139

Pedestrian injuries in US: 60,000 seriously injured in 2021

Statistic 140

France reported 69,446 injury accidents in 2022

Statistic 141

In 2021, Nigeria estimated 200,000 road injuries

Statistic 142

Germany had 365,000 injured road users in 2022

Statistic 143

Florida reported 215,000 injury crashes in 2022

Statistic 144

Motorcycle injuries in US: 89,000 in 2022

Statistic 145

New Zealand had 17,000 injury crashes in 2022

Statistic 146

China reported millions of road injuries annually, with 200,000+ severe cases in 2021

Statistic 147

In 2022, over 400,000 US children were injured in vehicle crashes

Statistic 148

Mexico had 400,000 road injuries in 2022

Statistic 149

Italy reported 170,000 injured in road accidents 2022

Statistic 150

US large truck occupant injuries: 112,000 in 2021

Trusted by 500+ publications
Harvard Business ReviewThe GuardianFortune+497
In a single year, our roads worldwide become a scene of staggering loss, claiming over a million lives and inflicting financial costs in the trillions, yet the hidden epidemic of millions more suffering serious, life-altering injuries reveals the true, devastating breadth of the global traffic safety crisis.

Key Takeaways

  • In 2022, the United States recorded 42,795 motor vehicle crash fatalities, marking a slight 0.3% decrease from 42,939 in 2021
  • Globally, road traffic crashes killed approximately 1.19 million people in 2023, with 90% occurring in low- and middle-income countries
  • In the EU, 19,976 people died in road accidents in 2022, a 3% reduction from 2021
  • In 2022, approximately 5 million people were injured in US motor vehicle crashes
  • Globally, road crashes cause 20-50 million non-fatal injuries yearly, many resulting in disability
  • EU reported 110,937 serious injuries from road accidents in 2022
  • Distracted driving caused 3,308 deaths and 289,310 injuries in US 2022
  • Speeding was involved in 29% of US fatal crashes in 2022, totaling 12,151 deaths
  • Alcohol-impaired driving accounted for 31% of US traffic fatalities in 2022 (13,524 deaths)
  • In 2022, 62% of US traffic fatalities were male drivers aged 16-34
  • Males comprise 71% of all US driver fatalities in 2022
  • Drivers aged 16-20 had a fatal crash rate of 7.6 per 100 million miles in 2021
  • The total economic cost of US motor vehicle crashes in 2019 was $340 billion, including medical and productivity losses
  • Globally, road crashes cost 3% of GDP annually, $1.7 trillion in 2021
  • US crash-related medical costs: $37.5 billion in 2019

Despite a slight decline, road fatalities worldwide remain an urgent and devastating crisis.

Causes

1Distracted driving caused 3,308 deaths and 289,310 injuries in US 2022
Verified
2Speeding was involved in 29% of US fatal crashes in 2022, totaling 12,151 deaths
Verified
3Alcohol-impaired driving accounted for 31% of US traffic fatalities in 2022 (13,524 deaths)
Verified
4Drowsy driving leads to ~91 fatalities daily worldwide
Directional
5In EU, 25% of road deaths due to speeding in 2022
Single source
6Red-light running causes 939 US deaths yearly average 2017-2021
Verified
7Wrong-way driving crashes kill 355 people annually in US
Verified
8In Australia, 30% of fatal crashes involve alcohol or drugs
Verified
9Failure to yield caused 12% of US intersection crashes in 2021
Directional
10Globally, 20% of fatal crashes involve heavy vehicles
Single source
11In UK, driver error or mistake in 88% of reported accidents 2022
Verified
12Weather-related crashes: 21% of US vehicle miles traveled affected, 543,000 crashes yearly
Verified
13Cellphone use distraction in 8% of fatal US crashes 2022
Verified
14In India, 45% of accidents due to overspeeding in 2021
Directional
15Roadway departure crashes: 53% of US fatalities 2022 (22,692 deaths)
Single source
16In Canada, 30% of fatal collisions involve impairment
Verified
17Bicycle-motor vehicle crashes: 75% due to driver failure to yield
Verified
18In South Africa, 35% of crashes due to speeding
Verified
19Rear-end crashes comprise 29% of all US police-reported crashes
Directional
20Japan: 40% of accidents from careless driving in 2022
Single source
21Animal-vehicle collisions: 1.33 million yearly in US
Verified
22In Brazil, 33% of fatal accidents due to speeding
Verified
23Intersection-related crashes: 40% of US crash deaths
Verified
24Fatigue-related crashes: 13-20% in commercial vehicles
Directional
25In Germany, 33% of accidents caused by violation of right-of-way
Single source
26Rollover crashes: 33% of passenger vehicle occupant deaths in US SUVs
Verified
27In France, 18% of fatal accidents due to alcohol
Verified
28Lane departure: primary factor in 29% of fatal crashes US
Verified

Causes Interpretation

Behind each of these grim statistics lies a preventable human choice, proving that the most dangerous part of any vehicle will always be the person behind the wheel.

Demographics

1In 2022, 62% of US traffic fatalities were male drivers aged 16-34
Verified
2Males comprise 71% of all US driver fatalities in 2022
Verified
3Drivers aged 16-20 had a fatal crash rate of 7.6 per 100 million miles in 2021
Verified
4Globally, 73% of road deaths among males aged 5-29 years
Directional
5In US, 18% of traffic deaths were occupants of large trucks, mostly male
Single source
6Elderly drivers (75+) had 1.95 fatality rate per 100 million miles in 2021
Verified
7African Americans represent 13% of US population but 25% of pedestrian deaths
Verified
8In EU, 21% of road deaths are young males 18-24 years old
Verified
9US teen drivers (16-19): 8% of all drivers but 12% of fatalities
Directional
10Rural areas account for 53% of US traffic deaths despite 19% population
Single source
11In Australia, males 17-25 years old highest risk group for fatal crashes
Verified
12Hispanic drivers in US: fatality rate 10.9 per 100k, higher than whites
Verified
13Children 12 and under: 618 US deaths in 2022
Verified
14In UK, 25% of car driver deaths are under 30 years
Directional
15Females represent 28% of US driver fatalities but lower mileage
Single source
16In Canada, Indigenous people 5% population but 12% fatalities
Verified
17Motorcyclists: 92% male in US fatal crashes 2022
Verified
18Urban areas: higher pedestrian deaths, 58% of US total in 2022
Verified
19In India, 45% of fatalities are two-wheeler riders, mostly young males
Directional
20US drivers 85+: 2nd highest crash death rate after 16-19
Single source
21Low-income countries: 92% of deaths but 60% vehicles
Verified
22In South Africa, 60% fatalities male, peak 20-29 years
Verified
23Occupational drivers: 25% of US road deaths
Verified
24In Japan, elderly (65+) 25% of fatalities despite 29% population
Directional
25Pedestrians 65+: 21% of pedestrian deaths in US
Single source
26In Brazil, 50% road deaths young adults 18-34
Verified
27US night-time driving: 55% of fatalities occur 6pm-6am
Verified
28Females in LMICs: higher pedestrian vulnerability
Verified
29In Germany, foreign nationals 12% population, 20% fatalities
Directional
30Children under 15: 7% global road deaths, mostly pedestrians
Single source
31US commercial truck drivers: 7% of road user deaths
Verified

Demographics Interpretation

The data paints a grim portrait of a predictable, global tragedy: young men, fueled by a perilous cocktail of inexperience and invincibility, are crashing their way to an early grave at disproportionate rates, while the roads remain a deadly inequity mirroring societal divides in age, race, income, and geography.

Economic Impact

1The total economic cost of US motor vehicle crashes in 2019 was $340 billion, including medical and productivity losses
Verified
2Globally, road crashes cost 3% of GDP annually, $1.7 trillion in 2021
Verified
3US crash-related medical costs: $37.5 billion in 2019
Verified
4Lifetime economic costs of fatal crashes: $242 billion yearly in US
Directional
5EU road accidents cost €130 billion in 2021, 1% of GDP
Single source
6Australia: $45 billion annual cost from road trauma in 2022
Verified
7India: road accidents cost 3% GDP, ₹10.8 lakh crore in 2021
Verified
8US property damage from crashes: $88 billion in 2019
Verified
9UK: £36 billion annual cost of road collisions in 2022
Directional
10Workplace lost time from crashes: $69 billion in US 2019
Single source
11Canada: $28 billion societal cost of collisions in 2022
Verified
12Brazil: R$100 billion annual economic loss from traffic accidents
Verified
13Insurance payouts for US auto crashes: $160 billion yearly
Verified
14Global truck crash costs: $512 billion annually
Directional
15In California, crash costs exceed $50 billion yearly
Single source
16Productivity losses from fatal crashes: $184 billion in US 2019
Verified
17South Africa: R160 billion annual road crash economic cost
Verified
18France: €46 billion cost of road insecurity in 2022
Verified
19US pedestrian crash costs: $15 billion medical annually
Directional
20Japan: ¥8.2 trillion economic loss from traffic accidents 2022
Single source
21Emergency medical services for crashes: $19 billion US yearly
Verified
22In Texas, crash economic burden $90 billion annually
Verified
23China: road safety costs 2% GDP, trillions yuan yearly
Verified
24Rehabilitation costs for serious injuries: $22 billion US
Directional
25UK human capital approach: £20 billion from fatalities alone
Single source
26Motorcycle crash costs higher per crash: $3.5 million fatal US
Verified
27Germany: €27 billion material damage from accidents 2022
Verified
28Congestion from crashes: $50 billion US yearly delay costs
Verified
29In Mexico, accidents cost 1.5% GDP, $20 billion USD
Directional
30Legal and court costs for crashes: $6 billion US annually
Single source
31Italy: €30 billion social cost of road accidents 2022
Verified
32Pain and suffering valuation: $100+ billion in US crash costs
Verified

Economic Impact Interpretation

While the world spins its wheels on economic progress, road crashes are the silent but staggeringly expensive pothole in the global budget, draining trillions that could otherwise be put to better use.

Fatalities

1In 2022, the United States recorded 42,795 motor vehicle crash fatalities, marking a slight 0.3% decrease from 42,939 in 2021
Verified
2Globally, road traffic crashes killed approximately 1.19 million people in 2023, with 90% occurring in low- and middle-income countries
Verified
3In the EU, 19,976 people died in road accidents in 2022, a 3% reduction from 2021
Verified
4Australia saw 1,194 road fatalities in 2022, with a rate of 4.5 deaths per 100,000 population
Directional
5In 2021, India reported over 153,972 road accident deaths, accounting for 11% of global road fatalities
Single source
6US pedestrian fatalities reached 7,522 in 2022, up 1% from 2021 and 77% since 2013
Verified
7Motorcycle rider deaths in the US totaled 5,579 in 2022, representing 13% of all traffic fatalities
Verified
8In 2023 preliminary data, California had the highest number of traffic fatalities at 4,017
Verified
9Brazil recorded 31,635 road deaths in 2021, with a rate of 15 per 100,000 inhabitants
Directional
10UK road deaths fell to 1,558 in 2022, the lowest since records began in 1921
Single source
11In 2022, 13,524 people died in alcohol-impaired driving crashes in the US, 31% of all traffic deaths
Verified
12China had an estimated 260,000 road traffic deaths in 2021
Verified
13Japan reported 2,604 traffic accident deaths in 2022, down 9.4% from previous year
Verified
14South Africa recorded 12,921 road fatalities in 2022, a rate of 21.1 per 100,000 population
Directional
15In 2022, Texas had 4,481 traffic fatalities, highest among US states
Single source
16Globally, 20-50 million non-fatal injuries occur annually from road crashes
Verified
17Canada reported 1,931 road deaths in 2022, down 2% from 2021
Verified
18In 2021, Nigeria had about 40,000 road accident deaths
Verified
19Germany saw 2,788 road fatalities in 2022
Directional
20In 2022, Florida recorded 3,563 traffic deaths
Single source
21Worldwide, males account for 77% of all road traffic deaths
Verified
22New Zealand had 347 road deaths in 2022, rate of 6.6 per 100,000
Verified
23In 2023 Q1-Q3, US fatalities totaled 29,138
Verified
24Mexico reported 16,000 road deaths in 2022
Directional
25In 2022, over 6,000 cyclists died on US roads
Single source
26France had 3,546 road deaths in 2022, down 4.6%
Verified
27In 2021, Pakistan estimated 27,000 road fatalities
Verified
28US large truck crash deaths: 5,788 in 2021
Verified
29Italy recorded 3,039 road fatalities in 2022
Directional
30In 2022, Georgia (US state) had 1,765 traffic deaths
Single source
31The US had 12.9 traffic deaths per 100,000 population in 2022
Verified

Fatalities Interpretation

While the global dashboard of traffic statistics flashes a grim tally of over a million lives lost annually, our collective response seems stuck in neutral, as even the most celebrated national 'declines' often amount to saving mere dozens amid the ongoing catastrophe of thousands.

Injuries

1In 2022, approximately 5 million people were injured in US motor vehicle crashes
Verified
2Globally, road crashes cause 20-50 million non-fatal injuries yearly, many resulting in disability
Verified
3EU reported 110,937 serious injuries from road accidents in 2022
Verified
4Australia had 35,000 serious injuries in road crashes in 2022
Directional
5In 2021, India saw 451,361 non-fatal road injuries
Single source
6US saw 2.4 million emergency department visits for motor vehicle crash injuries in 2021
Verified
7UK reported 130,841 road casualties in 2022, including 78,710 slight injuries
Verified
8In 2022, 419,000 people suffered police-reported injuries in US crashes
Verified
9Canada had 117,876 injury collisions in 2022
Directional
10Brazil reported 156,000 hospitalized road injury victims in 2021
Single source
11In 2022, California recorded over 250,000 injury crashes
Verified
12Globally, 90% of road injury morbidity occurs in low/middle-income countries
Verified
13US seatbelt non-use led to 13,384 deaths and ~300,000 injuries in 2021
Verified
14Japan had 358,000 traffic accident injuries in 2022
Directional
15South Africa reported 147,000 road injuries in 2022
Single source
16In 2022, Texas had 155,000 injury crashes
Verified
17Pedestrian injuries in US: 60,000 seriously injured in 2021
Verified
18France reported 69,446 injury accidents in 2022
Verified
19In 2021, Nigeria estimated 200,000 road injuries
Directional
20Germany had 365,000 injured road users in 2022
Single source
21Florida reported 215,000 injury crashes in 2022
Verified
22Motorcycle injuries in US: 89,000 in 2022
Verified
23New Zealand had 17,000 injury crashes in 2022
Verified
24China reported millions of road injuries annually, with 200,000+ severe cases in 2021
Directional
25In 2022, over 400,000 US children were injured in vehicle crashes
Single source
26Mexico had 400,000 road injuries in 2022
Verified
27Italy reported 170,000 injured in road accidents 2022
Verified
28US large truck occupant injuries: 112,000 in 2021
Verified

Injuries Interpretation

The cold, relentless math of global traffic is a daily megadisaster that, with a simple click of a seatbelt, could be demoted to a minor tragedy.

Sources & References