GITNUX MARKETDATA
Browse Our Category
Sports Recreation
Latest update:


Womens Sports Statistics
WNBA awareness is at 98% in the US, yet the league is still bringing in millions of fresh fans, alongside a sharp reminder that what athletes face online can be brutal since women receive three times more negative appearance comments than men. This page connects the momentum behind women’s sports and Title IX’s impact with the real barriers holding players back, from pay equity and belonging to injury and underrepresentation in sports media.

Volleyball Injury Statistics
Competition injuries land at 4.9 per 1000 player hours while training sits lower at 71% of injuries occurring in sessions that are supposed to build resilience. Find out which patterns drive the highest risks such as ankle sprains at 28%, overuse making up 40% of cases, and prevention ideas that cut ankle injuries by 40% and knee injuries by 50%.

Male Vs Female Soccer Statistics
Compare the pay gap and spending power as top salaries jump from $500k in women’s soccer to $20 million in the men’s game, while prize money for the 2023 World Cups sits at $110 million for women versus $440 million for men. Then see how that money map connects to the pitch and the body, from injury rates like ACL recovery at 12 months for women versus 9 for men to match impact stats such as possession, shots on target, and xG side by side.

College Sports Injuries Statistics
College Sports Injuries puts the most common problems in sharp focus, from sprains and strains that make up 46% of all injuries to ankle sprains at 15% and concussions at 9.7% of NCAA football injuries. You will also see who is most at risk and why prevention works, including ACL rates that can run 1.5 to 2 times higher for female athletes and training and recovery factors that help cut re injury instead of just treating it.

Boxing Concussions Statistics
From jab to knockout, Boxing Concussions tracks the forces behind brain rotation and why rotational acceleration drives 80% of injuries while a typical knockdown transfers maximum kinetic energy in just 10 milliseconds. You will also see how “small” choices like glove weight and headgear can cut impact but sometimes raise rotational risk, plus recovery and detection benchmarks that help explain why concussions often go undiagnosed.

Mma Injuries Statistics
With a 23.6 injury rate per 100 fight participations, MMA injuries skew hard toward the face and fists, yet the most match ending moments often come from unexpected patterns like 15.9% of endings ending in strikes via TKO. This page breaks down the leading injury fingerprints, from 47.9% facial lacerations and cauliflower ear in 31% of veterans to when chronic pain takes over, so you can understand what actually breaks fighters and why.

Brett Favre Career Statistics
Track Brett Favre’s 302 regular season games and 297 straight starts including the postseason, a run that helped him stack three MVPs from 1995 to 1997 and still sit at 86.4 for his career passer rating. Then compare the raw durability behind 10,169 attempts and 71,838 yards with the surprising pressure points like his 336 career interceptions and a 6.0 percent sack rate as you move through his full NFL career totals.

Skateboard Injury Statistics
Males dominate skateboard injury ER patterns, yet the biggest red flag is the shift among groups you might overlook, from teens with the highest rates to adults over 25 whose share has doubled since 2010. With 2022 US NEISS estimating 142,000 skateboard injuries and helmet use tied to an 85% lower fatality risk, this page connects who gets hurt, what injuries are most common, and how prevention changes outcomes.

Nil Statistics
Freshest NIL figures show Shedeur Sanders atop the college athlete board at $4.7 million and track the ripple effect across sports, with women’s NIL spend jumping to $300 million annually and the overall market reaching $1.2 billion in collective funding by mid 2024. This page also spotlights the sharp baseball and basketball valuation swings, from Brock Wilken’s $1.2 million peak to Cooper Flagg leading men’s basketball at $5.1 million, making it a fast reality check on who actually converts attention into dollars.

Batting Statistics
See how Babe Ruth career OPS+ 206 stacks up against the sport’s single season ceiling with Barry Bonds 2002 OPS+ 231 and the wRC+ leaders that turn batting into a measurable advantage, then chase the supporting clues like Ruth’s wOBA .473 career and Cobb’s BABIP .387. It’s the same page built for arguments from every angle, speed and power and baserunning and all time WAR, where Bonds’ peak 2004 wOBA .539 and Ruth’s career WAR 182.6 sit beside the game changing gaps that separate good hitters from legends.

Raheem Sterling Statistics
Raheem Sterling’s record blends speed, substance, and trophy weight, from 5 Premier League titles and 183 career club goals to 82.4% Premier League pass accuracy and 102 PL assists across 405 appearances. Updated through October 2024, this page connects award milestones like PFA Young Player of the Year 2014 and England Player of the Year 2019 and 2020 with the finer stuff like 1,247 Premier League dribbles and 128.5 Premier League xG, so you can see how “electric” turn into numbers.

Gymnastics Injuries Statistics
Lower extremity injuries dominate gymnastics, with 43% of injuries in elite female gymnasts and ankle injuries alone making up 20% of all injuries in competitive settings. Find where the risk shifts next, from knee and wrist to concussions and rare upper body impacts, plus how incidence rates like 6.07 acute injuries per 1000 hours of exposure help explain who gets hurt and why.
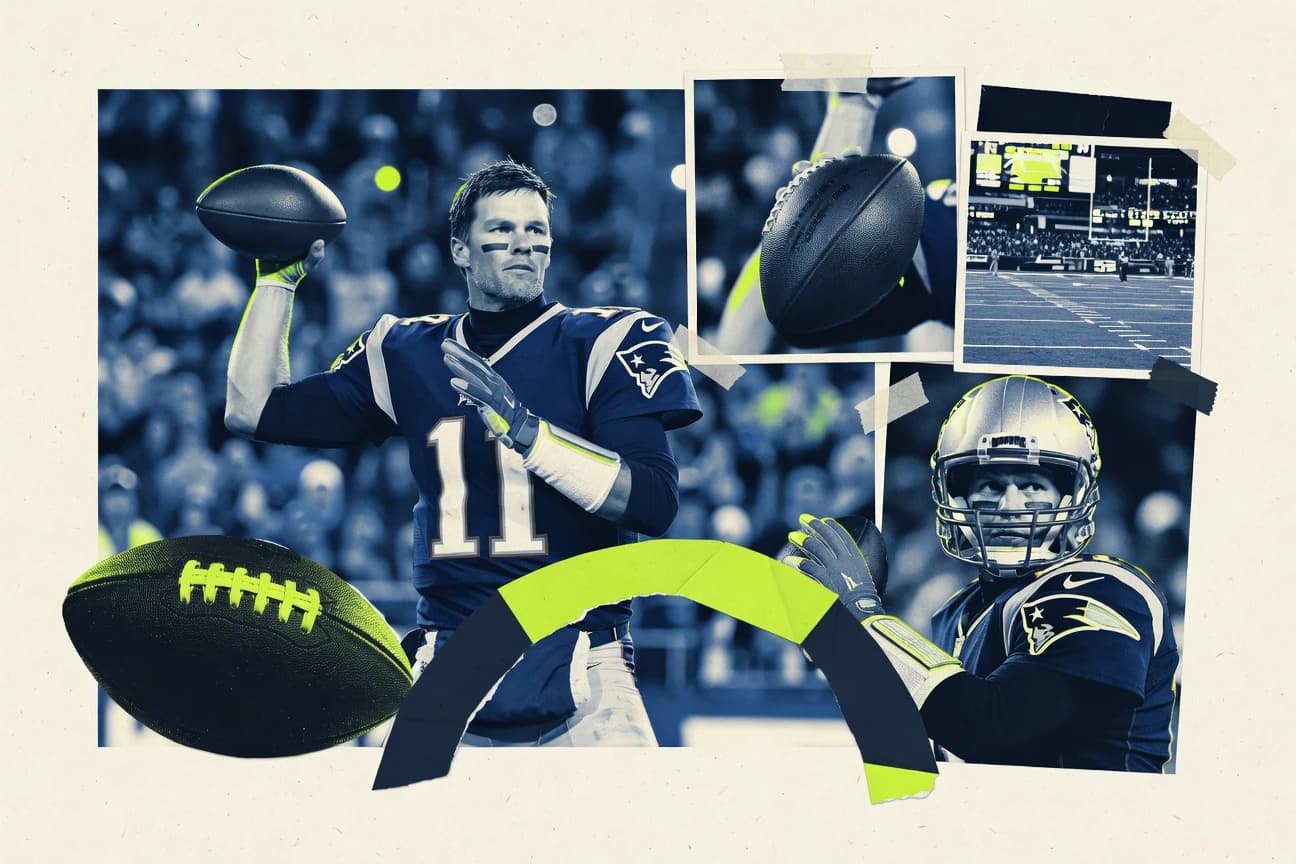
Tom Brady Statistics
Tom Brady’s record case is still widening, with 10 Super Bowl appearances and a career passing yardage record of 89,214 plus 649 touchdowns, backed by a 97.6 passer rating and 251 regular season wins. This page puts his Super Bowl MVP run, 3 NFL MVPs, and 5,000 yard seasons into one place so you can see how a quarterback with 58 fourth quarter comebacks and 66 game winning drives kept turning late-game pressure into history.
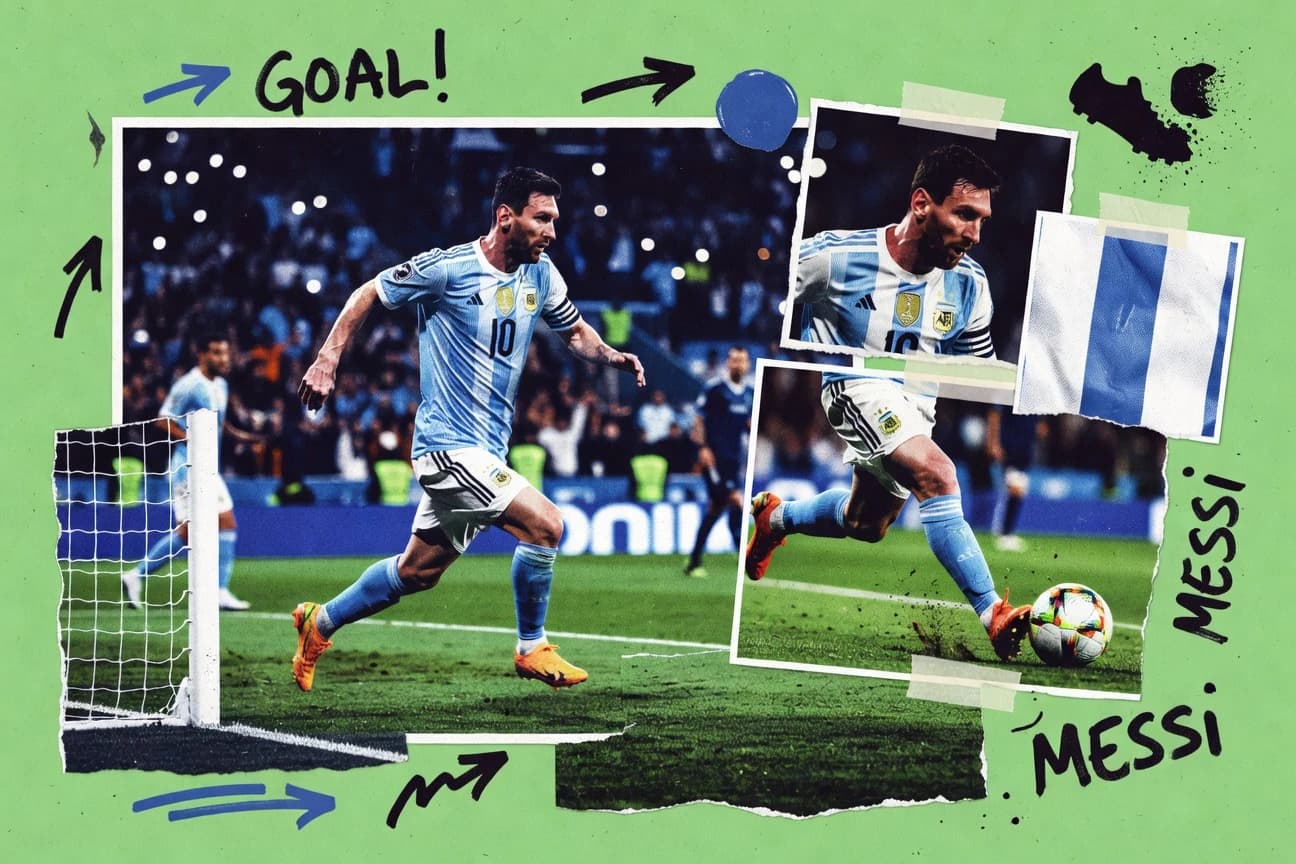
Lionel Messi Statistics
Lionel Messi’s record page collates the headline contrasts that define his career, from 672 Barcelona goals in 778 appearances and 303 assists to 129 Champions League goals with Barça and 20 goals plus 10 assists for Inter Miami in 2024 MLS up to now. It also stacks the rarer marks, including 91 goals in the 2012 calendar year, 268 El Clásico goals, and a career free kick tally that sits beyond 192 Barcelona competitive goals and 65 plus overall, so you can see why his influence keeps changing shape across leagues and trophies.

Boating Industry Statistics
New powerboat sales hit 258,000 units in 2023 while total U.S. boating participation topped 53 million Americans in 2022, showing demand that refuses to slow even as prices average $45,000 for new boats. From electric and smart-technology adoption to safety and injury patterns like a 5.3 fatality rate per 100,000 users, these Boating Industry statistics explain what is driving growth and what is still costing lives.

Baseball Injury Statistics
Baseball Injury lays out the figures behind why injury incidence sits at 4.2 per 1000 athlete exposures overall, and how everything changes by role, pitch habits, and biomechanics, from cleat traction over 1.05 increasing ACL risk 2.2 times to Pitch Smart compliance cutting youth elbow injuries by 18%. It also connects modern risk signals like sleep and workload to what teams can do now, including 2018 to 2022 strengthening programs reducing MLB oblique strains by 22% in 2021 trial groups and Pitch count limits under 75 per game lowering high school injuries by 26%.

Drag Race Statistics
RuPaul’s Drag Race dominates awards and culture with 28 total Emmy nominations as of 2024 and a historic Emmy streak for Outstanding Reality Competition from 2018 to 2022, plus 11 straight GLAAD wins from 2014 to 2024. Follow how record runs, viral moments, and even cast size quirks line up across US seasons and international spin offs, from Jinkx Monsoon’s TCA triumph to Season 16 finale hype that trended worldwide.

Roger Maris Statistics
Look past the 61-homer 1961 headline and you will see how Roger Maris quietly stacked AL supremacy with consecutive MVP seasons, 329 and 330 total bases, and a slugging surge that still feels ahead of its time. On one page, you get the full ledger from his 1957 rookie power to his Gold Glove right field years, plus the 1984 Yankees retirement of #9 that turned celebration into argument and never fully let go.

Football Concussions Statistics
From a 13.4% year over year jump to 214 diagnosed concussions in the 2022 NFL regular season to youth tackle rates that stay stubbornly high, this page pulls together the factors that most strongly shift risk, from position and age to prior concussion, BMI, migraine history, and access to safer play. You will see how the same sport can swing from far higher rates in pro football than rugby to measurable protection from equipment and rule changes, so readers can connect what happens on the field to what prevention can actually change.

Hockey Injuries Statistics
Concussions make up about 15 to 20% of NHL injuries from 2006 to 2022, yet goaltenders swing the injury spotlight hard, logging 12.5% of all injuries while skating only 4% of player ice time, with recovery averaging 14.2 days. This page connects rates across youth through elite leagues, where checking and stick contact can sharply shift outcomes, so you can see exactly which patterns are driving risk and which interventions are actually reducing it.