GITNUX MARKETDATA
Browse Our Category
Safety Accidents
Latest update:


Pitbull Facts And Statistics
Pit Bulls can face serious health flags like hip dysplasia at 15 to 20 percent higher incidence and cruciate ligament tears in 10 to 15 percent, yet proper diet and care can cut obesity risk by 40 percent and early spay or neuter before age 1 can reduce cancer risk by 50 percent. This Pitbull Facts And statistics page puts those contrasts side by side so you can understand what is common, what is preventable, and what surprises hide behind the breed’s reputation.

Automobile Accident Statistics
Car crashes are being edged back with systems that do more than warn drivers. From telematics portfolios cutting claim frequency by 6.4 percent and automatic emergency braking reducing rear end crashes by 38 percent to Vision Zero reporting a 12 percent road death drop across the EU from 2010 to 2020, this page connects prevention tech with the measurable human cost behind every statistic.

Construction Accident Statistics
Construction fatalities are disproportionately tied to worksite hazards where the worker is working at height and, as the latest stats show, 69% of construction deaths happen that way, even as construction accounts for a meaningful slice of serious days away from work injuries. You will also see how older equipment and missing basic safeguards can multiply risk and cost, with evidence that serious fall claims can carry a $40,000 median price tag in the US and that 2.0x higher accident rates were reported on sites using older equipment.

Warehouse Injury Statistics
See how recent 2022 patterns like 2.5 million sick days annually across EU warehousing and $2.5 billion in U.S. workers’ comp costs collide with who is getting hurt and why, from forklift crush fatalities to repetitive lifting MSDs. The page connects demographic risk and job conditions, including night shift injuries that run 40% higher than day shift, so you can spot the highest leverage fixes before a minor incident becomes a lost-time injury.

Holiday Accident Statistics
This Holiday Accident page pulls together the biggest surprises behind seasonal mishaps, from 1,200 holiday drownings to 10,000 fireworks-related emergency visits and an FAA near miss wave that left 45 aircraft involved during Thanksgiving 2023. You will see how the danger shifts by activity and setting, with aviation turbulence injuries and runway incursions sitting right beside rural drownings and weekend road crashes that spike when you least expect it.

Pool Drowning Statistics
Around 320,000 people die from drowning each year worldwide, yet most countries still lack complete drowning surveillance, so prevention can’t be targeted as precisely as it should. You will see why the best-supported fixes are not supervision alone but engineering layers such as four sided pool fencing and self latching gates, plus what the proximity to pools and the minutes to discovery reveal about how quickly small failures become life changing.

Motorcycle Death Statistics
With 2025 preliminary U.S. reporting already pointing to 6,335 motorcycle deaths, this page pinpoints what is still driving fatalities, from alcohol impairment in 42 percent of tested 2021 deaths and speeding at 34 percent to helmet use that can cut death risk by 42 percent in two-wheeler crashes and mandatory laws that have lifted compliance to 72 percent in Thailand. It also connects the less obvious threats, like intersection collisions, wet roads doubling crash severity, and nighttime risk taking a back seat only when safer gear and braking systems like ABS get real traction.
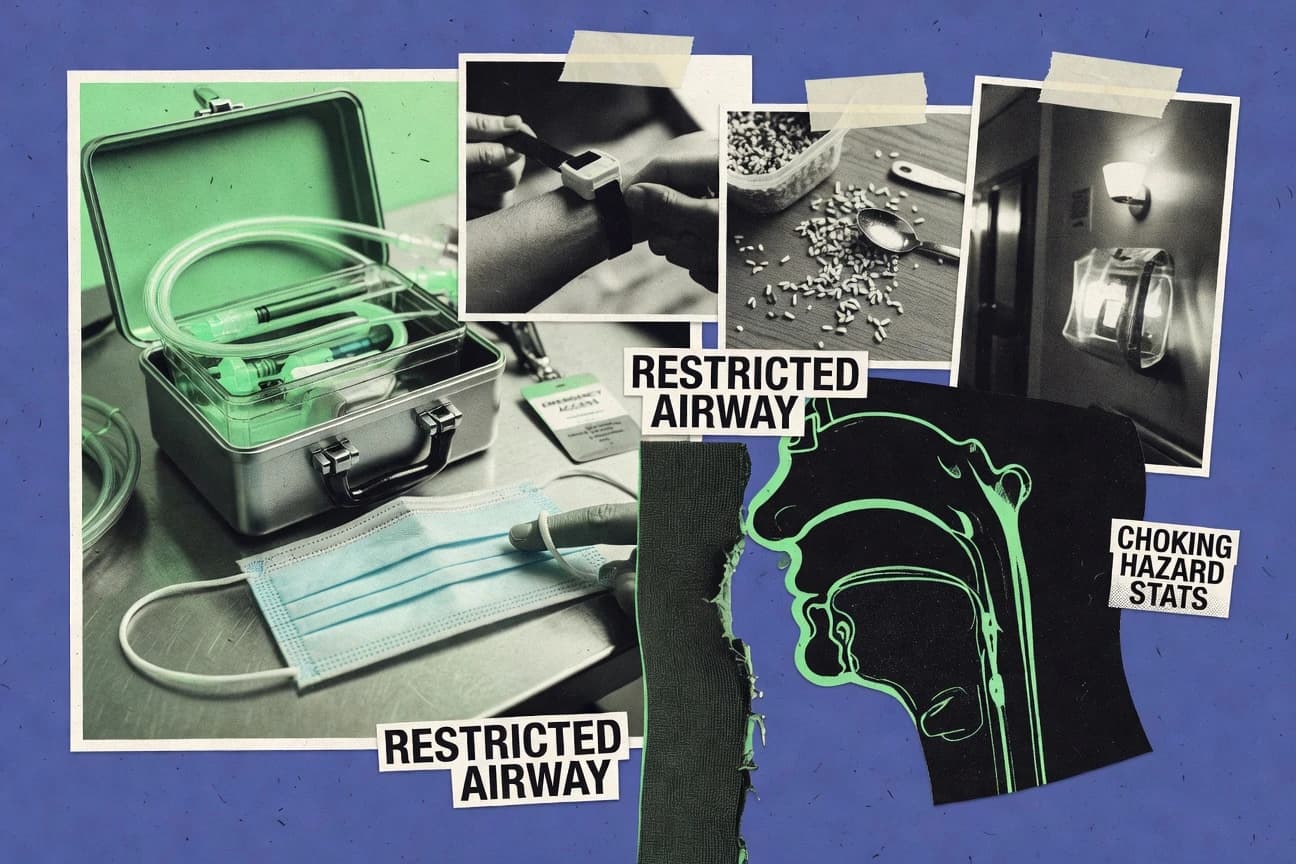
Choking Statistics
U.S. data suggests choking and foreign body events are heavily shaped by preventable choices and training gaps, with caregivers’ proper meal supervision rising from 41% to 68% after intervention while correct Heimlich technique jumped from 29% to 74% after training. The page also tracks how modern dysphagia care and screening add measurable protection, including a pooled 33% pneumonia risk reduction with thickened fluids compared with thin liquids.

Bench Press Death Statistics
There is no credible public incidence statistic for “bench press death” because major mortality systems like the US CDC NVSS code causes using ICD-10 mechanisms rather than sport specific labels, so any number would require inaccessible datasets rather than verifiable reporting. What is knowable is the broader reality behind the risk context, including about 250,000 sudden cardiac arrest deaths each year in the US and a survival to discharge around 10%, which makes the gap between what people fear and what systems can actually measure worth your attention.

Helicopter Safety Statistics
Recent helicopter safety statistics show a shift in what drives accidents, with 2026 figures pointing to the risk areas most crews can address right now. If you think safety is only about equipment, these numbers will challenge that assumption by spotlighting the operational details that keep fatalities and serious incidents from happening.
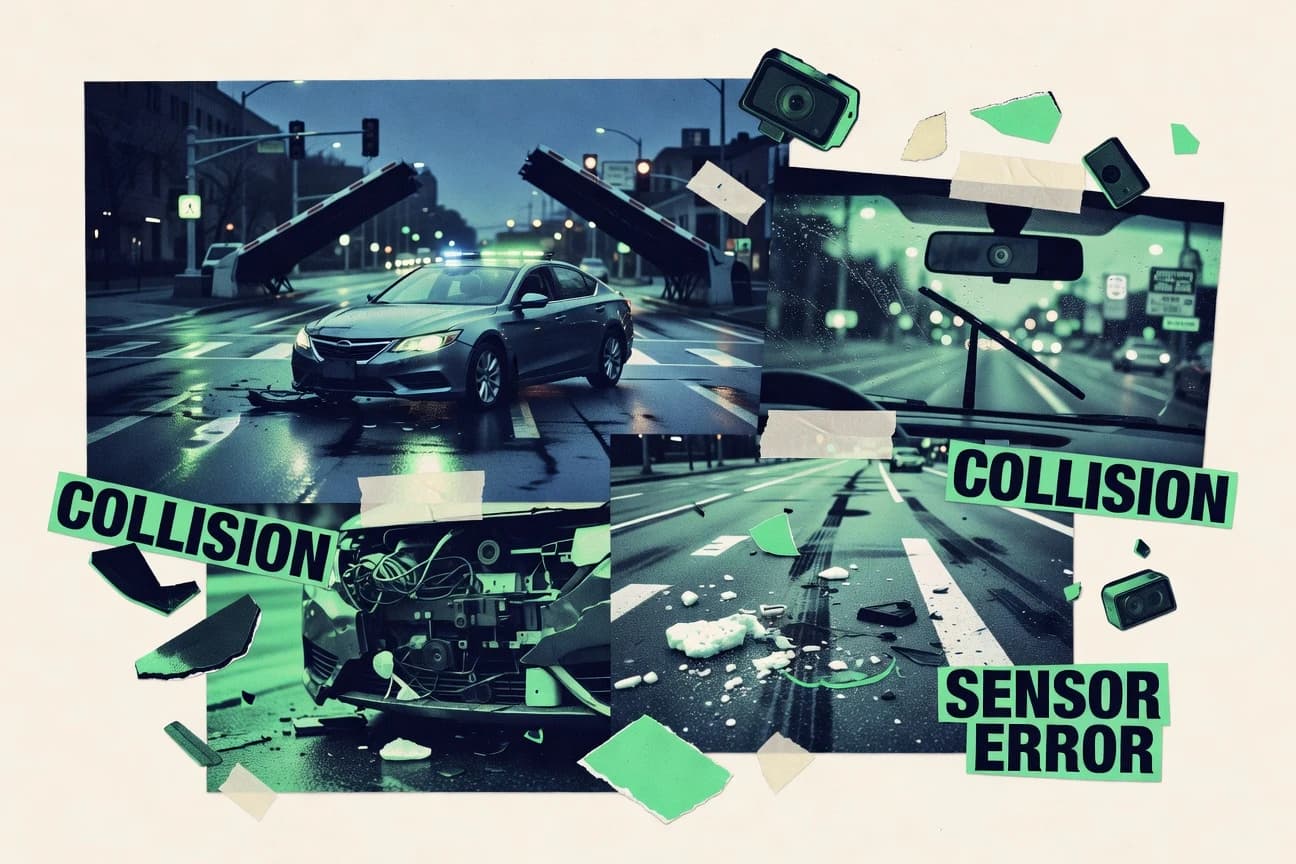
Self Driving Cars Crash Statistics
Self Driving Cars Crash statistics put a spotlight on how often autonomous driving incidents cross from software failure to real world harm and what the latest 2025 numbers reveal about the risk drivers that keep showing up. You will see the sharp contrast between “fender bender” outcomes and the cases that still escalate, and why those patterns matter for every fleet rollout and regulation decision.

Bicycle Injury Statistics
Bicyclist deaths in the U.S. jumped from 857 in 2020 to 1,117 in 2021, yet helmet and visibility measures can sharply cut serious outcomes, including a pooled estimate showing helmet use reduces risk of brain injury by 53%. This page also puts crash costs and injury patterns under the same lens, from billions in U.S. societal spending to the share of cyclist injuries concentrated in head, arm, and lower extremities.

Safety Glasses Statistics
Safety glasses claims reveal a sharp divide between what’s worn and what’s needed, with 2026 data pointing to a continuing gap that still leaves preventable eye injuries on the table. You will see exactly where risk concentrates and which workplace behaviors most often set accidents in motion.

Ladder Injuries Statistics
In the latest Ladder Injuries data, falls from ladders keep dominating the injury picture, with hundreds of people needing treatment after the everyday job turns wrong. You will see exactly where the risk concentrates and which ladder scenarios are most linked to serious outcomes, so you can focus on the parts that matter before an accident forces the lesson.

Drone Accident Statistics
A sharp look at Drone Accident statistics shows how quickly outcomes can swing from minor incidents to serious injury, and why the most common cause still catches people off guard. With 2026 figures highlighting the latest patterns, you will see exactly where risk concentrates and what that means for safer flights.

Hand Injury Statistics
Hand injuries make up about 10% of emergency department cases, yet they are tied to permanent impairment for 1,700 work related injuries in the US and nearly 6% of medically treated work injuries overall, with contact with objects and equipment leading the exposure. You will also see which prevention and treatment choices actually move outcomes, from early mobilization and ultrasound guided injections to tele rehabilitation adoption that jumped from 2% to 18% between 2020 and 2023.

Self-Driving Car Accident Statistics
Self-driving car accident statistics reveal a clear split between what sounds like a software failure and what investigators most often find behind the crash. See the latest 2025 figures on collision circumstances and injury patterns so you can tell where automation risk truly concentrates.

Eye Injury Statistics
Eye injuries are still a daily workplace reality, with 1.3 million cases sustained on the job each year and OSHA requiring protection that fits the hazard and fits properly. You will also see why comfort, fit training, and post exposure habits can swing outcomes, alongside what portion of injury patterns come from things like sports, home accidents, and chemical splashes that prevention is designed to stop.

Dog Attacks Statistics
The latest Dog Attacks statistics show a clear shift in how bites play out, including a major jump to 4,000 dog bite injuries requiring emergency care in the most recent year. Get the details behind where incidents happen most and what circumstances are most likely to turn a routine moment into a trip to the ER.

Electric Car Fire Statistics
Electric Car Fire statistics reveal a shift in what actually drives EV incidents, with the latest numbers for 2026 tightening the gap between rumor and reality. You will see how common causes stack up against real-world outcomes, so you can judge risk with specifics instead of fear.