GITNUX MARKETDATA

Browse Our Category

Mental Health Psychology

Latest update:

Mental Health Psychology
Student Mental Health Statistics

Student Mental Health Statistics

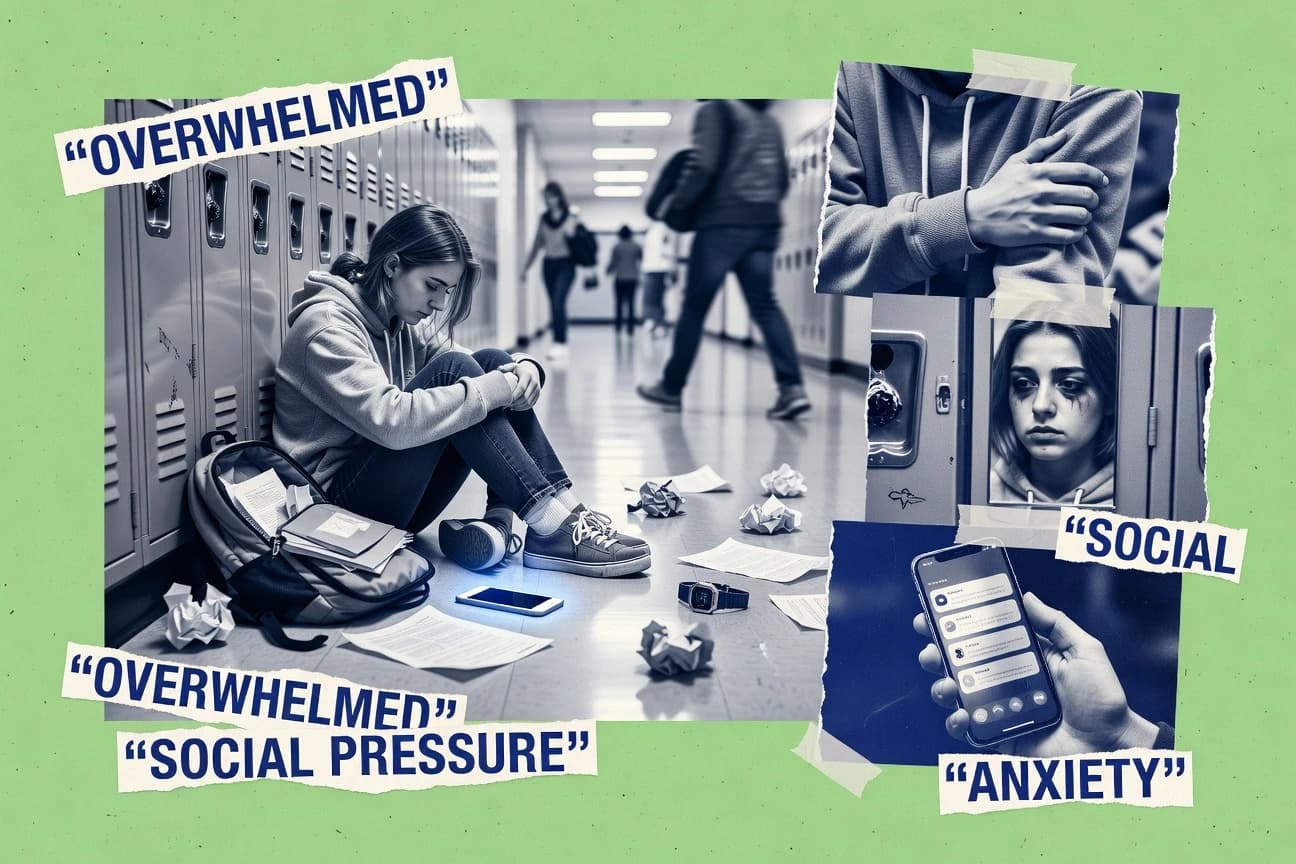
Nearly 43% of U.S. college students who needed mental health care did not get treatment in the past year, even as crisis services and digital tools are expanding fast. Use the page to spot where access breaks down most, from cost and not knowing where to go to the measurable impact of school pathways, tele-mental health, and campus interventions on anxiety, stress, and getting students help.

Read ReportLast refreshed: 15 May 2026
Teachers Mental Health Statistics

Teachers Mental Health Statistics

Almost half of teachers still report burnout symptoms, while 2025 relevant surveys and studies point to an edge teachers can actually feel right away, from unpaid after-hours work and a 40% jump in digital workload during remote and hybrid teaching to 78% saying students’ mental health needs have risen. This page connects those pressure points to real outcomes such as leave likelihood, turnover intention, and which workplace supports like coaching, peer communities, and CBT informed programs are linked with measurable relief.

Read ReportLast refreshed: 15 May 2026
Add And Suicide Statistics

Add And Suicide Statistics

ADHD is not just about attention. Suicide death is doubled to nearly 2 times higher in a meta-analysis of 12 studies and completed suicide was 5.79 times higher in a Swedish cohort, while ideation and attempts spike sharply when depression, anxiety, bipolar disorder, substance use, trauma, or untreated symptoms are in the mix.

Read ReportLast refreshed: 15 May 2026
Comparing Yourself To Others On Social Media Statistics

Comparing Yourself To Others On Social Media Statistics

With 56.4% of the globe using social media in 2024 and 34% of US adults reporting a negative mental health impact, this page zeroes in on how visible metrics like likes and follower counts, plus recommendation algorithms, turn everyday scrolling into upward comparison. You will also see why 1 in 3 users posts mainly for likes or comments and what happens when 13% hide view counts to reduce the pressure.

Read ReportLast refreshed: 14 May 2026
Bulimia Nervosa Statistics

Bulimia Nervosa Statistics

Bulimia nervosa affects about 1.5% of people across their lifetime, but the risk is far from evenly spread, peaking at ages 15 to 24 and appearing in diagnostic thresholds that require binge eating plus compensatory behaviors at least weekly. You will also see why purging is not just a symptom, with clinical episode data showing hypokalemia in 5% of measured episodes, while evidence-based care like CBT can cut binge purge frequency and drive remission in roughly half of patients.

Read ReportLast refreshed: 14 May 2026
Inner Monologue Statistics

Inner Monologue Statistics

With GPT style systems moving from chat to reflection fast, 52% of workers who use AI do it at least weekly, and 67% of companies are already implementing or planning generative AI use cases. This page connects productivity gains and healthcare and customer service adoption to the hard parts of inner monologue style reliability and safety, from hallucinations and prompt injection to the rules that shape what can be shown.

Read ReportLast refreshed: 14 May 2026
Memory Retention Statistics

Memory Retention Statistics

Medication and everyday planning demands make memory work harder for millions, with 54% reporting trouble remembering meds and 35% struggling to stay on top of bills, medications, or appointments. At the same time, the retention payoff is tangible, since 12 weeks of cognitive training improved memory versus control groups with an average effect size of g = 0.30, offering a clear look at what actually helps recall stick.

Read ReportLast refreshed: 14 May 2026
Holiday Depression Statistics

Holiday Depression Statistics

When the lights come on and the calendar says celebrate, rates of distress do not take a holiday, with 17% of U.S. adults reporting feeling down, depressed, or hopeless in the two weeks before the latest survey. This page ties those feelings to the season’s pressure points, from loneliness and financial worries to treatment gaps, showing why holiday stress can hit harder even when help feels out of reach.

Read ReportLast refreshed: 14 May 2026
Separation Anxiety Statistics

Separation Anxiety Statistics

Separation anxiety disorder starts early, often by age 12, and can ripple outward into school refusal for about 50% of affected children, with odds of later anxiety outcomes around 2.0. CBT with gradual, parent involved exposure shows strong symptom gains, while care access and cost pressures stay real as WHO estimates 13% of children ages 5 to 19 had a mental disorder in 2019 and anxiety is among the leading sources of YLDs.

Read ReportLast refreshed: 14 May 2026
Panic Attack Statistics

Panic Attack Statistics

A panic attack can peak in about 10 minutes and still leave lasting fallout, from roughly 3% to 5% suicide attempt risk in people with panic disorder to a current smoking rate around double that of the general population. You will see how treatments stack up, with CBT cutting panic severity by about half and benzodiazepines often working within 1 to 2 weeks, alongside a treatment gap where 23.2% of US adults got mental health care in the past year and many rely on digital tools instead.

Read ReportLast refreshed: 14 May 2026
Anxiety In Teens Statistics

Anxiety In Teens Statistics

Anxiety shows up everywhere for teens, with 10.0% of U.S. adolescents aged 12 to 17 meeting criteria for any anxiety disorder in 2018 and a global systematic review finding that 1 in 4 adolescents reported anxiety symptoms during the first year of COVID-19. This page connects those rates to what teens face, what gets missed, and what helps, including evidence-based CBT delivering clinically meaningful improvement for anxious youth and the fact that about 70% of adolescents with mental disorders do not receive any mental health services.

Read ReportLast refreshed: 14 May 2026
Happiness Statistics

Happiness Statistics

With 1.1 billion people worldwide living with a mental health condition, happiness is shaped by more than mood and culture. This page connects life satisfaction to real-world pressures like work life balance, unemployment, and loneliness, then pairs them with evidence based boosts such as CBT, exercise, mindfulness, and social support.

Read ReportLast refreshed: 14 May 2026
Child Mental Health Statistics

Child Mental Health Statistics

One in five children and adolescents experience a mental health disorder, yet 48.2% of U.S. youths aged 12–17 with serious thoughts of suicide did not receive treatment in the past year. This page puts the human cost beside the price tag, from $14.9 billion in estimated annual untreated illness in the United States to widening service gaps that leave too many young people without the support they need.

Read ReportLast refreshed: 14 May 2026
Alcoholism Statistics

Alcoholism Statistics

Alcohol still drives a massive global burden, with 132.6 million DALYs in 2016 tied to alcohol use and alcohol use disorders responsible for 0.8% of all DALYs in GBD 2019, even as binge drinking and heavy episodic drinking remain disturbingly common. You will also find the sharper contrasts behind the harm, from EU alcohol related costs of €155.9 billion in 2019 to what works in practice, including naltrexone cutting heavy drinking episodes by a median 25% and brief interventions delivering modest but measurable reductions.

Read ReportLast refreshed: 14 May 2026
Smartphone Addiction Statistics

Smartphone Addiction Statistics

With 17.0% of US adults showing at least one problematic digital behavior symptom day in 2023 and global studies linking heavier smartphone use to poorer sleep, more stress, and even higher suicidal ideation risk, the pattern is anything but harmless. The catch is scale and habit tracking so fast that 97% of US adults own a cellphone and many teens check multiple times a day, turning “just a phone” into a measurable mental health and wellbeing pressure.

Read ReportLast refreshed: 14 May 2026
Mental Health In Healthcare Workers Statistics

Mental Health In Healthcare Workers Statistics

After COVID-19, burnout and anxiety symptoms surged, with 1.5 times higher burnout prevalence post-2020 than pre-2020 alongside ICU staff showing 1.4 times higher odds of depression, while many workers still reported barriers to care such as stigma and unclear access to benefits. This page connects those mental health hit points to workplace costs, staffing risk, and what support actually reaches healthcare teams.

Read ReportLast refreshed: 14 May 2026
Teenage Eating Disorder Statistics

Teenage Eating Disorder Statistics

From 2.7% of U.S. teens reporting past year binge eating to a 56,000 YLD burden in 2017, the page connects what is happening in bodies and brains with what it costs families and systems. It also tracks the sharp gender and symptom trend shifts, treatment delays, and the stakes of outcomes like suicide attempts and anorexia mortality, ending with what works such as family based treatment and CBT E.

Read ReportLast refreshed: 14 May 2026
Male Mental Health Statistics

Male Mental Health Statistics

Men still face a sharper mental health and suicide burden than women, with 54.9% of male suicide deaths in the U.S. tied to firearms and men 3.62 times more likely to die by suicide than women during 2019 to 2021. This page also tracks the gap behind the grim outcomes, from unmet help and treatment delays to how loneliness, depression symptoms, and substance use can intersect in ways that are easy to miss.

Read ReportLast refreshed: 14 May 2026
Australia Mental Health Statistics

Australia Mental Health Statistics

With 70% of mental health public spending funded by states and territories and 1.3 million people receiving subsidised PBS antidepressants, this page shows how Australia funds and delivers support while need remains unmet, including an estimated AUD 1.3 billion missing treatment each year. It also tracks the sharper realities behind access and outcomes, from suicide thoughts at 12.7% of Australians in 2020 and self harm hospitalisation rates of 30.2 per 100,000 to First Nations adults being 2.5 times more likely to experience high or very high psychological distress in 2017 to 18.

Read ReportLast refreshed: 14 May 2026
Suicide In Teens Statistics

Suicide In Teens Statistics

A striking 22% of U.S. high school students attempted suicide in the past year, yet LGBTQ+ teens reported attempts at 35%, making the gap impossible to ignore. You will also see what pushes ideation into action, from repeat attempts and medical emergencies to the factors that make some risks much more lethal than others.

Read ReportLast refreshed: 14 May 2026
Mental Health Psychology Statistics (2026) | Page 2