GITNUX MARKETDATA
Browse Our Category
Mental Health Psychology
Latest update:

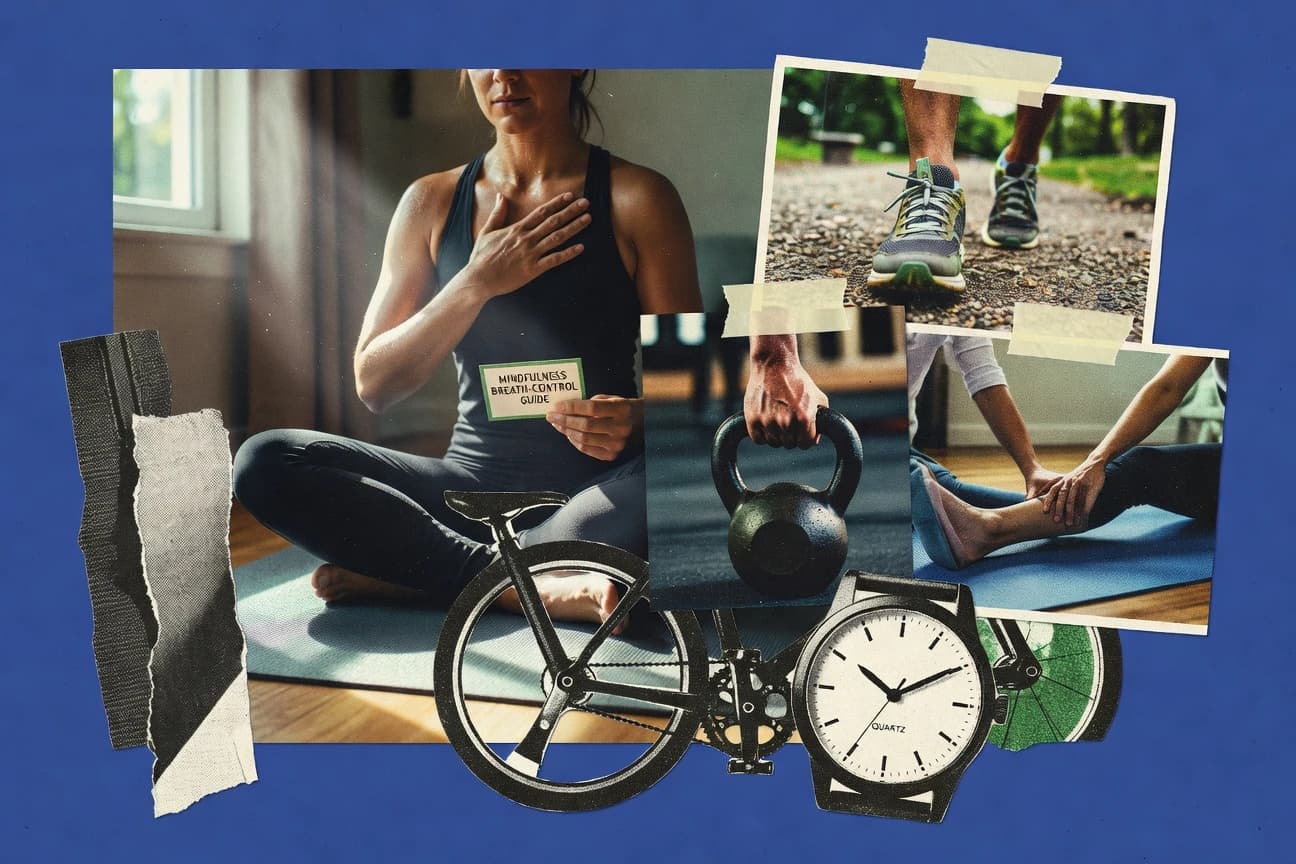
Exercise And Mental Health Statistics
Aerobic exercise cuts GAD-7 anxiety scores by 35% in just 8 weeks while supervised exercise can match CBT efficacy for 65% anxiety remission, so you can see what moves the needle beyond willpower. From yoga and mindfulness to cycling and HIIT, the page stacks results like panic attacks down 40% and stress reactivity down 20% to help you choose the kind of movement that fits your mental health goals.

Success Rate Of Therapy Statistics
See how treatment outcomes stack up across real disorder targets, from 80% panic free follow up with exposure therapy to 77% remission for single trauma with EMDR and 70% independent functioning after agoraphobia therapy. Success Rate Of Therapy pulls these benchmarks together, including 73% sustained benefits over long term follow up and psychotherapy effectiveness that reaches 80% versus placebo in controlled trials, so you can spot where help is most likely to stick.
Motivational Statistics
Teacher encouragement, peer study groups, and a positive classroom climate can turn motivation into measurable performance, from 63% higher motivation with encouragement to 62% of highly motivated students graduating on time. You will also see how the same mindset moves health and work too, with social accountability lifting health goal motivation by 65% and companies with high motivation delivering 21% greater profitability.

Benefits Of Therapy Statistics
Therapy is linked to striking, real world outcomes, from a 60% lower relapse rate over 5 years and up to a $4 to $10 lifetime healthcare ROI to a 25% boost in life satisfaction by age 30. But the page goes beyond individual relief, showing how sustained support can cut suicide risk in half over 10 years and reduce intergenerational trauma transmission by 50%, changing what families and communities carry forward.

Body Image Teenager Statistics
By 2021 and 2022 data, girls are twice as likely as boys to report body dissatisfaction, 62% versus 31%, while 2022 findings also show 48% of girls aged 15 to 17 have negative self image compared with 22% of boys. This page connects those gaps to real pressures behind the mirror, including dieting, muscle dissatisfaction, and social media comparisons, plus what actually helps teens feel more at home in their bodies.

Construction Mental Health Statistics
With global construction mental health costs hitting $11B from lost productivity and US insurance premiums rising 12 percent from mental health claims, this page shows how psychological strain turns into absenteeism, rework, and safety risk. It also puts the human toll in sharp focus, including UK construction firms losing £500M yearly to mental ill health and UK construction workers twice as likely to suffer depression as other sectors.

Social Media And Body Image Statistics
After 20% rises in body dissatisfaction in lab-tested teens, the same platforms that drive connection also inflate comparison cycles at scale, from TikTok daily comparing at 40% to Instagram likes fueling anxiety in 26% of teens. This page maps how feeds, filters, and “fitspo” pressure ripple into real outcomes and why a week-long detox or media literacy can shift mental health for many.

Self Confidence Statistics
Self-confidence is linked to a measurable jump in performance, with confident students scoring 15 to 20 percent higher on standardized tests and high self-efficacy improving math performance by 30 percent. But the flip side is just as specific, low confidence doubles truancy rates and raises bullying victimization by 35 percent, so the page makes it hard to ignore what one mindset can change across school, health, and work.
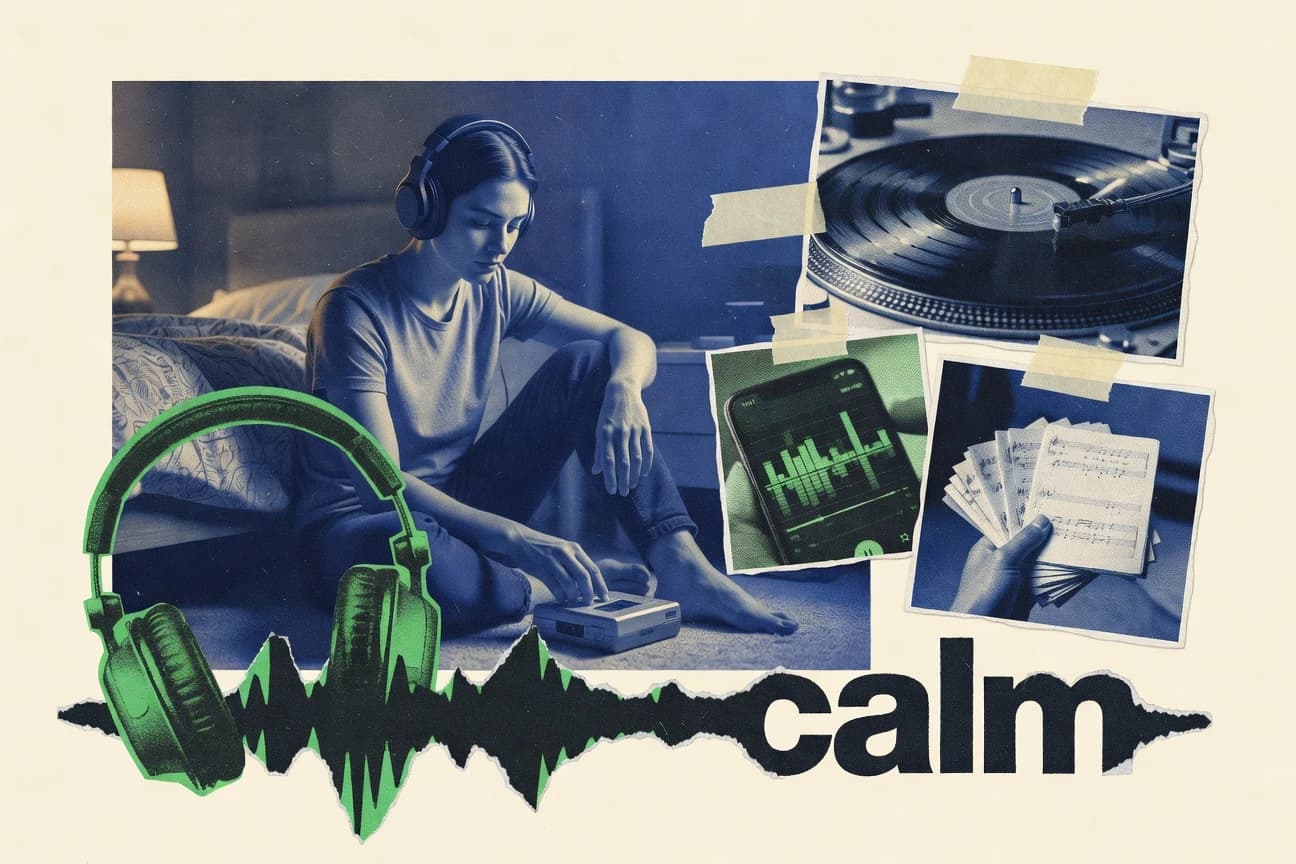
Music And Mental Health Statistics
From a 71 percent recall jump in music-trained older adults to music therapy cutting depression by a 0.98 effect size, this page maps how rhythm, singing, and structured listening can shift memory, mood, stress, and sleep. You will also see why the brain reacts beyond feelings, including 40 percent fewer ICU stress symptoms and a 35 percent boost in positive emotions from live music.

Self Awareness Statistics
Self-awareness is one of EQ’s core components, and the page connects it to measurable wins from a 60% reduction in exam anxiety through self-awareness routines to a 45% boost in progress awareness with gamified learning. If you have ever wondered why some people spot their blind spots early and others stay stuck, this is the clearest place to see what actually changes behavior, performance, and relationships.

Athlete Mental Health Statistics
Even when 6.3% of student athletes meet the criteria for clinically significant depression symptoms, many still hesitate because only 10% of athletes with mental health issues seek professional help and 40% fear disclosures could cost playing time. This page connects the stigma and training gaps to the exact barriers athletes face and points to what actually helps, from 60% of professional teams offering 24/7 mental health hotlines to mindfulness and sports psychologist support that can shift outcomes.
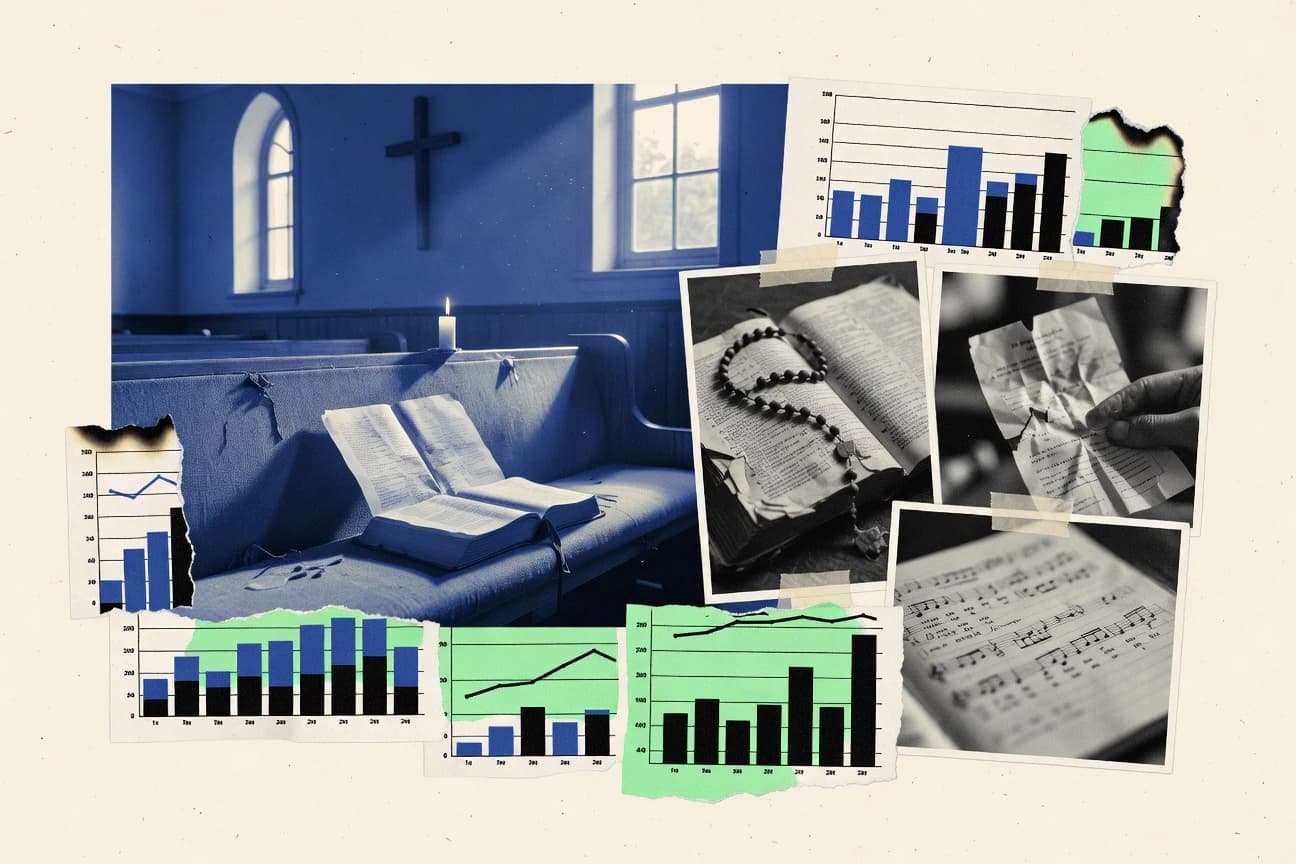
Religion And Depression Statistics
Religion and Depression pairs stark group contrasts with longitudinal signals that matter for real lives, from atheists showing 22% higher CES-D scores to weekly religious service attendance cutting depression symptom odds by 35% and religiosity at baseline reducing follow up depression by 25%. It also tracks what helps and what harms over time, with religious doubt and spiritual struggles raising depression risk while sustained prayer and religious meaning making buffer the trajectory.

Internet Addiction Statistics
Internet addiction affects about 6% of the global population, yet the risk can flip dramatically by identity, age, and setting with males 1.5 times more likely than females and teens aged 12 to 18 showing a 20% higher risk than adults. You will see how gaming and social media diverge, how mental health outcomes stack up with depression risk up 25%, and which interventions like CBT and mindfulness are already showing measurable gains.

College Athlete Mental Health Statistics
With anxiety rates as high as 37% for soccer athletes and depression climbing from 23% pre pandemic to 38% during COVID 19, these statistics reveal how quickly mental health strain can spike across campus sports. You will also find the hard gap between need and support, since only 36% of college athletes seek professional help, alongside role specific patterns like 0.5% annual suicidal ideation and 65% preferring to talk with teammates.

Gen Z Depression Statistics
Gen Z depression rates hit 48 percent of Gen Z adults reporting symptoms of depression in 2023 and therapy and treatment still do not reach everyone, with 35 percent of Gen Z with depression dropping out of school. See how the gaps stack up across identities, stressors, and habits, from LGBTQ plus rates at 55 percent and low income at 2.5 times higher to sleep under six hours raising depression risk by 40 percent and substance abuse climbing 50 percent.

Student Depression Statistics
Female students report depression at 55% versus 25% for males, and pandemic-era shifts are still reshaping the risk map. With 44% of college students screening positive in 2021 to 2022 and first-year women reporting 48% anxious depressive symptoms, this page connects the sharpest subgroup differences and the biggest drivers so you can see exactly what may be behind rising campus sadness.

Depression After Divorce Statistics
Depression After Divorce is not one size fits all with women 2.5 times more likely than men to develop major depression after divorce and 45 to 54 the peak age range where women are 10 percent higher. This page maps sharp contrasts like 40 percent of recently divorced adults reporting depressive symptoms at 6 months and 75 percent of those who get therapy remitting within 2 years, so you can see what changes and what does not.

Social Media Self Esteem Statistics
When social media use runs long, the cost can be immediate with daily use over 3 hours linked to a 0

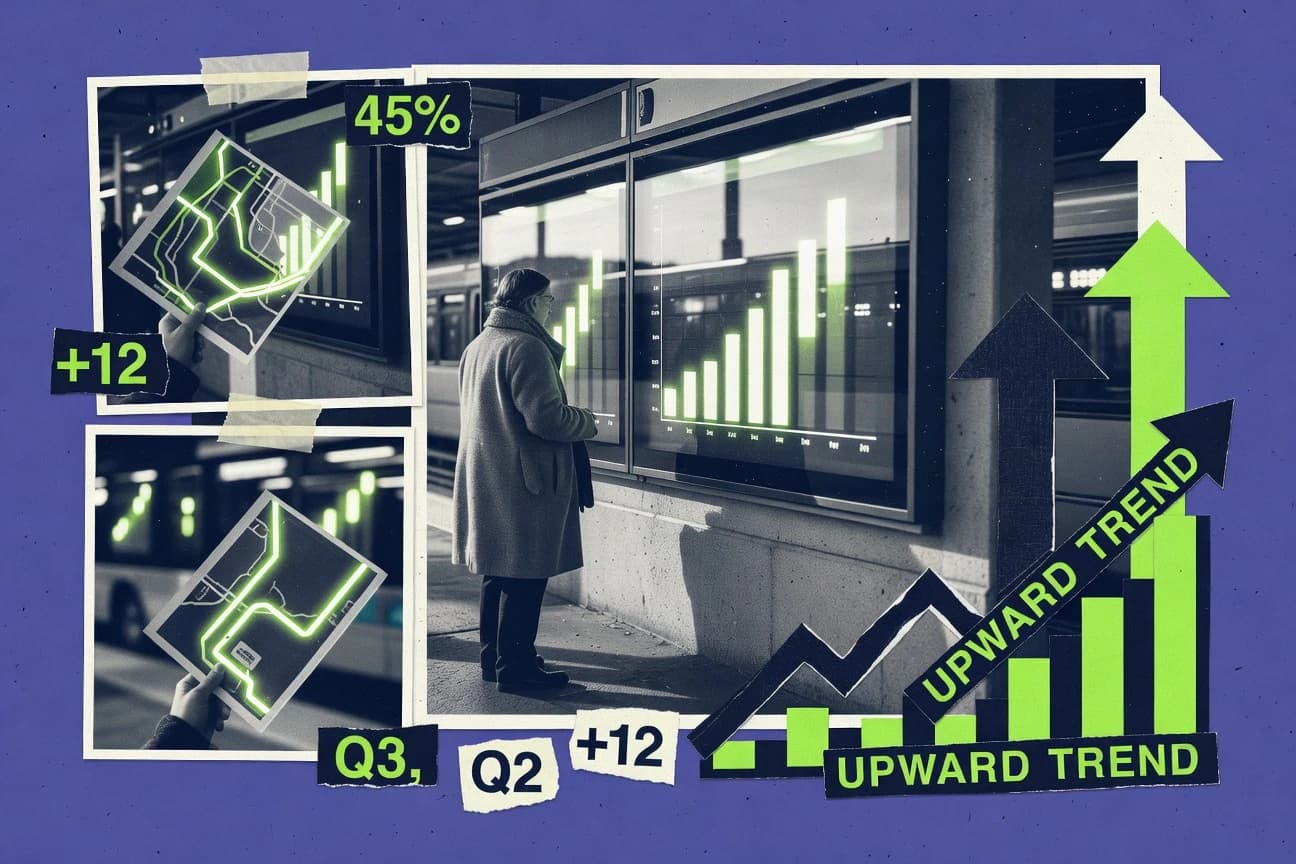
Psychology Industry Statistics
The Psychology Industry market is accelerating fast, with global mental health apps projected to jump from $4.2 billion in 2021 to $17.5 billion by 2030 at a 17.1% CAGR, while e-therapy grows to $32.08 billion by 2032. Use these figures to see where demand is surging and where outcomes are still lagging, from telepsychiatry reaching $3.8 billion to research funding of $1.2 billion from the NIH in 2023 and treatment access still leaving 72% of US adults with mental illness untreated.

Social Media Attention Span Statistics
A 2024 Gen Z ad scroll can stay locked in for just 8 seconds, yet the internet nudges you to look again and again as platforms quietly thin focus into 1.7 second Twitter dwell and 4 second TikTok link glances. See how attention has fallen from minutes to moments and what that fragmentation is doing to memory, mood, and daily productivity.