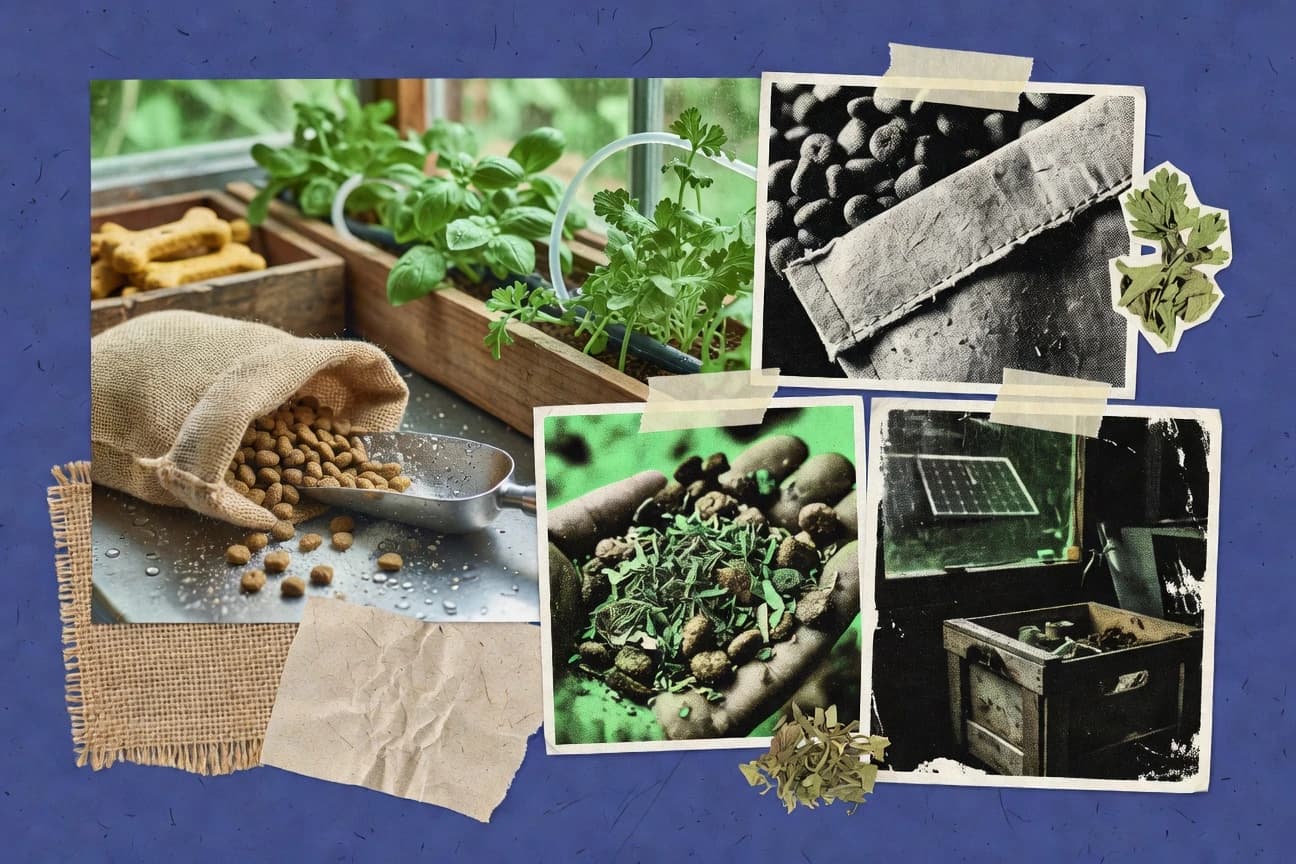

Livestock drives 14.5% of global anthropogenic greenhouse gas emissions, rising to 18% when land use change is included, which makes feed sourcing a central climate hotspot in conventional pet food. Pet owners already reward sustainability, with 65% willing to pay more for sustainable pet products that show results beyond packaging claims. Food loss and waste still reaches about 1.05 billion tonnes globally, so production efficiency and upstream inputs directly shape the environmental footprint of what reaches pet bowls.
Key Takeaways
- 2020: Livestock accounted for 14.5% of global anthropogenic GHG emissions (18% when land-use change is included)—a major driver of emissions in conventional meat-based pet food ingredients.
- 2023: The U.S. EPA estimates that methane accounts for about 10% of total U.S. greenhouse gas emissions—relevant because anaerobic digestion and landfill management affect organic waste sustainability across pet food supply chains.
- 2017: Land use for agriculture occupied about 38% of Earth’s total land area—important for land-use impacts of feed and agricultural ingredients in pet food.
- 2022: EU Regulation (EC) No 767/2009 requires feed labeling and information for pet food, influencing sustainability claims and ingredient disclosure practices.
- 2022: EU Regulation (EC) No 183/2005 establishes hygiene requirements for feed, affecting process controls and waste management for pet food plants.
- 2021: The EU’s Single-Use Plastics Directive (2019/904) targets specific plastic items, influencing packaging and alternative material choices by brands.
- 2023: The European Commission estimates that by 2030, 60% of packaging should be recycled, up from current rates—driving packaging change for pet food brands.
- 2022: The global organic pet food market was valued at $5.2 billion (derived from major market research aggregations) — indicating demand for “better-for-you” and sustainability-aligned options.
- 2023: The global plant-based pet food market was valued at $2.1 billion (market research estimate), supporting the growth of ingredient pathways designed to reduce environmental impacts.
- 2023: For EU companies under CSRD, sustainability reporting becomes mandatory for covered entities, increasing adoption of sustainability metrics and targets in pet food industry segments.
- 2023: According to the EU Commission, biodegradable and compostable packaging labeling rules require claims to be scientifically substantiated—affecting adoption of “compostable” claims in pet food packaging.
- 2022: In the U.S., the USDA Organic program establishes certification requirements; products labeled “organic” must be certified, influencing adoption of certified ingredients in organic pet foods.
- 1.05 billion tonnes global food loss and waste in 2022—an indicator of inefficiency that also affects upstream inputs to pet food supply chains.
- 3% of global energy-related CO2 emissions were attributed to food loss and waste in 2010—relevant for the climate footprint of processing and logistics inefficiencies that can affect pet food.
- 2022: Global pet food was valued at $123.1 billion—industry scale that determines the potential magnitude of sustainability improvements.
Pet food sustainability matters because livestock emissions, food waste, land and energy use shape a large share of impacts.
Related reading
01 · Category
Environmental Footprint7 stats
01
2020: Livestock accounted for 14.5% of global anthropogenic GHG emissions (18% when land-use change is included)—a major driver of emissions in conventional meat-based pet food ingredients.https://www.fao.org/3/a0701e/a0701e00.htm
02
2023: The U.S. EPA estimates that methane accounts for about 10% of total U.S. greenhouse gas emissions—relevant because anaerobic digestion and landfill management affect organic waste sustainability across pet food supply chains.https://www.epa.gov/ghgemissions/overview-greenhouse-gases
03
2017: Land use for agriculture occupied about 38% of Earth’s total land area—important for land-use impacts of feed and agricultural ingredients in pet food.https://www.fao.org/faostat/en/
04
2022: Global food loss and waste was estimated at ~1.05 billion tonnes (FAO)—relevant to pet food production and ingredient utilization efficiency.https://www.fao.org/3/cc2654en/cc2654en.pdf
05
2016: The IEA reports that the global food supply chain accounts for around 8% of global final energy demand—relevant to energy intensity in pet food processing and logistics.https://www.iea.org/reports/cooking-without-fear
06
2019: Global freshwater withdrawals for agriculture were about 70% of total withdrawals—relevant to water sourcing for crops used in pet food.https://www.fao.org/aquastat/en/overview/methodology/
07
2018: The IPCC reports that CO2 is responsible for about 76% of global warming potential—useful for translating emissions into climate impact metrics for pet food carbon footprinting.https://www.ipcc.ch/report/ar5/syr/
Interpretation
Environmental Footprint Interpretation
Environmental pressures behind the pet food industry are substantial because livestock alone drives 14.5% of global anthropogenic greenhouse gas emissions, agriculture uses about 38% of Earth’s land, and agriculture accounts for roughly 70% of freshwater withdrawals.
02 · Category
Regulation & Standards6 stats
01
2022: EU Regulation (EC) No 767/2009 requires feed labeling and information for pet food, influencing sustainability claims and ingredient disclosure practices.https://eur-lex.europa.eu/eli/reg/2009/767/oj
02
2022: EU Regulation (EC) No 183/2005 establishes hygiene requirements for feed, affecting process controls and waste management for pet food plants.https://eur-lex.europa.eu/eli/reg/2005/183/oj
03
2021: The EU’s Single-Use Plastics Directive (2019/904) targets specific plastic items, influencing packaging and alternative material choices by brands.https://eur-lex.europa.eu/eli/dir/2019/904/oj
04
2021: California’s Proposition 65 requires warnings for exposures to certain chemicals, influencing ingredient/material risk controls for pet food manufacturers selling in California.https://oag.ca.gov/prop65
05
2020: EU REACH Regulation (EC) No 1907/2006 governs chemicals used in manufacturing and packaging—affecting materials and compliance for pet food supply chains.https://eur-lex.europa.eu/eli/reg/2006/1907/oj
06
2022: The Task Force on Climate-related Financial Disclosures (TCFD) framework remains used for climate risk reporting—supporting climate disclosure practices for pet food companies.https://www.fsb-tcfd.org/publications/final-recommendations-report/
Interpretation
Regulation & Standards Interpretation
In the Regulation and Standards category, Europe’s tightening framework is evident with multiple 2020 to 2022 measures from REACH and hygiene rules to EU feed labeling, alongside U.S. Proposition 65 in 2021 and climate disclosure guidance that keeps expanding from 2022, showing that compliance expectations for pet food sustainability are being enforced across chemicals, processes, labeling, and climate risk.
03 · Category
Market Trends7 stats
01
2023: The European Commission estimates that by 2030, 60% of packaging should be recycled, up from current rates—driving packaging change for pet food brands.https://environment.ec.europa.eu/topics/waste-and-recycling/packaging-waste_en
02
2022: The global organic pet food market was valued at $5.2 billion (derived from major market research aggregations) — indicating demand for “better-for-you” and sustainability-aligned options.https://www.alliedmarketresearch.com/organic-pet-food-market-A14155
03
2023: The global plant-based pet food market was valued at $2.1 billion (market research estimate), supporting the growth of ingredient pathways designed to reduce environmental impacts.https://www.fortunebusinessinsights.com/plant-based-pet-food-market-106604
04
2024: The global pet food market reached $117.0 billion (market research estimate), a scale indicator for how sustainability interventions can impact large volumes.https://www.precedenceresearch.com/pet-food-market
05
2023: Pet food brands increasingly adopt lifecycle assessment (LCA); One brand’s public LCA study for kibble indicates that ingredient sourcing can dominate impacts (showing LCA use)—but exact percentages vary by study scope.https://www.pepsico.com/docs/transforming-our-business/sustainability-documents/pet-food-lca.pdf
06
2021: In the U.S., the EPA’s Food Recovery Hierarchy is used widely by businesses; donations and prevention are ranked above landfill, influencing waste reduction strategies adopted by pet food facilities.https://www.epa.gov/sustainable-management-food/food-recovery-hierarchy
07
2022: The EU’s “Farm to Fork” strategy sets targets to reduce fertilizer use by 20% by 2030—relevant for feed ingredient sustainability in pet food supply chains.https://food.ec.europa.eu/horizontal-topics/farm-fork-strategy_en
Interpretation
Market Trends Interpretation
As sustainability becomes a market priority in pet food, Europe targets 60% recycled packaging by 2030 and the industry is scaling up demand and innovation, with the global organic market at $5.2 billion in 2022 and the global plant based segment at $2.1 billion in 2023.
04 · Category
Adoption & Behavior6 stats
01
2023: For EU companies under CSRD, sustainability reporting becomes mandatory for covered entities, increasing adoption of sustainability metrics and targets in pet food industry segments.https://eur-lex.europa.eu/eli/dir/2022/2464/oj
02
2023: According to the EU Commission, biodegradable and compostable packaging labeling rules require claims to be scientifically substantiated—affecting adoption of “compostable” claims in pet food packaging.https://eur-lex.europa.eu/eli/reg/2019/1009/oj
03
2022: In the U.S., the USDA Organic program establishes certification requirements; products labeled “organic” must be certified, influencing adoption of certified ingredients in organic pet foods.https://www.ams.usda.gov/services/organic-certification
04
2020: The EFSA and European Commission guidance on feed material safety drives adoption of stricter quality and traceability controls for alternative ingredients sometimes used in “sustainability” pet feeds.https://www.efsa.europa.eu/en/efsajournal/pub/6457
05
2023: The ISO 14001 environmental management standard has global uptake across industries; adopting certified EMS can institutionalize sustainability practices at manufacturing sites used by pet food suppliers.https://www.iso.org/iso-14001-environmental-management.html
06
2022: The EU’s eIDAS and digital reporting trends can support traceability and documentation for regulated supply chains; adoption is increasingly required by large buyers—affecting pet food ingredient sourcing verification.https://digital-strategy.ec.europa.eu/en/policies/eidas-regulation
Interpretation
Adoption & Behavior Interpretation
In the Adoption & Behavior category, adoption is accelerating in 2023 and 2022 because new sustainability reporting and packaging labeling rules under EU policy, alongside broader certification and traceability requirements like USDA Organic and eIDAS, push companies toward more standardized practices with clear compliance signals.
More related reading
05 · Category
Supply Chain Emissions2 stats
01
1.05 billion tonnes global food loss and waste in 2022—an indicator of inefficiency that also affects upstream inputs to pet food supply chains.https://www.fao.org/3/cc0961en/cc0961en.pdf
02
3% of global energy-related CO2 emissions were attributed to food loss and waste in 2010—relevant for the climate footprint of processing and logistics inefficiencies that can affect pet food.https://www.sciencedirect.com/science/article/pii/S0959652612000035
Interpretation
Supply Chain Emissions Interpretation
With 1.05 billion tonnes of global food loss and waste in 2022 and food loss and waste accounting for 3% of global energy-related CO2 emissions in 2010, the pet food supply chain’s climate impact is strongly tied to how efficiently upstream ingredients are produced, handled, and prevented from being wasted.
06 · Category
Market Size2 stats
01
2022: Global pet food was valued at $123.1 billion—industry scale that determines the potential magnitude of sustainability improvements.https://www.grandviewresearch.com/industry-analysis/pet-food-market
02
2023: The global pet care market exceeded $168 billion—context for how quickly sustainability programs can scale within adjacent pet categories.https://www.imarcgroup.com/pet-care-market
Interpretation
Market Size Interpretation
With global pet food valued at $123.1 billion in 2022 and the broader pet care market topping $168 billion in 2023, the Market Size shows there is a large and fast scaling revenue base for sustainability initiatives to make meaningful impact.
07 · Category
Consumer & Claims2 stats
01
65% of pet owners are willing to pay more for sustainable pet products—supports the business case for sustainability-linked sourcing and packaging changes.https://www.packagingstrategies.com/articles/93902-research-shows-consumers-want-more-sustainable-pet-packaging
02
2024: 62% of pet owners believe companies should reduce packaging waste—supports packaging redesign and recyclability targets across pet food brands.https://www.thinkwithgoogle.com/consumer-insights/pet-ownership-trends-and-packaging/
Interpretation
Consumer & Claims Interpretation
In the Consumer & Claims landscape, pet owners are signaling a clear sustainability expectation, with 65% willing to pay more for sustainable pet products and 62% saying companies should cut packaging waste.
08 · Category
Compliance & Standards4 stats
01
2021: ISO 14064-1 provides a framework for quantifying and reporting greenhouse gas emissions and removals at the organizational level—commonly used to structure company carbon accounting used in sustainability reporting.https://www.iso.org/standard/66462.html
02
2020: ISO 14040 defines the principles and framework for life cycle assessment (LCA)—a core method for pet food carbon and environmental footprinting studies.https://www.iso.org/standard/68507.html
03
2021: ISO 14044 specifies requirements and guidelines for LCA—often used to support robust LCA studies behind pet food sustainability claims.https://www.iso.org/standard/22794.html
04
2022: ISO 22095 establishes principles and requirements for traceability in the feed chain—useful for verifying sourcing of ingredients into pet food.https://www.iso.org/standard/73629.html
Interpretation
Compliance & Standards Interpretation
In the Compliance and Standards area, the industry’s guidance quickly expands from lifecycle assessment standards in 2020 and 2021 to greenhouse gas reporting in 2021 and traceability requirements in 2022, showing a clear shift toward more rigorous, standardized proof for sustainability claims.
report visual · Key figures
Key environmental impact drivers for pet food ingredients
High-impact upstream factors—livestock emissions, agricultural land use, and methane’s share of greenhouse gases—help explain why sustainability efforts in pet food often focus on sourcing and waste/energy management.
14.5%
2020: Livestock accounted for 14.5% of global anthropogenic GHG emissions (18% when land-use change is included)—a major
10%
2023: The U.S. EPA estimates that methane accounts for about 10% of total U.S. greenhouse gas emissions—relevant because
38%
2017: Land use for agriculture occupied about 38% of Earth’s total land area—important for land-use impacts of feed and
70%
2019: Global freshwater withdrawals for agriculture were about 70% of total withdrawals—relevant to water sourcing for c
source-verifiedfao.org · epa.gov2023
Reference
Cite This Report
This report is designed to be cited. We maintain stable URLs and versioned verification dates. Copy the format appropriate for your publication below.
APA
David Sutherland. (2026, February 13). Sustainability In The Pet Food Industry Statistics. Gitnux. https://gitnux.org/sustainability-in-the-pet-food-industry-statistics
MLA
David Sutherland. "Sustainability In The Pet Food Industry Statistics." Gitnux, 13 Feb 2026, https://gitnux.org/sustainability-in-the-pet-food-industry-statistics.
Chicago
David Sutherland. 2026. "Sustainability In The Pet Food Industry Statistics." Gitnux. https://gitnux.org/sustainability-in-the-pet-food-industry-statistics.
Sources & references
36 datasets cited across this report
+14 additional datasets cited (not shown individually)