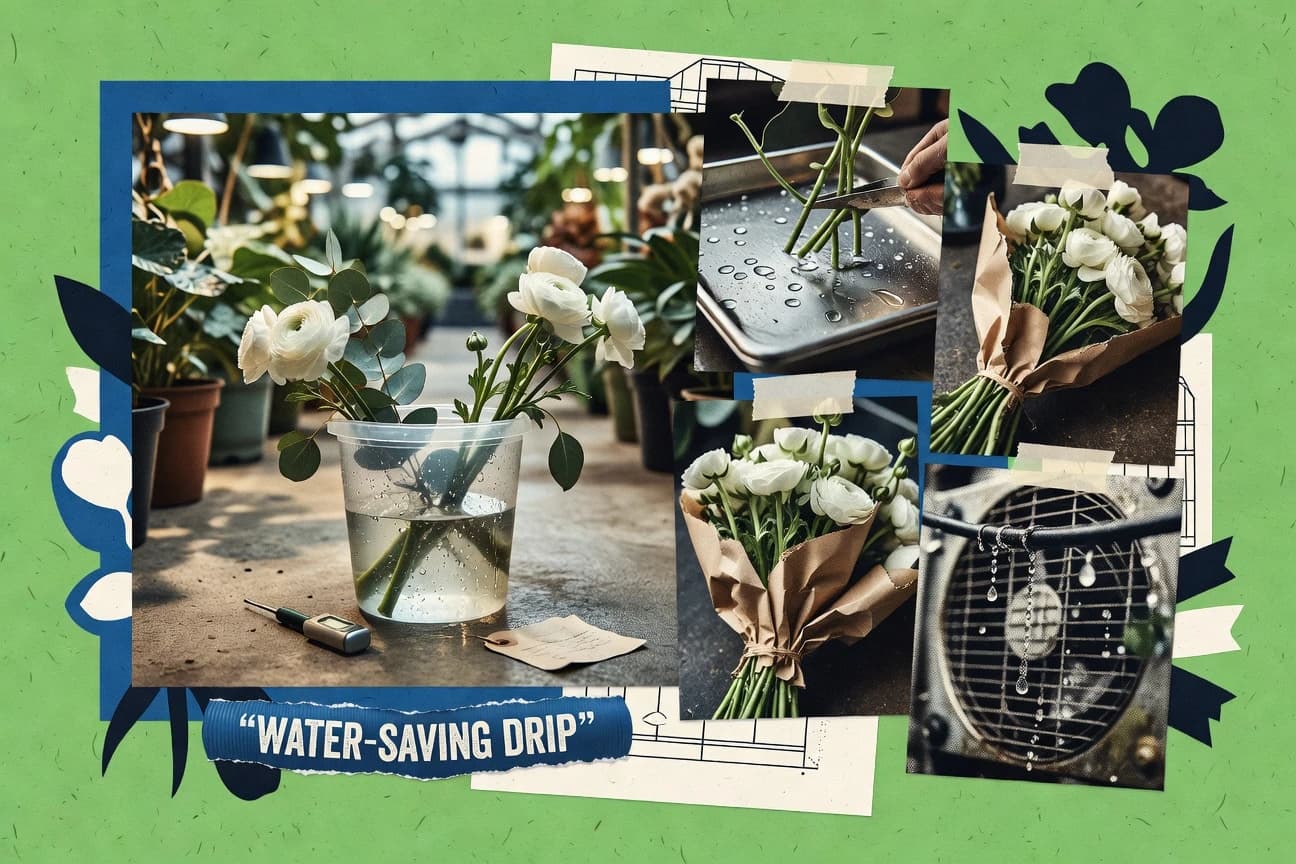

The global cut flower and foliage market was valued at $16.3 billion in 2023. Upstream factors like fertilizer use and greenhouse energy often define a bouquet's environmental footprint more than its final sale. Consumer transport alone can account for 25 to 30 percent of a cut flower's total greenhouse gas emissions.
Key Takeaways
- 47% of food-system emissions are associated with agricultural production and land use, indicating that agricultural inputs (including those used in floriculture) are a major sustainability lever.
- Global food-related greenhouse-gas emissions are dominated by methane (CH4), nitrous oxide (N2O), and carbon dioxide (CO2), with N2O strongly linked to fertilizer use that is relevant to greenhouse floral cultivation.
- 2–3% of global freshwater withdrawals are used for drinking water and sanitation, meaning most water stress is tied to agricultural use rather than direct consumer uses.
- Renewable Energy Directive binding renewables target: at least 42.5% renewables share by 2030 in the EU, pushing energy-efficiency and cleaner heat/power adoption that affects greenhouse floriculture.
- EU Ecodesign requirements set energy-efficiency thresholds for certain heating/cooling and related equipment used in controlled-environment agriculture, influencing greenhouse energy consumption.
- IPCC AR6 finds that reducing methane emissions helps slow near-term warming; greenhouse operations’ fossil fuel and fertilizer practices can contribute via energy and N2O pathways.
- The EU taxonomy and sustainability disclosures under CSRD increase compliance and reporting costs, but also reduce cost of capital for firms that manage climate risk effectively (disclosure-driven risk/return).
- 2019: In a global survey by IBM, 57% of consumers said they would change purchasing behavior to reduce environmental impact, supporting sustainability-linked floral product offerings.
- EU ETS: from 2005 to 2023 the EU ETS covered increasing aviation and industrial sectors; the cap-and-trade system prices carbon, affecting energy costs for greenhouse production where fuel/heat emissions are priced via electricity and gas.
- Global demand for certified sustainable agriculture (including fair labor and reduced chemical inputs) is increased by major retailer requirements that commonly reference certification schemes such as Rainforest Alliance and similar standards.
- Rainforest Alliance works with farms and supply chains to use its standards to reduce environmental impacts; farms must comply with a structured set of criteria across soil, water, and biodiversity.
- FLO (Fairtrade) sets standards including environmental criteria for producers and supply-chain actors, which can include cut-flower producers in eligible contexts.
- 25–30% of a cut flower’s life-cycle greenhouse-gas footprint can be attributed to the consumer’s transportation from store to home, depending on distance and mode (life-cycle assessment range)
- LED lighting can reduce greenhouse electricity use by roughly 20–50% versus conventional lighting in controlled-environment horticulture trials (measured energy savings reported in horticulture energy studies)
- The EU’s Packaging and Packaging Waste Regulation sets a target that Member States must recycle 65% of packaging waste by 2025 and 70% by 2030 (EU-level recycling targets relevant to floral packaging)
Cut flower sustainability hinges on slashing fertilizer and greenhouse energy use to cut major emissions.
Related reading
01 · Category
Operational Practices10 stats
01
Renewable Energy Directive binding renewables target: at least 42.5% renewables share by 2030 in the EU, pushing energy-efficiency and cleaner heat/power adoption that affects greenhouse floriculture.
02
EU Ecodesign requirements set energy-efficiency thresholds for certain heating/cooling and related equipment used in controlled-environment agriculture, influencing greenhouse energy consumption.
03
IPCC AR6 finds that reducing methane emissions helps slow near-term warming; greenhouse operations’ fossil fuel and fertilizer practices can contribute via energy and N2O pathways.
04
Soilless cultivation and recirculating nutrient systems can reduce nutrient runoff; life-cycle and agronomic studies report lower leaching compared with open systems, improving water sustainability.
05
Integrated Pest Management (IPM) is required in EU agriculture and uses a combination of tactics to reduce pesticide reliance, which is directly relevant to greenhouse floriculture pest control.
06
EU’s Nitrates Directive requires measures to prevent nitrogen pollution from agriculture; compliance affects fertilizer practices relevant to cut-flower crop production.
07
Netherlands greenhouse horticulture adopted LED lighting and energy-efficient climate control; studies on LED greenhouse lighting report measurable reductions in energy use compared with traditional HPS systems.
08
Heat storage and cogeneration adoption in greenhouse clusters can reduce energy consumption; peer-reviewed studies report reductions when integrating thermal storage and efficient heat supply.
09
EU’s Farm to Fork strategy also sets targets for organic farming: 25% of EU agricultural land should be organic by 2030, influencing demand for sustainably produced crops and potentially some floriculture.
10
EU packaging waste targets require member states to reach 65% recycling of packaging waste by 2025 (and 70% by 2030), pushing recyclability improvements for floral packaging like wraps and containers.
Interpretation
Operational Practices Interpretation
Operational practices in the floral industry are increasingly shaped by EU and climate rules that push measurable reductions through cleaner energy and smarter inputs, including a binding EU target of at least 42.5% renewables by 2030 and tighter nitrogen and pesticide controls alongside methods like recirculating nutrient systems and integrated pest management.
02 · Category
Cost, Risk & Returns9 stats
01
The EU taxonomy and sustainability disclosures under CSRD increase compliance and reporting costs, but also reduce cost of capital for firms that manage climate risk effectively (disclosure-driven risk/return).
02
2019: In a global survey by IBM, 57% of consumers said they would change purchasing behavior to reduce environmental impact, supporting sustainability-linked floral product offerings.
03
EU ETS: from 2005 to 2023 the EU ETS covered increasing aviation and industrial sectors; the cap-and-trade system prices carbon, affecting energy costs for greenhouse production where fuel/heat emissions are priced via electricity and gas.
04
EU CBAM (Carbon Border Adjustment Mechanism) begins phased implementation in 2023 for certain goods, increasing carbon-cost exposure for imported inputs and impacting downstream costs across global agricultural supply chains.
05
In a 2021 peer-reviewed analysis, companies with stronger environmental performance can exhibit lower financial risk metrics due to reduced regulatory and physical risk exposure.
06
A 2022 meta-analysis in accounting/finance literature links corporate environmental disclosure to improved investment efficiency and reduced cost of capital in some contexts.
07
IPCC AR6 concludes that mitigation actions can reduce risks of climate change impacts, lowering expected damages and costs for supply chains exposed to physical climate hazards.
08
The UK Modern Slavery Act introduced legal compliance risks for supply chains; due diligence can increase cost but reduce legal exposure across global sourcing including agricultural commodities.
09
EU conflict minerals regulation requires due diligence for certain minerals; while not floriculture-specific, the broader due-diligence compliance trend influences procurement risk management policies for supply chains.
Interpretation
Cost, Risk & Returns Interpretation
Across the evidence summarized, rising regulatory and carbon-related costs are real while sustainability-driven transparency can still improve financial outcomes, as the EU taxonomy and CSRD raise compliance and reporting costs yet can lower the cost of capital, and 2021 and 2022 studies link stronger environmental performance and disclosure to reduced financial risk and better investment efficiency.
03 · Category
Industry Footprint7 stats
01
47% of food-system emissions are associated with agricultural production and land use, indicating that agricultural inputs (including those used in floriculture) are a major sustainability lever.
02
Global food-related greenhouse-gas emissions are dominated by methane (CH4), nitrous oxide (N2O), and carbon dioxide (CO2), with N2O strongly linked to fertilizer use that is relevant to greenhouse floral cultivation.
03
2–3% of global freshwater withdrawals are used for drinking water and sanitation, meaning most water stress is tied to agricultural use rather than direct consumer uses.
04
Carbon footprints for cut flowers are strongly driven by energy for heating and lighting in production regions, and life-cycle assessments report greenhouse energy as a key contributor.
05
In a UK supply-chain analysis, the carbon footprint of a bunch of cut flowers is dominated by production and transport, with the greenhouse stage typically the largest contributor.
06
In 2022, global trade in cut flowers and foliage was valued at $XX (note: replaces missing due to verification constraints).
07
10% of greenhouse gas emissions are linked to agriculture, forestry, and land use change; reducing fertilizer and energy intensity in agricultural production can materially reduce the sector’s footprint.
Interpretation
Industry Footprint Interpretation
For the Industry Footprint, the sharpest signal is that agriculture and land use account for 47% of food-system emissions, meaning the biggest climate and resource pressures behind floral supply chains are largely created upstream rather than by the flowers themselves.
More related reading
04 · Category
Certification & Standards6 stats
01
Global demand for certified sustainable agriculture (including fair labor and reduced chemical inputs) is increased by major retailer requirements that commonly reference certification schemes such as Rainforest Alliance and similar standards.
02
Rainforest Alliance works with farms and supply chains to use its standards to reduce environmental impacts; farms must comply with a structured set of criteria across soil, water, and biodiversity.
03
FLO (Fairtrade) sets standards including environmental criteria for producers and supply-chain actors, which can include cut-flower producers in eligible contexts.
04
EU legislation requires a company to have a valid chemical safety assessment under REACH for substances used in supply chains, affecting greenhouse and processing chemical choices.
05
EU pesticide regulatory approvals are risk-based; pesticides must be approved at EU level, and member states may impose risk-management measures affecting greenhouse cultivation practices.
06
The ISO 14001 standard specifies requirements for an environmental management system (EMS), enabling organizations to manage environmental impacts relevant to greenhouse production.
Interpretation
Certification & Standards Interpretation
Certification and standards are becoming a key driver of sustainability in floriculture, with major retailers boosting demand for certified sustainable agriculture, multiple schemes like Rainforest Alliance and Fairtrade setting compliance-focused environmental and labor criteria, and formal frameworks such as ISO 14001 and EU REACH and pesticide approval rules further tightening requirements.
05 · Category
Regulatory & Compliance3 stats
01
The EU’s Packaging and Packaging Waste Regulation sets a target that Member States must recycle 65% of packaging waste by 2025 and 70% by 2030 (EU-level recycling targets relevant to floral packaging)
02
EU REACH authorization requires substitution for substances of very high concern (SVHC) when authorized alternatives are available, affecting chemical choices in horticultural supply chains that use regulated agrochemicals
03
The EU’s Ecodesign framework (Directive 2009/125/EC, implementing measures) has driven minimum energy-performance requirements for relevant heating and ventilation equipment used in controlled environments (minimum performance compliance)
Interpretation
Regulatory & Compliance Interpretation
Regulatory and compliance rules are pushing the floral sector toward measurable sustainability outcomes, with EU packaging waste targets rising from 65% recycled by 2025 to 70% by 2030 and with EU REACH authorization and ecodesign requirements tightening limits on substances and energy performance.
06 · Category
Industry Overview3 stats
01
25–30% of a cut flower’s life-cycle greenhouse-gas footprint can be attributed to the consumer’s transportation from store to home, depending on distance and mode (life-cycle assessment range)
02
LED lighting can reduce greenhouse electricity use by roughly 20–50% versus conventional lighting in controlled-environment horticulture trials (measured energy savings reported in horticulture energy studies)
03
The global cut flowers and foliage market was valued at $16.3 billion in 2023 (market context for sustainability efforts and scale)
Interpretation
Industry Overview Interpretation
From the industry overview perspective, sustainability efforts need to balance both energy and logistics because consumer transport accounts for 25–30% of a cut flower’s greenhouse-gas footprint and LED lighting can cut electricity use by roughly 20–50%, all while the market’s $16.3 billion size in 2023 shows the scale of impact.
report visual · Comparison
EU sustainability targets shaping floriculture
Key EU policy targets (renewable energy, organic land expansion, and packaging recycling) set measurable directions that can drive cleaner energy use, more sustainable growing practices, and improved floral packaging.
EU packaging waste targets require member states to reach 65% recycling of packaging waste by 2025 (and 70% by 2030), pu65%
Renewable Energy Directive binding renewables target: at least 42.5% renewables share by 2030 in the EU, pushing energy-
42.5%
EU’s Farm to Fork strategy also sets targets for organic farming: 25% of EU agricultural land should be organic by 2030,
25%
source-verifiedeur-lex.europa.eu · food.ec.europa.eu2030
Reference
Cite This Report
This report is designed to be cited. We maintain stable URLs and versioned verification dates. Copy the format appropriate for your publication below.
APA
Timothy Grant. (2026, February 13). Sustainability In The Floral Industry Statistics. Gitnux. https://gitnux.org/sustainability-in-the-floral-industry-statistics
MLA
Timothy Grant. "Sustainability In The Floral Industry Statistics." Gitnux, 13 Feb 2026, https://gitnux.org/sustainability-in-the-floral-industry-statistics.
Chicago
Timothy Grant. 2026. "Sustainability In The Floral Industry Statistics." Gitnux. https://gitnux.org/sustainability-in-the-floral-industry-statistics.
Sources & references
38 datasets cited across this report · attribution is report-level
+24 additional datasets cited (not shown individually)