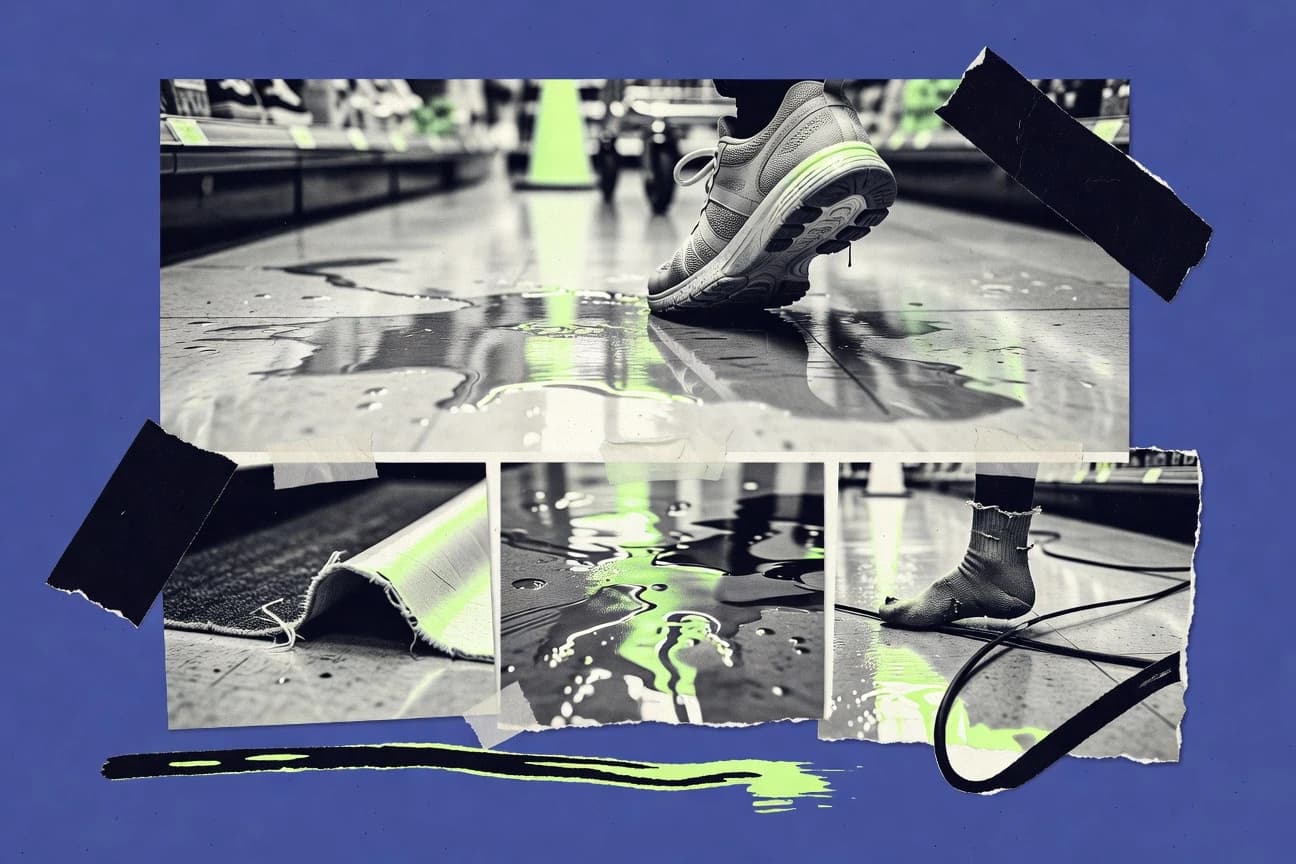

Slip, trip, and fall incidents happen in both workplaces and public areas, leading to injuries from sprains and strains to traumatic brain injuries, hip fractures, and even death. The risks often come from day-to-day conditions like wet floors, uneven surfaces, cluttered walkways, and poor lighting, plus personal factors such as age and sex. This page covers where these incidents are most common, who is most at risk, and which prevention steps help reduce harm.
Key Takeaways
- Fall costs US $50 billion annually in medical expenses
- Workers' comp for slips/trips averages $25,000 per case
- OSHA fines for fall violations average $14,500 per serious case
- In 2021, slips, trips, and falls accounted for 27% of all nonfatal occupational injuries in the private industry sector
- Approximately 1 million emergency department visits occur annually in the US due to slips, trips, and falls among older adults
- Falls cause over 38,000 deaths each year in the United States, with slips and trips contributing significantly
- Sprains/strains are 40% of slip/trip injuries
- Traumatic brain injuries from falls: 223,000 hospitalizations yearly US
- Hip fractures: 300,000 annually in US adults 65+
- Wet floors cause 70% of slip incidents in public areas
- Uneven surfaces contribute to 25% of trip hazards in workplaces
- Poor lighting is a factor in 15% of all slip/trip incidents
- Women aged 65-74 have 1.5 times higher fall risk than men
- Adults over 85 have 4x higher fall death rate than 65-74 group
- Males account for 55% of fatal occupational falls
Falls from slips and trips cost billions each year, but prevention programs can cut injuries by 25 to 50%.
Related reading
01 · Category
Economic And Prevention Stats20 stats
01
Fall costs US $50 billion annually in medical expenses
02
Workers' comp for slips/trips averages $25,000per case
03
OSHA fines for fall violations average $14,500per serious case
04
Fall prevention programs reduce injuries by 25-50%
05
Non-slip footwear cuts slips by 60% in labs
06
Housekeeping improvements lower slip rates 50%
07
Tai Chi reduces falls 20-45% in elderly
08
Guardrails prevent 85% of edge falls
09
Vitamin D supplementation lowers falls 20% in deficient elderly
10
Anti-slip coatings reduce incidents 70% on ramps
11
Warning signs decrease slips 30% in wet areas
12
Balance training programs cut falls 23%
13
Floor mats with edges prevent 40% trips
14
Lighting upgrades reduce falls 39%
15
Stair nosing improves safety, cutting falls 35%
16
Exercise interventions save $1,000per person annually
17
Prompt spill cleanup reduces claims 55%
18
Home modifications lower falls 30% for seniors
19
Safety audits identify 80% of hazards pre-incident
20
Multifactorial interventions reduce falls 24%
Interpretation
Economic And Prevention Stats Interpretation
For the economic and prevention side of slip trip fall issues, prevention is clearly cost effective because fall prevention programs can reduce injuries by 25 to 50%, while slips alone cost about $50 billion annually in medical expenses and average $25,000 per workers’ comp case.
02 · Category
Frequency And Prevalence23 stats
01
In 2021, slips, trips, and falls accounted for 27% of all nonfatal occupational injuries in the private industry sector
02
Approximately 1 million emergency department visits occur annually in the US due to slips, trips, and falls among older adults
03
Falls cause over 38,000 deaths each year in the United States, with slips and trips contributing significantly
04
In the UK, slips and trips cause 95% of workplace falls from height less than 2 meters
05
Globally, falls are responsible for 684,000 deaths annually according to WHO estimates
06
In US workplaces, slips, trips, and falls represent 15% of all accidental deaths, second only to motor vehicles
07
Nursing homes report slips, trips, and falls as the cause of 60% of resident injuries
08
In retail trade, slips and trips cause 32.5 injuries per 10,000 workers annually
09
Construction industry sees 46.7 slip, trip, fall cases per 10,000 full-time workers
10
In 2020, there were 805,000 hospital admissions worldwide due to fall-related injuries
11
US adults aged 65+ experience 3 million emergency visits yearly from falls
12
Workplace slips and trips lead to 30-50 days off work on average per incident in Europe
13
In Australia, slips, trips, falls cause 20% of serious workers' claims
14
Food services industry has 42.1 slip/fall injury rates per 10,000 workers
15
Globally, 37.3 million falls are severe enough to require medical attention yearly
16
In US private industry, 200,000+ slip/trip/fall cases reported in 2022
17
Elderly falls in homes account for 55% of all fall injuries
18
Healthcare workers experience slips/trips at 75.4 per 10,000 workers
19
In Canada, falls are the top cause of injury hospitalizations, 42% of total
20
UK slips/trips cause 40,000 fractures annually
21
US military reports 25,000 slip/trip/fall injuries per year
22
Transportation sector has 38.2 slip/fall rates per 10,000 workers
23
In 2019, falls killed 39.5 per 100,000 older adults in US
Interpretation
Frequency And Prevalence Interpretation
For frequency and prevalence, slips, trips, and falls are a persistent problem with 27% of all nonfatal private sector injuries in 2021 and about 1 million emergency department visits each year among older adults in the United States.
03 · Category
Injury Types And Severity20 stats
01
Sprains/strains are 40% of slip/trip injuries
02
Traumatic brain injuries from falls: 223,000 hospitalizations yearly US
03
Hip fractures: 300,000 annually in US adults 65+
04
Fatal falls increase spine injuries by 50% in elderly
05
20-30% of falls cause moderate to severe bruising
06
Knee injuries from slips: 25% of total cases
07
Ankle fractures: 15% of nonfatal fall injuries
08
10% of falls lead to long-term disability
09
Upper extremity fractures 22% in occupational falls
10
Pelvic fractures rise 15% post-fall in seniors
11
Concussions from falls: 58,000 in children yearly
12
Shoulder dislocations 12% of trip injuries
13
37 million falls severe enough for medical care globally
14
Back strains: 28% of slip-related claims
15
Wrist fractures common in 18% forward fall cases
16
50% of hip fracture patients never regain independence
17
Soft tissue injuries 45% in retail slips
18
Skull fractures: 5% of fatal fall outcomes
19
Lacerations/abrasions 20% of minor fall injuries
20
Multiple fractures occur in 8% severe falls from height
Interpretation
Injury Types And Severity Interpretation
Across slip and trip injuries, sprains and strains make up 40% of cases and a meaningful share of harm is severe, with 20% to 30% leading to moderate to severe bruising and 223,000 traumatic brain injury hospitalizations occurring each year in the US.
More related reading
04 · Category
Risk Factors And Causes22 stats
01
Wet floors cause 70% of slip incidents in public areas
02
Uneven surfaces contribute to 25% of trip hazards in workplaces
03
Poor lighting is a factor in 15% of all slip/trip incidents
04
Cluttered walkways cause 22% of trips in offices
05
Improper footwear leads to 18% of slip injuries
06
Ice and snow account for 40% of winter slips
07
Loose mats/rugs cause 30% of home falls for elderly
08
Spills and leaks responsible for 50% of food service slips
09
Human factors like distraction contribute to 60% of trips
10
Defective stairs cause 25% of workplace falls
11
Oil/grease on floors leads to 35% of manufacturing slips
12
Carrying loads obscures vision in 20% of incidents
13
Weather-related slips increase by 300% in rainy seasons
14
Inadequate housekeeping causes 80% of slips in hospitality
15
Extension cords pose trip risk in 12% of office cases
16
Sloped surfaces contribute to 28% of outdoor falls
17
Fatigue increases slip risk by 40%
18
Contaminated shoes cause 15% of manufacturing trips
19
Thresholds/doorways lead to 18% of entry/exit falls
20
Lack of handrails on stairs causes 22% of stair falls
21
Overloaded carts cause 10% of warehouse trips
22
Poor floor maintenance responsible for 45% of public slips
Interpretation
Risk Factors And Causes Interpretation
When it comes to risk factors and causes of slip trip fall incidents, wet floors and winter ice and snow are the dominant drivers with 70% of public-area slips and 40% of winter slips, showing that conditions of the walking surface are the biggest underlying problem.
05 · Category
Victim Demographics21 stats
01
Women aged 65-74 have 1.5 times higher fall risk than men
02
Adults over 85 have 4x higher fall death rate than 65-74 group
03
Males account for 55% of fatal occupational falls
04
Hispanic workers have 20% higher slip injury rates
05
Women represent 60% of nonfatal fall injuries in healthcare
06
Children under 5 have 25% higher trip rates indoors
07
Construction workers aged 45-54 peak in fall injuries
08
Elderly females have 2x hip fracture risk from falls
09
African American seniors fall at 1.3x rate of whites
10
Roofers have 90x higher fall death rate than average
11
Nurses average 2 falls per shift risk exposure
12
Males 75+ have highest fall mortality at 101 per 100,000
13
Low-income elderly have 30% higher fall incidence
14
Obese individuals have 25% greater slip risk
15
Veterans report 20% higher fall rates post-service
16
Janitors/ cleaners have 5x average slip injury rate
17
Rural residents fall 1.4x more than urban
18
Diabetics have 2.4x higher fall risk
19
Bartenders experience 3x slip rates due to spills
20
Hip fractures from falls 90% in those over 65
21
Head injuries comprise 35% of fall ER visits in kids
Interpretation
Victim Demographics Interpretation
Across victim demographics, the risk of slip trip falls is strongly age and sex dependent, with women aged 65 to 74 facing 1.5 times higher fall risk and adults over 85 having a 4 times higher fall death rate than the 65 to 74 group.
report visual · Breakdown
Slip, Trip, Fall: Cost & Consequences vs. Prevention Gains
Slip, trips, and falls are both expensive and deadly—but targeted prevention can substantially reduce injuries.
60%
Non-slip footwear cuts slips by 60% in labs
40%
Floor mats with edges prevent 40% trips
Reference
Cite This Report
This report is designed to be cited. We maintain stable URLs and versioned verification dates. Copy the format appropriate for your publication below.
APA
Henrik Dahl. (2026, February 13). Slip Trip Fall Statistics. Gitnux. https://gitnux.org/slip-trip-fall-statistics
MLA
Henrik Dahl. "Slip Trip Fall Statistics." Gitnux, 13 Feb 2026, https://gitnux.org/slip-trip-fall-statistics.
Chicago
Henrik Dahl. 2026. "Slip Trip Fall Statistics." Gitnux. https://gitnux.org/slip-trip-fall-statistics.
Sources & references
13 datasets cited across this report · attribution is report-level