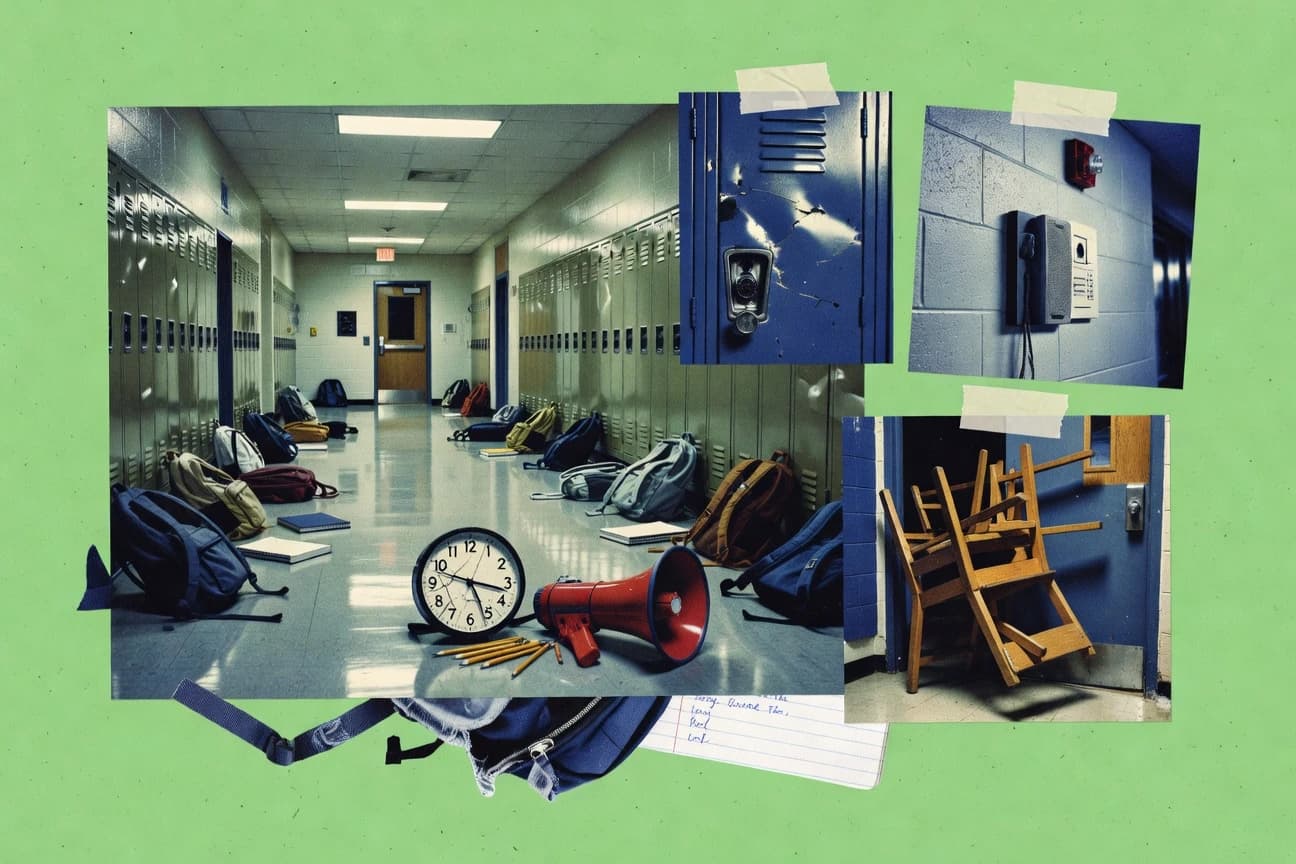

School shootings are often portrayed as sudden, rare events. In Secret Service data from 2008 to 2017, 69% occurred on school property and 29% happened during the school day. The trends in weapon access and prior warning behaviors point to missed prevention opportunities and more preventable risk.
Key Takeaways
- 29% of school shootings reported to the U.S. Secret Service occurred during the school day (analysis of 2008–2017 school shooting incidents in the U.S.)
- 69% of school shootings occurred on school property (U.S. Secret Service analysis of 2008–2017 incidents)
- 53% of targeted school attacks involved a weapon that was brought onto school grounds (U.S. Secret Service analysis of 2008–2017 incidents)
Most school shootings happen on school property, during school hours, often involving male teens with handguns.
Related reading
01 · Category
Industry Trends30 stats
01
29% of school shootings reported to the U.S. Secret Service occurred during the school day (analysis of 2008–2017 school shooting incidents in the U.S.)
02
69% of school shootings occurred on school property (U.S. Secret Service analysis of 2008–2017 incidents)
03
53% of targeted school attacks involved a weapon that was brought onto school grounds (U.S. Secret Service analysis of 2008–2017 incidents)
04
55% of attackers were between ages 12 and 17 (U.S. Secret Service analysis of 2008–2017 incidents)
05
90% of school shootings in the U.S. Secret Service dataset involved male attackers (2008–2017 incidents)
06
36% of attackers did not have a known history of violence (U.S. Secret Service analysis of 2008–2017)
07
78% of attackers had no prior arrests (U.S. Secret Service analysis of 2008–2017 incidents)
08
71% of attackers exhibited concerning behaviors before the incident (U.S. Secret Service analysis of 2008–2017)
09
48% of attackers threatened or communicated their intent prior to the incident (U.S. Secret Service analysis of 2008–2017)
10
66% of attackers made their threats directly to people who knew them (U.S. Secret Service analysis of 2008–2017)
11
62% of attackers used a handgun as the primary weapon (U.S. Secret Service analysis of 2008–2017)
12
8% of incidents involved an explosive device (U.S. Secret Service analysis of 2008–2017 school attacks)
13
27% of attackers had a history of mental health treatment, as indicated in case narratives (U.S. Secret Service analysis of 2008–2017)
14
45% of attackers had some form of leakage (i.e., communications of intent) prior to the attack (U.S. Secret Service analysis of 2008–2017)
15
50% of attackers made preparations for the attack in the 24–72 hours prior (U.S. Secret Service analysis of 2008–2017)
16
22% of incidents included a self-directed action by the attacker (e.g., suicide or attempted suicide) (U.S. Secret Service analysis of 2008–2017)
17
31% of incidents were ended by law enforcement action (U.S. Secret Service analysis of 2008–2017)
18
16% of incidents ended before law enforcement arrival (U.S. Secret Service analysis of 2008–2017)
19
2.8% of school shootings resulted in a fatality among victims (U.S. Secret Service dataset analysis context, 2008–2017)
20
1,000+ incidents of school shootings were recorded by K–12 school shooting databases (reported in the U.S. Secret Service report as a cumulative public-safety concern; dataset size discussed in report background)
21
19% of incidents involved multiple attackers (U.S. Secret Service analysis of 2008–2017)
22
44% of victims were students; 33% were staff in incidents involving injury or death (U.S. Secret Service analysis of 2008–2017)
23
10% of incidents involved a shooting where the attacker intended to kill (U.S. Secret Service analysis of 2008–2017; intent classification)
24
28% of incidents involved a shooting where the attacker did not demonstrate an intent to kill (U.S. Secret Service analysis of 2008–2017; intent classification)
25
4% of incidents involved shootings where intent was indeterminate (U.S. Secret Service analysis of 2008–2017)
26
72% of attacks were single shooting events rather than prolonged shooting (U.S. Secret Service analysis of 2008–2017)
27
12% of incidents involved the attacker using multiple weapons (U.S. Secret Service analysis of 2008–2017)
28
37% of incidents involved an attacker who appeared to have planned for the attack (U.S. Secret Service analysis of 2008–2017)
29
25% of incidents involved an attacker who had a pathway of known communications/leakage prior to the incident (U.S. Secret Service analysis of 2008–2017)
30
12% of school shooting incidents happened in the spring months (seasonality breakdown shown in U.S. Secret Service report)
Interpretation
Industry Trends Interpretation
Across 2008 to 2017 incidents, the pattern shows that 69% of school shootings happened on school property and 53% involved weapons brought onto campus, meaning the majority were not random off site events but attacks carried out with ready access to school or nearby resources.
More related reading
Reference
Cite This Report
This report is designed to be cited. We maintain stable URLs and versioned verification dates. Copy the format appropriate for your publication below.
APA
Samuel Norberg. (2026, February 13). School Shooters Statistics. Gitnux. https://gitnux.org/school-shooters-statistics
MLA
Samuel Norberg. "School Shooters Statistics." Gitnux, 13 Feb 2026, https://gitnux.org/school-shooters-statistics.
Chicago
Samuel Norberg. 2026. "School Shooters Statistics." Gitnux. https://gitnux.org/school-shooters-statistics.
Sources & references
1 datasets cited across this report · attribution is report-level