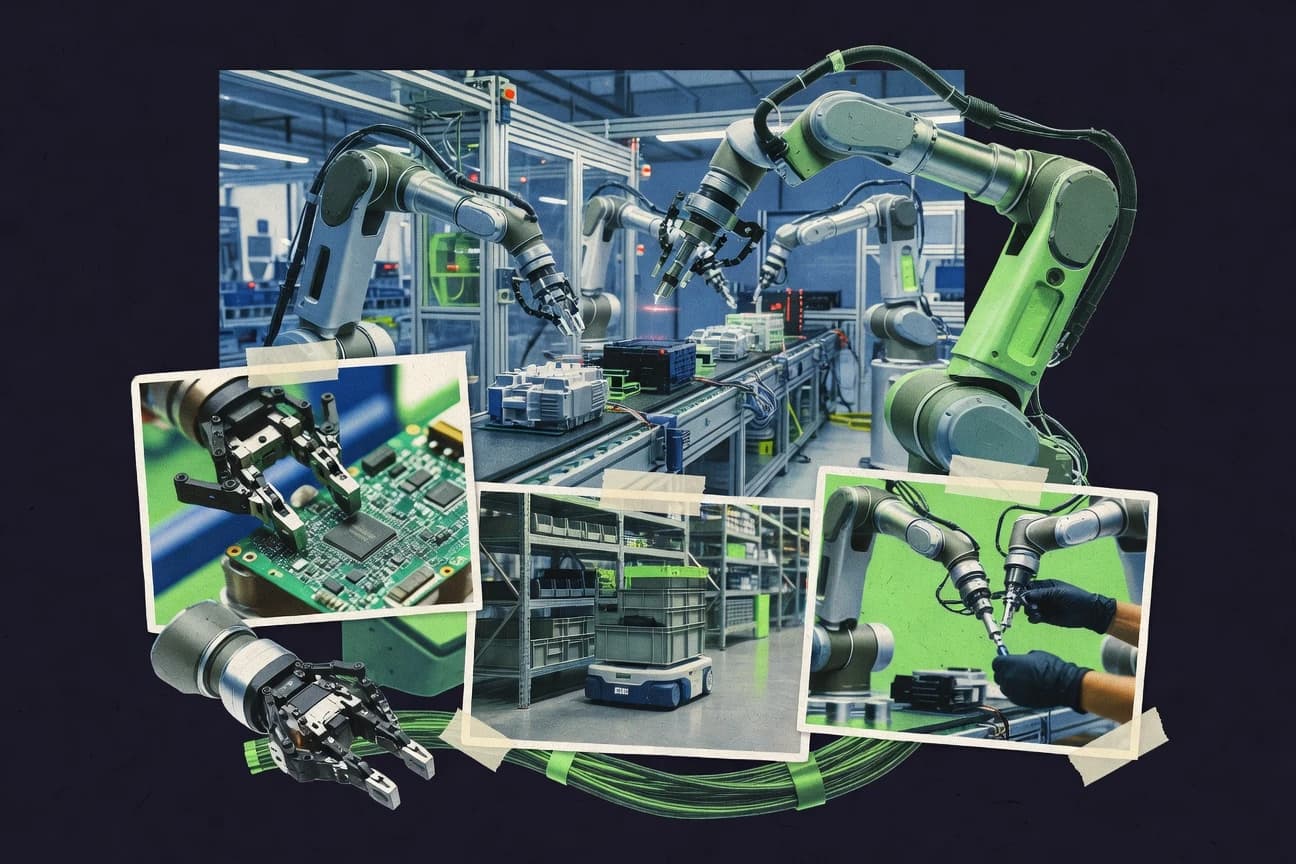

Robotics is transforming healthcare, manufacturing, and logistics across Europe and North America—impacting providers, plant teams, warehouse operators, and the workforce that supports these systems. On this page, you’ll see how adoption plays out in practice, from faster fulfillment in warehouse automation to the expanded use of collaborative robots and the safety guidance behind them. We also cover deployment realities such as integration complexity, total cost tradeoffs, and cybersecurity risks in industrial controls.
Key Takeaways
- Europe led healthcare robotics adoption among regions, with 34% of healthcare organizations using robots (survey-based)
- 36% of manufacturers reported using robots for material handling (survey-based)
- The US FDA cleared more than 2,000 types of robotic surgical instruments between 2018 and 2023 (FDA database count as of 2023)
- The average time-to-deploy robots in warehouses reported by a 2022 intralogistics survey was 8 weeks
- A 2021 study found warehouse automation can reduce order fulfillment times by 20% to 30%
- In manufacturing settings, implementing industrial robotics can reduce cycle time by up to 50% (case-study range reported in academic review)
- Robots accounted for 11% of cyber incidents in industrial controls environments in 2023 (survey-derived industrial cybersecurity reporting)
- The median total cost of ownership (TCO) for warehouse robots was reported as $3.2 million over 5 years in a 2020 logistics automation study
- A 2022 survey found 42% of organizations cite integration complexity as a key barrier to robotics adoption (survey metric)
- A 2019 World Economic Forum report estimated that automation could displace 75 million jobs globally by 2025
- The collaborative robot market is forecast to reach $20.6 billion by 2028 (vendor research forecast)
- Autonomous mobile robots (AMRs) market size was estimated at $1.9 billion in 2020 (vendor research baseline)
- 7.4% year-over-year growth in robotics and robotic systems spending in 2023 (IDC estimate).
Healthcare and industry robotics are accelerating fast, driven by FDA approvals, better warehouse speed, and rising spending.
Related reading
01 · Category
User Adoption6 stats
01
Europe led healthcare robotics adoption among regions, with 34% of healthcare organizations using robots (survey-based)
02
36% of manufacturers reported using robots for material handling (survey-based)
03
The US FDA cleared more than 2,000 types of robotic surgical instruments between 2018 and 2023 (FDA database count as of 2023)
04
3,400+ manufacturing companies participated in IFR member surveys used to compile regional robot installation statistics for 2023 (survey participation count, IFR methodology).
05
42% of warehouse operators cite payback as a top decision criterion for robots (survey metric in 2023 intralogistics operator poll).
06
33% of manufacturing firms in Germany use industrial robots in production according to the 2024 ZVEI/CPI survey dataset summary (adoption rate).
Interpretation
User Adoption Interpretation
User adoption of robotics is clearly broadening, with concrete evidence like 34% of European healthcare organizations already using robots and 36% of manufacturers reporting robot use for material handling, while in the US the FDA cleared over 2,000 robotic surgical instrument types from 2018 to 2023.
02 · Category
Performance Metrics13 stats
01
The average time-to-deploy robots in warehouses reported by a 2022 intralogistics survey was 8 weeks
02
A 2021 study found warehouse automation can reduce order fulfillment times by 20% to 30%
03
In manufacturing settings, implementing industrial robotics can reduce cycle time by up to 50% (case-study range reported in academic review)
04
Collaborative robots are designed for reduced guarding needs; ISO/TS 15066 addresses safety requirements for collaborative operation
05
ISO 13482:2014 provides safety requirements for personal care robots
06
In a meta-analysis of robotics in healthcare, 1,200+ studies were reviewed with evidence of reductions in surgical time when robots are used (review scope metric)
07
Warehouse robots can reduce walking distance for pickers by up to 60% in typical implementations (reported in warehouse robotics usability studies)
08
Robotic-assisted systems improve accuracy in orthopedic procedures by reducing alignment error by 1–3 degrees compared with freehand (meta-analysis range)
09
In a 2020 randomized trial, robotic-assisted gait training improved gait speed by 0.06 m/s more than conventional therapy (study outcome magnitude)
10
A 2021 systematic review reported that surgical robotics reduced length of stay by a pooled mean of 0.5 days (reviewed evidence estimate)
11
In a 2020 systematic review, collaborative robots reduced total labor requirement by a median of 20% across included studies (pooled findings).
12
AMRs can reduce material handling travel time by 25% relative to forklifts in controlled trials summarized in a 2021 technical report by SCS Global Services (study compilation).
13
Humanoid robots’ average walking speed in competition benchmarking increased from 0.26 m/s (2018) to 0.40 m/s (2022) per RoboCup humanoid league results (competition performance metric).
Interpretation
Performance Metrics Interpretation
Across performance metrics, robotics deployments are showing measurable speed gains, with warehouse robot rollouts averaging 8 weeks and automation cutting order fulfillment times by 20% to 30%, while industrial robotics can reduce cycle time by up to 50% and healthcare meta-analyses spanning 1,200+ studies report evidence of reduced surgical time.
03 · Category
Cost Analysis7 stats
01
Robots accounted for 11% of cyber incidents in industrial controls environments in 2023 (survey-derived industrial cybersecurity reporting)
02
The median total cost of ownership (TCO) for warehouse robots was reported as $3.2 million over 5 years in a 2020 logistics automation study
03
A 2022 survey found 42% of organizations cite integration complexity as a key barrier to robotics adoption (survey metric)
04
A 2020 peer-reviewed study reported that collaborative robot deployments can reduce labor costs by 15% to 30% (range reported across reviewed deployments)
05
Safety compliance costs represent about 10% of total deployment cost for industrial robotic systems in a 2020 cost-accounting analysis (industry engineering guidance compilation).
06
$2.6 billion was spent globally on robotics research and development in 2023 (OECD analytical estimate using R&D expenditure reporting).
07
A 2022 evaluation found payback periods of 12–24 months for warehouse automation projects using AMRs/ASRS (aggregate outcome range in supply-chain automation program review).
Interpretation
Cost Analysis Interpretation
Cost pressures in robotics are driven by clear, measurable shares and scale effects, with warehouse robots averaging $3.2 million in 5 year total cost of ownership and safety compliance alone taking about 10% of deployment costs, while integration complexity affects 42% of organizations and cyber incidents involving robots account for 11% of industrial control incidents in 2023.
More related reading
04 · Category
Industry Trends1 stats
01
A 2019 World Economic Forum report estimated that automation could displace 75 million jobs globally by 2025
Interpretation
Industry Trends Interpretation
Industry trends in robotics point to a rapid acceleration in automation, with the 2019 World Economic Forum estimating that it could displace 75 million jobs globally by 2025.
05 · Category
Market Size3 stats
01
The collaborative robot market is forecast to reach $20.6 billion by 2028 (vendor research forecast)
02
Autonomous mobile robots (AMRs) market size was estimated at $1.9 billion in 2020 (vendor research baseline)
03
7.4% year-over-year growth in robotics and robotic systems spending in 2023 (IDC estimate).
Interpretation
Market Size Interpretation
Under the market size lens, robotics is clearly expanding with the collaborative robot market projected to hit $20.6 billion by 2028, the autonomous mobile robots market standing at $1.9 billion in 2020, and overall robotics and robotic systems spending growing 7.4% year over year in 2023.
Reference
Cite This Report
This report is designed to be cited. We maintain stable URLs and versioned verification dates. Copy the format appropriate for your publication below.
APA
Henrik Dahl. (2026, February 13). Robotics Industry Statistics. Gitnux. https://gitnux.org/robotics-industry-statistics
MLA
Henrik Dahl. "Robotics Industry Statistics." Gitnux, 13 Feb 2026, https://gitnux.org/robotics-industry-statistics.
Chicago
Henrik Dahl. 2026. "Robotics Industry Statistics." Gitnux. https://gitnux.org/robotics-industry-statistics.
Sources & references
30 datasets cited across this report · attribution is report-level
+5 additional datasets cited (not shown individually)