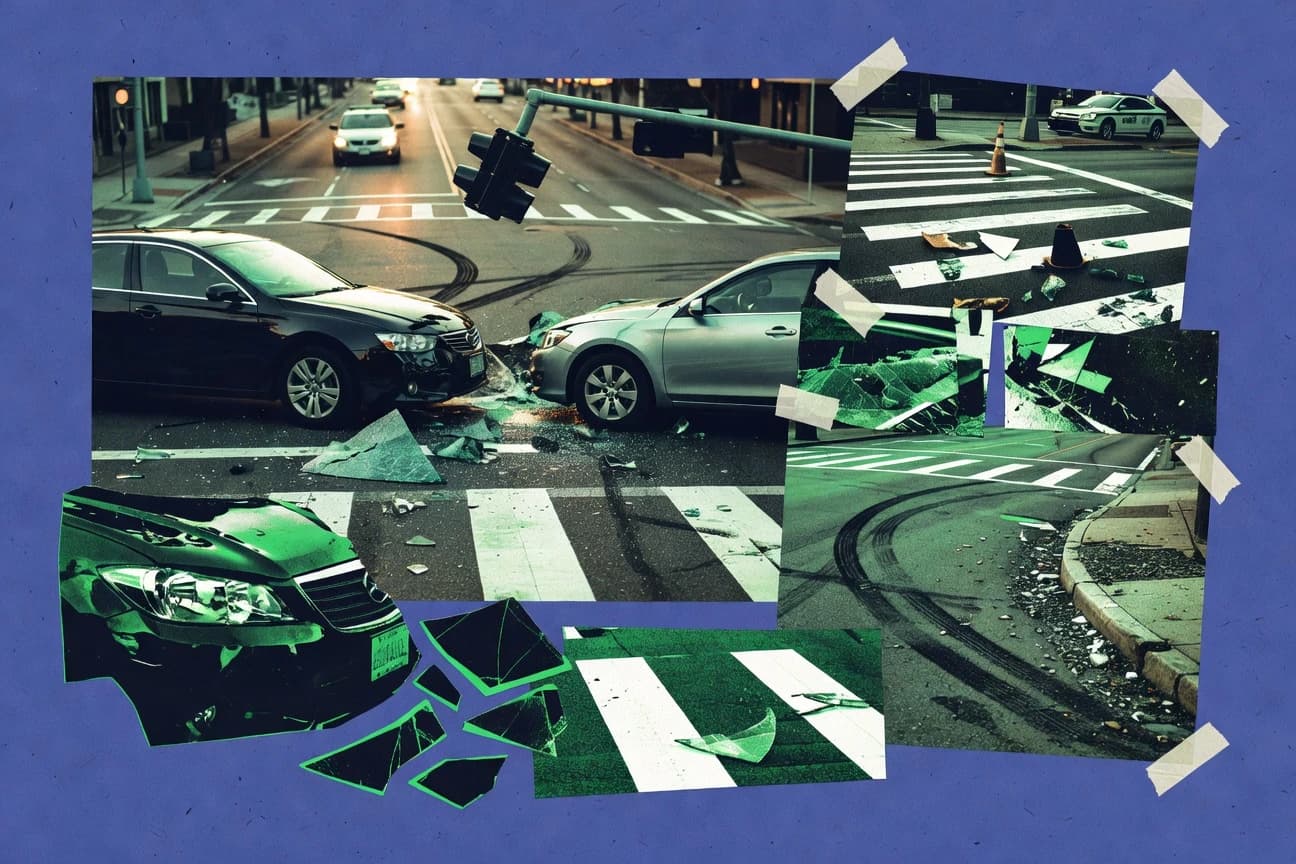

Intersection crashes account for 40 percent of all reported crashes. Driver inattention causes 38 percent of those at intersections. The data break down the leading factors along with injury and fatality patterns by time, location, and vehicle type.
Key Takeaways
- Driver inattention causes 38% of intersection crashes
- In 2021, approximately 688,000 police-reported crashes occurred at signalized intersections in the United States
- 7,000 fatal intersection crashes in 2021 US
- 55% of crashes Friday 3-6pm at urban intersections
- Urban arterials: 45% passenger cars in fatal intersections
Intersection accidents are alarmingly common, so improving signal timing and driver awareness can save lives.
Related reading
01 · Category
Causal Factors26 stats
01
Driver inattention causes 38% of intersection crashes
02
Red-light running led to 1,000 fatal intersection crashes in 2021
03
Failure to yield right-of-way: 25% of intersection collisions
04
Speeding contributes to 29% of fatal intersection crashes
05
Alcohol impairment in 24% of nighttime intersection fatalities
06
Illegal left turns cause 15% of signalized intersection crashes
07
Distracted driving: 18% of all intersection injuries
08
22% of intersection crashes due to running stop signs
09
Head-on collisions at intersections: 12% caused by wrong-way driving
10
Poor visibility accounts for 14% of unsignalized intersection crashes
11
Aggressive driving behaviors in 31% of urban intersection crashes
12
Fatigue-related: 8% of intersection fatal crashes
13
Motorcycle-specific: lane splitting causes 20% intersection crashes
14
Pedestrian violations: 35% of intersection pedestrian crashes
15
Commercial vehicle blind spots: 16% of truck intersection crashes
16
Weather-related slippery roads: 11% of winter intersection collisions
17
Signal timing errors contribute to 9% of signalized crashes
18
Bicycle hook turns: 25% of bike-motorist intersection conflicts
19
Senior drivers: higher right-of-way errors at 17%
20
Teen drivers: 40% higher red-light running rate at intersections
21
Overloaded intersections: traffic volume causes 13% crashes
22
Phone use: 27% of observed intersection violations
23
Construction zones at intersections: 19% crash increase
24
Left-turning vehicles: 28% of broadside intersection impacts
25
Nighttime glare from headlights: 10% of intersection misjudgments
26
Unmarked crosswalks: 21% pedestrian crash cause
Interpretation
Causal Factors Interpretation
Reading these chilling statistics, it becomes painfully clear that when we approach an intersection, our greatest threat isn't the other driver—it's our own human error, impatience, and inattention.
02 · Category
Incidence Rates30 stats
01
In 2021, approximately 688,000 police-reported crashes occurred at signalized intersections in the United States
02
Between 2018 and 2020, unsignalized intersections accounted for 18.6% of all intersection-related fatal crashes nationwide
03
In urban areas, 52% of all vehicle crashes happen at or near intersections
04
During 2022, there were over 1.2 million intersection crashes reported in California alone
05
Nationally, intersection crashes represent about 40% of all reported crashes annually
06
In 2019, rural unsignalized intersections saw 12,000 injury crashes
07
Signalized intersections in the US experienced 2.6 million crashes from 2017-2019
08
Texas reported 145,000 intersection-related crashes in 2021
09
From 2015-2019, 23% of fatal crashes involved intersections
10
New York City intersections had 120,000 crashes in 2022
11
Florida's intersection crashes totaled 250,000 in 2020
12
In 2021, 1.1 million injury crashes at intersections occurred US-wide
13
Midwest states saw 15% higher intersection crash rates per capita
14
2022 data shows 700,000 property-damage-only intersection crashes
15
Urban signalized intersections: 1 crash every 83,000 vehicles entering
16
28% of all fatal crashes in 2020 were at intersections
17
Pennsylvania reported 90,000 intersection crashes in 2021
18
National average: 2.3 intersection crashes per million VMT
19
2018-2022 trend: 5% annual increase in intersection crashes
20
Ohio intersections: 110,000 crashes yearly average
21
35% of pedestrian crashes at intersections
22
Georgia 2021: 85,000 intersection-involved crashes
23
Intersection crashes cost $208 billion annually in US
24
2023 preliminary: 750,000 signalized intersection crashes
25
Michigan: 75,000 intersection crashes in 2022
26
42% of urban crashes at intersections per IIHS
27
Illinois 2021: 130,000 intersection crashes
28
National: 1.5 million non-fatal injury crashes at intersections yearly
29
Virginia: 60,000 intersection crashes in 2020
30
19% of all crashes are intersection-related per NHTSA 2022
Interpretation
Incidence Rates Interpretation
The shocking truth is that our national pastime is apparently a reckless, multi-billion dollar game of chicken played at every stoplight and country crossroads, where the odds of a crash are so high you'd think we were aiming for them.
03 · Category
Injury and Fatality Statistics29 stats
01
7,000 fatal intersection crashes in 2021 US
02
Intersection fatalities: 22% of total road deaths annually
03
450,000 serious injuries from intersection crashes yearly
04
Pedestrian deaths at intersections: 60% of all pedestrian fatalities
05
Bicyclist fatalities: 35% at intersections
06
2022: 6,800 intersection-related fatalities
07
Males account for 71% of intersection crash deaths
08
Average injury cost per intersection crash: $45,000
09
Fatalities peak at 2pm-5pm: 28% of daily total
10
Elderly (65+): 25% higher fatality rate per crash
11
Children under 15: 15% of intersection pedestrian injuries
12
1.2 million incapacitating injuries from intersections 2017-2019
13
Motorcycle riders: 40% fatality rate in intersection crashes
14
Truck occupants: lower injury rates but 10% fatalities
15
Dark conditions: 55% of intersection fatalities occur
16
Head injuries: 32% of severe intersection trauma cases
17
2021: 828,000 hospitalized from intersection injuries
18
Females: 20% higher whiplash injuries at intersections
19
Rural intersections: higher fatality per crash rate by 15%
20
Alcohol-related intersection deaths: 30% of total
21
75% of intersection fatalities involve frontal impacts
22
Quadriplegia: 5% of severe intersection crash outcomes
23
2019: 6,300 intersection fatalities
24
Amputations: 2% of intersection injury severities
25
Passenger vehicles: 90% of intersection fatalities
26
Intersection crashes: 2.5x higher injury probability vs non-intersections
27
SUVs rollovers at intersections: 12% fatal
28
65% of intersection deaths in vehicles without airbags deployed
29
Traumatic amputations higher in side-impact intersections by 18%
Interpretation
Injury and Fatality Statistics Interpretation
Intersections are the carnivorous crossroads of our roadways, devouring lives at a rate where the simple act of turning left or walking across the street becomes a statistically significant gamble.
More related reading
04 · Category
Temporal Patterns20 stats
01
55% of crashes Friday 3-6pm at urban intersections
02
Nighttime (6pm-6am): 50% of intersection fatalities
03
Winter months: 20% increase in intersection crashes due to ice
04
Rush hour (7-9am): 25% of daily intersection injuries
05
Weekends: 15% higher alcohol-related intersection crashes
06
Summer: peak pedestrian intersection deaths at 28%
07
Dawn/dusk: 3x fatality rate per mile driven at intersections
08
Holidays (Thanksgiving): 40% crash spike at intersections
09
School start/end times: 4x child pedestrian risk
10
Fridays: highest red-light running incidents at 22%
11
Rainy days: 70% more hydroplaning intersection crashes
12
Midnight-3am: 35% of DUI intersection fatalities
13
Spring: 18% rise in motorcycle intersection crashes
14
Evenings (5-8pm): 30% broadside collision peak
15
Mondays: post-weekend fatigue causes 12% more crashes
16
Foggy mornings: visibility crashes up 25%
17
Year-end holidays: 50% fatality increase Dec 23-31
18
Lunch hours (12-2pm): 20% minor intersection fender-benders
19
Autumn: leaf-obscured signs cause 14% stop failures
20
Late nights (10pm-2am Sat): young driver crashes peak 45%
Interpretation
Temporal Patterns Interpretation
Our cities become veritable gauntlets of poor timing and poor choices, where rush hour’s predictable chaos bleeds into a night of heightened risk, proving that the most dangerous part of your commute might be the simple, tragic act of meeting another person's path at the wrong time.
05 · Category
Vehicle and Road Types24 stats
01
Urban arterials: 45% passenger cars in fatal intersections
02
Rural roads: 60% fatal crashes at unsignalized intersections
03
Four-legged intersections: 75% of all intersection crashes
04
Highway-arterial intersections: 20% higher crash rates
05
Passenger cars: 82% involved in intersection crashes
06
Light trucks/SUVs: 28% of fatal intersection involvements
07
Motorcycles: 5% of vehicles but 14% fatalities at intersections
08
Heavy trucks: 4% of crashes but 9% injury severity
09
Roundabouts reduce severe crashes by 80% vs signalized
10
T-intersections: 2x higher angle crash risk
11
Multi-vehicle arterials: 35% left-turn crashes
12
Low-volume rural roads: 40% stop-controlled crashes
13
Electric vehicles: quieter operation increases pedestrian risk 19%
14
Autonomous vehicles: 90% fewer intersection errors in tests
15
School zone intersections: 3x pedestrian crash rate
16
Divided highways intersections: lower head-on by 70%
17
Vans/minivans: higher side-swipe rates at 22%
18
Y-intersections: unusual geometry causes 15% more crashes
19
Commercial arterials: truck-passenger car crashes 25%
20
Offset left-turn lanes: reduce crashes by 30%
21
Two-way stop-controlled: 50% failure-to-yield crashes
22
High-speed rural intersections: 3x fatality risk
23
Bike lanes at intersections: 40% conflict reduction
24
Channelized right turns: 65% fewer conflicts
Interpretation
Vehicle and Road Types Interpretation
The data paints a stark picture: while our roads are a chaotic ballet of cars, trucks, and vulnerable users making predictable mistakes at predictable places, the sobering truth is that simple, proven designs like roundabouts and better lanes could dramatically rewrite this tragic script.
Reference
Cite This Report
This report is designed to be cited. We maintain stable URLs and versioned verification dates. Copy the format appropriate for your publication below.
APA
Priya Chandrasekaran. (2026, February 13). Intersection Accident Statistics. Gitnux. https://gitnux.org/intersection-accident-statistics
MLA
Priya Chandrasekaran. "Intersection Accident Statistics." Gitnux, 13 Feb 2026, https://gitnux.org/intersection-accident-statistics.
Chicago
Priya Chandrasekaran. 2026. "Intersection Accident Statistics." Gitnux. https://gitnux.org/intersection-accident-statistics.
Sources & references
19 datasets cited across this report · attribution is report-level