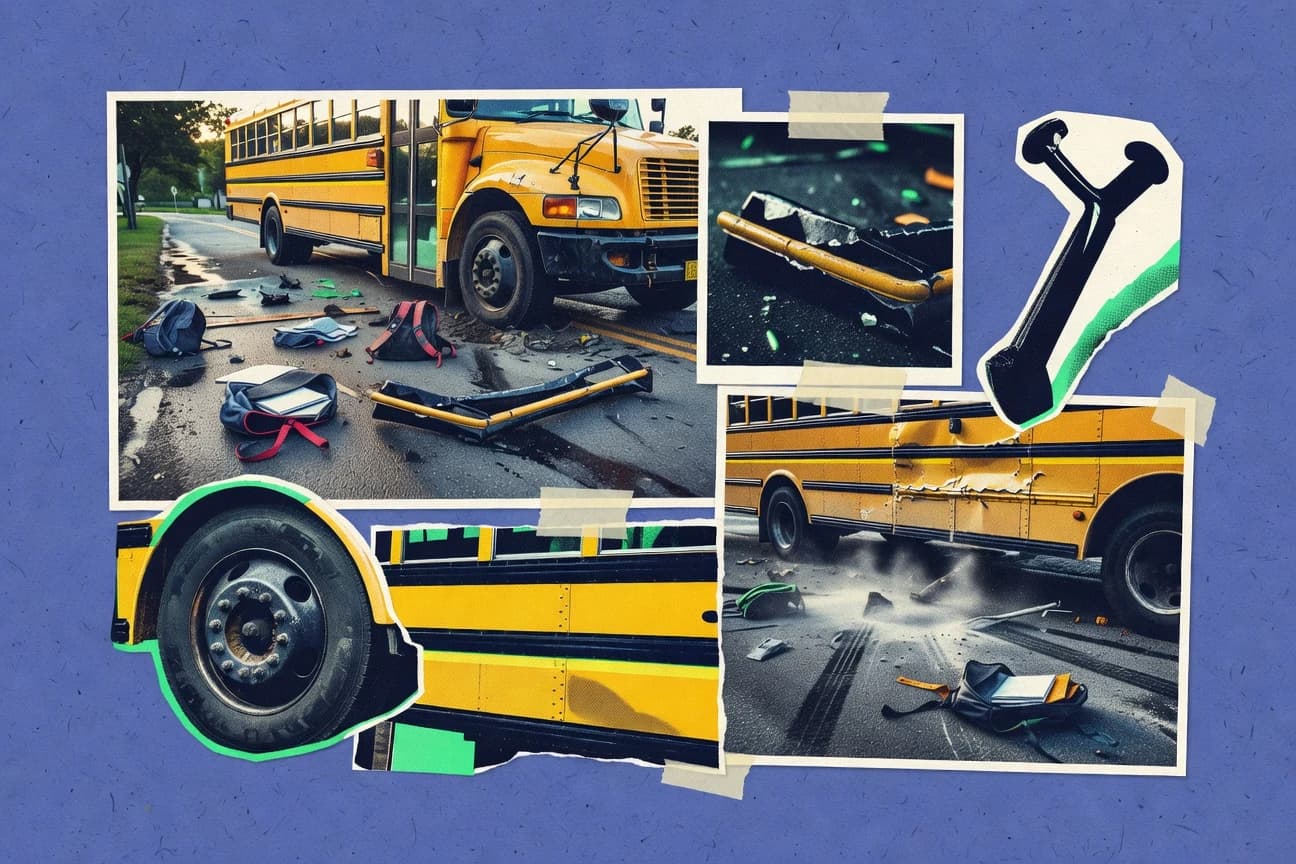

Every year in the U.S., 2,000+ school buses are involved in crashes, yet most people never see the patterns that follow those moments. The latest federal and national safety sources connect enforcement, warning visibility, and driver readiness with how crashes develop and how fatal outcomes change over time. We will look at what the stop arm and camera systems are designed to prevent, what past recommendations shaped, and which risk factors still show up in the data.
Key Takeaways
- 2,000+ school buses are involved in crashes each year in the U.S., per 2019–2022 national estimates compiled by the National Safety Council
- In 2022, there were 4,049 fatalities in crashes involving large trucks and buses on roadways, per NHTSA’s traffic safety facts supporting analysis of large bus crash context
- In 2019, crashes involving large trucks and buses accounted for 9.5% of all traffic fatalities in the U.S., per NHTSA Traffic Safety Facts
- School bus stop-arm enforcement and camera systems are intended to improve driver compliance; deployment models are discussed in the NHTSA/BTS safety literature on school bus risk reduction
- The NTSB reports that enhanced flashing amber lights on stop arms and improved visibility can reduce the risk of vehicles failing to stop; modernization efforts are discussed in the NTSB safety report on school bus stop arm warnings
- In 1998, the National Transportation Safety Board (NTSB) recommended improvements that became part of later school bus stop-arm/enforcement and visibility measures, including calls for enhanced warning to drivers
- 49 CFR Part 382 requires controlled substance and alcohol testing for covered drivers in regulated motor carrier operations that include school-related transport under certain conditions, influencing compliance for driver readiness
- 49 CFR Part 396 contains inspection, repair, and maintenance requirements for commercial motor vehicles, relevant to buses operated under FMCSA jurisdiction
- The U.S. Fatality Analysis Reporting System (FARS) contains 1982–present data, enabling multi-year trend analysis of fatal school-bus-related outcomes
- The MMUCC (Model Minimum Uniform Crash Criteria) provides standardized data elements for crash reporting used by states and adopted in many systems to measure crash characteristics such as bus involvement and contributing factors
- In a National Highway Traffic Safety Administration analysis, driver distraction is linked to reduced hazard perception, a mechanism relevant to late stopping for buses; NHTSA quantified distracted-driving prevalence in fatal crashes
- In the U.S., about 31% of pedestrian fatalities occur in the hours of 6 pm–8:59 pm, per NHTSA pedestrian fatality timing distributions
- In the U.S., about 23% of drivers aged 20–24 who were fatally injured in crashes had alcohol involvement, based on NHTSA fatality analyses
- An analysis cited by the U.S. Government Accountability Office reported 351 school bus related deaths annually in the U.S. (estimate used in GAO’s school bus safety review)
- 11% of K–12 students in the U.S. ride school bus (public or private) at least some days, per Education data reported by the National Center for Education Statistics (NCES) School Bus Transportation survey analysis materials
Thousands of school bus crashes persist yearly, but stop arm enforcement and visibility upgrades can meaningfully reduce violations.
Related reading
01 · Category
Fatality And Injury Rates3 stats
01
2,000+ school buses are involved in crashes each year in the U.S., per 2019–2022 national estimates compiled by the National Safety Council
02
In 2022, there were 4,049 fatalities in crashes involving large trucks and buses on roadways, per NHTSA’s traffic safety facts supporting analysis of large bus crash context
03
In 2019, crashes involving large trucks and buses accounted for 9.5% of all traffic fatalities in the U.S., per NHTSA Traffic Safety Facts
Interpretation
Fatality And Injury Rates Interpretation
Although 2,000 plus school buses are involved in crashes each year in the U.S., the broader roadway context shows how serious large truck and bus incidents can be, with 4,049 fatalities in 2022 and large trucks and buses contributing 9.5% of all traffic deaths in 2019, underscoring the Fatality And Injury Rates stakes.
02 · Category
Countermeasures And Technologies2 stats
01
School bus stop-arm enforcement and camera systems are intended to improve driver compliance; deployment models are discussed in the NHTSA/BTS safety literature on school bus risk reduction
02
The NTSB reports that enhanced flashing amber lights on stop arms and improved visibility can reduce the risk of vehicles failing to stop; modernization efforts are discussed in the NTSB safety report on school bus stop arm warnings
Interpretation
Countermeasures And Technologies Interpretation
Across NHTSA and NTSB safety literature, the emphasis on technology like stop arm enforcement cameras and enhanced flashing amber lights shows a clear trend toward reducing school bus stop violations through improved visibility and driver compliance.
03 · Category
Regulatory And Compliance4 stats
01
In 1998, the National Transportation Safety Board (NTSB) recommended improvements that became part of later school bus stop-arm/enforcement and visibility measures, including calls for enhanced warning to drivers
02
49 CFR Part 382 requires controlled substance and alcohol testing for covered drivers in regulated motor carrier operations that include school-related transport under certain conditions, influencing compliance for driver readiness
03
49 CFR Part 396 contains inspection, repair, and maintenance requirements for commercial motor vehicles, relevant to buses operated under FMCSA jurisdiction
04
49 CFR Part 390 outlines general responsibilities for motor carrier safety, including operational practices that can reduce crash risk
Interpretation
Regulatory And Compliance Interpretation
From 1998 onward, regulatory compliance for school bus safety has increasingly been shaped by NTSB-driven visibility and warning guidance and reinforced by requirements like 49 CFR Parts 382 and 396, with the three-part federal focus on testing covered drivers and ensuring ongoing inspection and maintenance under 49 CFR Part 390 working together to reduce crash risk.
04 · Category
Data Sources And Measurement2 stats
01
The U.S. Fatality Analysis Reporting System (FARS) contains 1982–present data, enabling multi-year trend analysis of fatal school-bus-related outcomes
02
The MMUCC (Model Minimum Uniform Crash Criteria) provides standardized data elements for crash reporting used by states and adopted in many systems to measure crash characteristics such as bus involvement and contributing factors
Interpretation
Data Sources And Measurement Interpretation
Because FARS covers 1982 to the present, it enables long-term multi-year tracking of fatal school bus outcomes, while MMUCC’s standardized crash-reporting criteria help states consistently measure key bus involvement and contributing factors.
05 · Category
Contributing Factors3 stats
01
In a National Highway Traffic Safety Administration analysis, driver distraction is linked to reduced hazard perception, a mechanism relevant to late stopping for buses; NHTSA quantified distracted-driving prevalence in fatal crashes
02
In the U.S., about 31% of pedestrian fatalities occur in the hours of 6 pm–8:59 pm, per NHTSA pedestrian fatality timing distributions
03
In the U.S., about 23% of drivers aged 20–24 who were fatally injured in crashes had alcohol involvement, based on NHTSA fatality analyses
Interpretation
Contributing Factors Interpretation
Contributing factors in school bus related contexts stand out because driver distraction can undermine hazard perception and contribute to late stopping patterns, while broader road safety data show 31% of pedestrian fatalities happen between 6 pm and 8:59 pm and 23% of fatally injured drivers aged 20 to 24 involve alcohol, pointing to time-of-day risk and impaired or distracted behavior as key contributors.
More related reading
06 · Category
Fatalities And Injuries1 stats
01
An analysis cited by the U.S. Government Accountability Office reported 351 school bus related deaths annually in the U.S. (estimate used in GAO’s school bus safety review)
Interpretation
Fatalities And Injuries Interpretation
Under the Fatalities And Injuries lens, the GAO estimated that U.S. school bus crashes lead to about 351 deaths each year, underscoring how persistent the human toll is despite safety efforts.
07 · Category
Exposure And Risk3 stats
01
11% of K–12 students in the U.S. ride school bus (public or private) at least some days, per Education data reported by the National Center for Education Statistics (NCES) School Bus Transportation survey analysis materials
02
The American Academy of Pediatrics (AAP) notes that school bus travel is the safest form of motorized student transportation, with injuries and deaths occurring far less frequently than with private vehicles; the AAP cites a relative risk reduction measured in published epidemiologic comparisons
03
In a 2013–2017 observational study of school bus stop locations, 23% of sampled stop-arm activations were recorded with either insufficient visibility or incomplete arm extension (operationally coded); results published in a transportation safety conference paper
Interpretation
Exposure And Risk Interpretation
Because 11% of U.S. K–12 students ride school buses at least some days, the overall safety advantage noted by the American Academy of Pediatrics matters, yet the 23% of stop-arm activations with insufficient visibility or incomplete extension in a 2013–2017 study shows that exposure still intersects with real-world risk at key points.
08 · Category
Behavior And Compliance3 stats
01
In a study of speed management near bus stops, average vehicle speed within the stop-arm notice zone decreased by 4–7 mph after adoption of enhanced signage and flashing beacons, as reported in a peer-reviewed work on traffic control strategies near school bus stops
02
A 2020 peer-reviewed evaluation of school-bus stop-arm enforcement reported a 34% reduction in stop-arm violations at treated corridors relative to control sites (difference-in-differences estimate)
03
In a 2018 peer-reviewed study of driver gap acceptance behavior around school bus stops, the probability of passing during warning-arm activation dropped by 0.28 (from 0.41 to 0.13) after enhanced flashing amber light installations
Interpretation
Behavior And Compliance Interpretation
Across behavior and compliance outcomes, drivers showed clear restraint at school bus stops after enforcement and signal upgrades, with stop arm violations down 34% and the chance of passing during warning arm activation dropping from 0.41 to 0.13, while vehicles also slowed by 4 to 7 mph in the notice zone.
09 · Category
Technology And Standards1 stats
01
The National Cooperative Highway Research Program (NCHRP) Report 800: Volume 8 states that implementing median treatments and improved delineation can reduce rear-end crash frequencies by about 20% for roadway segments with clear guidance, relevant to near-bus-roadway crash mitigation
Interpretation
Technology And Standards Interpretation
NCHRP Report 800 Volume 8 shows that using technology and standards like median treatments and improved delineation can cut rear end crash frequencies by about 20%, offering a clear, data driven mitigation path for near bus roadway safety.
10 · Category
Cost And Funding1 stats
01
A 2018 meta-analysis of electronic stability control (ESC) across vehicle classes found an average reduction of 56% in rollover risk for vehicles where ESC is installed, informing bus safety tech adoption rationales
Interpretation
Cost And Funding Interpretation
A 2018 meta-analysis found ESC reduces rollover risk by 56%, suggesting that investing in proven safety technology for school buses can be a cost and funding priority because the payoff in risk reduction is substantial.
Reference
Cite This Report
This report is designed to be cited. We maintain stable URLs and versioned verification dates. Copy the format appropriate for your publication below.
APA
Henrik Dahl. (2026, February 13). School Bus Accident Statistics. Gitnux. https://gitnux.org/school-bus-accident-statistics
MLA
Henrik Dahl. "School Bus Accident Statistics." Gitnux, 13 Feb 2026, https://gitnux.org/school-bus-accident-statistics.
Chicago
Henrik Dahl. 2026. "School Bus Accident Statistics." Gitnux. https://gitnux.org/school-bus-accident-statistics.
Sources & references
23 datasets cited across this report · attribution is report-level
+11 additional datasets cited (not shown individually)