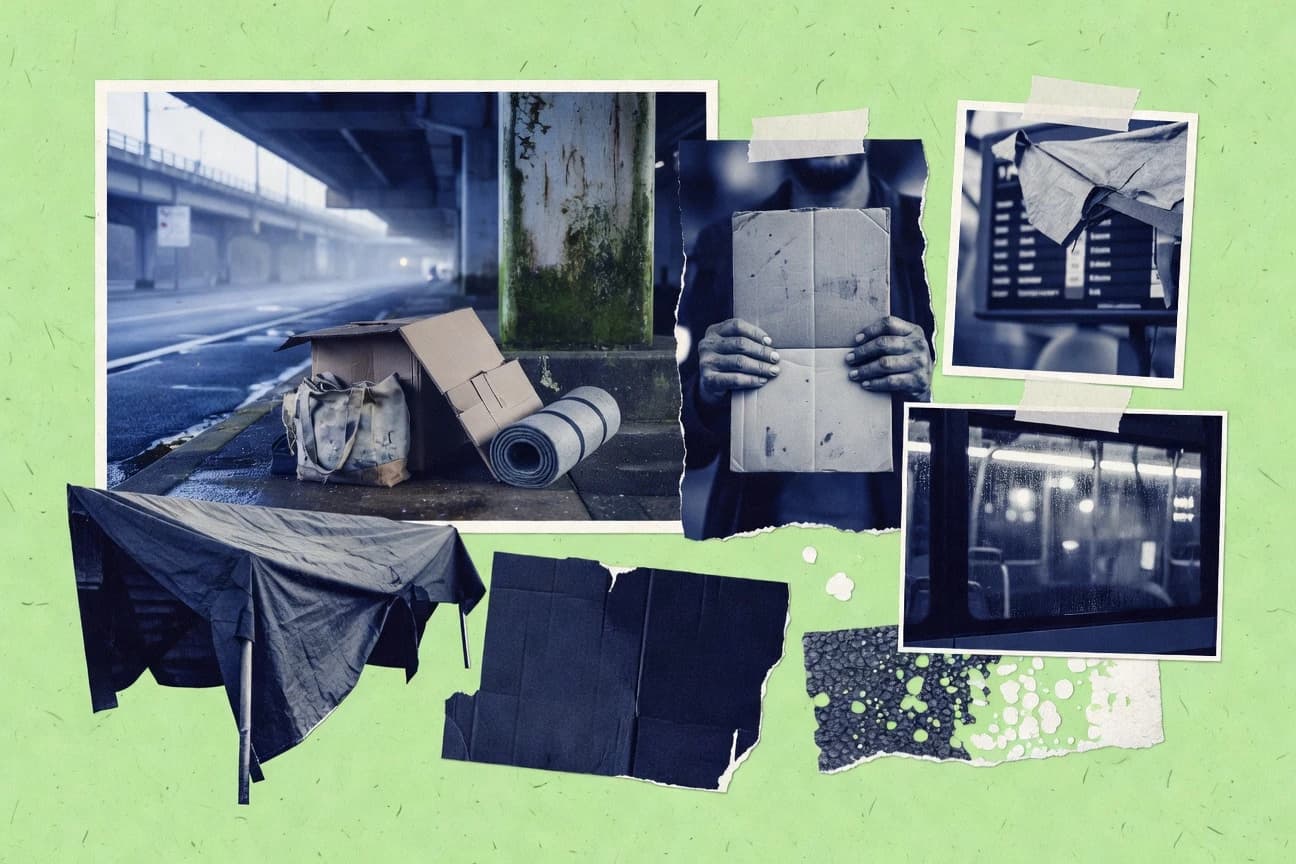

On Census night 2021, 122,494 people in Australia were experiencing homelessness, yet Specialist Homelessness Services still assisted 277,000 clients in 2021 to 22, showing how quickly risk spreads beyond what a single night can capture. Behind the headline counts are sharply different pressures like housing affordability, domestic and family violence, mental health, and job loss, all interacting in ways that leave some groups far more exposed than others. This post pulls together the most telling figures to explain what is driving homelessness across Australia and why the pattern keeps shifting.
Key Takeaways
- Family and domestic violence was the main reason for seeking SHS assistance for 43% of clients in 2021-22.
- Housing affordability crises led to 23% of homelessness cases reported by SHS in 2022.
- Mental health disorders affect 44% of homeless individuals in Australia, per 2022 studies.
- 41% of SHS clients in 2021-22 were female, often fleeing violence.
- Children under 10 made up 17% of homeless population in 2021 Census.
- Aboriginal and Torres Strait Islander people comprised 24% of SHS clients despite 3.8% population share.
- On Census night 2021, 122,494 people (0.49% of the total population) experienced homelessness in Australia, including those without a fixed place to stay, in improvised dwellings, or severely crowded housing.
- In 2021-22, Specialist Homelessness Services (SHS) assisted 277,000 clients who were homeless or at risk of homelessness.
- The rate of homelessness in Australia was 48 per 10,000 people in 2021, down slightly from 47 per 10,000 in 2016.
- In 2021-22, SHS agencies provided 1.2 million nights of accommodation to clients.
- Only 31% of SHS clients needing accommodation were provided with it in 2021-22.
- Commonwealth Rent Assistance helps 1.5 million low-income households but excludes many homeless.
- Rough sleeping counts in Melbourne reached 1,000 nightly in 2022.
- National homelessness numbers rose 5.2% from 2016 to 2021 per Census.
- SHS demand increased 23% since 2016, driven by housing costs.
Family violence and housing affordability drive most homelessness, with mental illness and unemployment trapping many Australians.
Related reading
01 · Category
Causes26 stats
01
Family and domestic violence was the main reason for seeking SHS assistance for 43% of clients in 2021-22.
02
Housing affordability crises led to 23% of homelessness cases reported by SHS in 2022.
03
Mental health disorders affect 44% of homeless individuals in Australia, per 2022 studies.
04
Substance use disorders contribute to 34% of long-term homelessness cases.
05
Unemployment rates among homeless people are 5 times higher than the national average at 45%.
06
Domestic violence drives 70% of female homelessness according to Salvation Army reports.
07
28% of youth homelessness stems from family breakdown and conflict.
08
Financial difficulties and eviction account for 31% of first-time homelessness entries.
09
Indigenous overrepresentation in homelessness is linked to 40% child removal experiences.
10
Gambling addiction contributes to 15% of homelessness among males aged 25-44.
11
Lack of affordable housing has increased homelessness by 20% since 2016 per ABS data.
12
Relationship/family breakdown causes 39% of SHS presentations annually.
13
26% of homeless people have experienced institutional care like foster homes.
14
Drug and alcohol issues are primary for 23% of rough sleepers in urban areas.
15
Incarceration history affects 17% of the homeless population.
16
Poor physical health leads to 12% of homelessness triggers per SHS data.
17
Migration status contributes to 8% of homelessness among recent arrivals.
18
Natural disasters exacerbate homelessness, with 5% increase post-2022 floods in QLD/NSW.
19
50% of chronic homelessness is tied to complex trauma histories.
20
Economic downturns like COVID-19 increased job loss-related homelessness by 15%.
21
22% of single parent families entering homelessness cite income insufficiency.
22
Veterans experience homelessness at rates 3 times higher due to PTSD.
23
18% of homelessness linked to childhood abuse experiences.
24
Rising rents (up 10% yearly) force 20% into homelessness in capital cities.
25
Females aged 25-34 face 2.5 times higher homelessness risk post-DV.
26
35% of Indigenous homelessness tied to intergenerational trauma.
Interpretation
Causes Interpretation
Australia's homelessness crisis is a grim house of cards where domestic violence, housing unaffordability, mental health, and systemic failures are the load-bearing walls, each collapsing onto the other to trap people in a cycle from which it is notoriously difficult to escape.
02 · Category
Demographics23 stats
01
41% of SHS clients in 2021-22 were female, often fleeing violence.
02
Children under 10 made up 17% of homeless population in 2021 Census.
03
Aboriginal and Torres Strait Islander people comprised 24% of SHS clients despite 3.8% population share.
04
Youth (15-24) represented 21% of SHS clients in 2021-22.
05
Males aged 35-44 were the largest male homeless group at 18% in 2021.
06
12% of homeless people identified as having a disability in SHS data 2022.
07
Single adults without children formed 44% of the homeless demographic in 2021.
08
Couples with dependent children were 9% of homeless households.
09
26% of homeless were born in Australia, non-Indigenous in 2021 Census.
10
LGBTQIA+ individuals face 3-4 times higher homelessness risk, comprising 5-10% of cases.
11
Older women over 55 are the fastest-growing homeless group, up 30% since 2016.
12
37% of SHS clients had three or more needs, indicating complex demographics.
13
Unaccompanied minors (under 18) were 4% of SHS clients.
14
15% of homeless population spoke a non-English language at home.
15
Single mothers with children under 5 were 11% of family homelessness.
16
Veterans make up 2% of homeless but have specific profile with military background.
17
28% of homeless had not completed Year 12 education.
18
Rough sleepers are 70% male, per urban counts in 2022.
19
Indigenous females aged 25-34 have highest rate at 800 per 10,000.
20
6% of homeless identified as having intellectual disability.
21
Migrants from Asia comprised 10% of CALD homeless groups.
22
19% of homeless were in the labour force but still homeless.
23
Pregnancy-related homelessness affected 7% of female clients.
Interpretation
Demographics Interpretation
The statistics paint a bleak, multifaceted portrait: from children and single mothers fleeing violence to overrepresented Indigenous communities and a surge in older women, homelessness in Australia is less a single crisis and more a series of systemic failures crashing upon the shores of its most vulnerable citizens.
03 · Category
Prevalence29 stats
01
On Census night 2021, 122,494 people (0.49% of the total population) experienced homelessness in Australia, including those without a fixed place to stay, in improvised dwellings, or severely crowded housing.
02
In 2021-22, Specialist Homelessness Services (SHS) assisted 277,000 clients who were homeless or at risk of homelessness.
03
The rate of homelessness in Australia was 48 per 10,000 people in 2021, down slightly from 47 per 10,000 in 2016.
04
Approximately 25% of homeless people in Australia were living in improvised dwellings, tents, or sleeping out on Census night 2021.
05
In major cities like Sydney, the homelessness rate was 38 per 10,000 in 2021, compared to the national average.
06
Victoria had 28,800 homeless people on Census night 2021, the highest number among states.
07
New South Wales recorded 37,300 homeless individuals in the 2021 Census.
08
Queensland's homelessness count was 21,600 people in 2021, representing 0.41% of its population.
09
Western Australia had a homelessness rate of 59 per 10,000, higher than the national average in 2021.
10
The Northern Territory had the highest rate at 557 per 10,000 people experiencing homelessness in 2021.
11
Tasmania saw 1,800 homeless people on Census night 2021, a rate of 33 per 10,000.
12
South Australia had 7,200 homeless individuals, or 40 per 10,000 in 2021 Census data.
13
In 2021-22, 37% of SHS clients were children under 18 experiencing homelessness.
14
Over 280,000 people accessed SHS for homelessness issues in 2022, marking a 10% increase from pre-COVID levels.
15
Rough sleeping accounted for 7% of all homelessness cases in the 2021 Census.
16
74,000 people were in temporary accommodation as part of homelessness in 2021.
17
Supported accommodation for homeless people housed 15,000 on Census night 2021.
18
41,000 people were in severely crowded dwellings classified as homeless in 2021.
19
17,000 individuals were in short-term accommodation for homelessness reasons in 2021 Census.
20
Homelessness in Australia costs the economy $45.6 billion annually in health, justice, and lost productivity.
21
Indigenous Australians are 9 times more likely to experience homelessness than non-Indigenous, with rates of 386 per 10,000 in 2021.
22
Youth homelessness affected 19% of all SHS clients aged 15-24 in 2021-22.
23
Female homelessness rates reached 53 per 10,000 in 2021, surpassing males at 43 per 10,000.
24
45% of homeless people were aged 25-44 in the 2021 Census.
25
Males comprised 57% of the homeless population on Census night 2021.
26
8% of homeless individuals were aged 55 and over in 2021.
27
Aboriginal and Torres Strait Islander people made up 20% of the homeless population despite being 3.2% of the total population in 2021.
28
In 2021, 22% of homeless people were born overseas.
29
35% of SHS clients in 2021-22 had a current mental health issue contributing to homelessness.
Interpretation
Prevalence Interpretation
The numbers paint a stark, costly, and deeply unfair picture: while a slight overall dip offers a flicker of hope, the crisis is intensifying—evidenced by soaring demand for services, a shockingly disproportionate impact on Indigenous Australians and children, and the sobering fact that our most vulnerable are increasingly likely to be women sleeping rough or crammed into severely crowded homes.
More related reading
04 · Category
Services25 stats
01
In 2021-22, SHS agencies provided 1.2 million nights of accommodation to clients.
02
Only 31% of SHS clients needing accommodation were provided with it in 2021-22.
03
Commonwealth Rent Assistance helps 1.5 million low-income households but excludes many homeless.
04
National Housing and Homelessness Agreement funds $400 million annually for states.
05
Crisis accommodation beds number 12,000 nationwide, insufficient for demand.
06
Youth foyers provide transitional housing for 1,000 young people yearly.
07
Supported Independent Living (SIL) under NDIS aids 5,000 formerly homeless with disabilities.
08
Street to Home programs diverted 2,500 from rough sleeping in 2022.
09
Legal aid services assisted 15,000 homeless clients with tenancy issues in 2022.
10
Mental health support integrated in SHS reached 80,000 clients.
11
Rapid rehousing models housed 4,000 families post-DV in Victoria.
12
Salvation Army provided 500,000 meals to homeless in 2022.
13
Headspace services for youth mental health prevented 10% homelessness escalation.
14
Social housing stock is 450,000 units, but waitlist exceeds 170,000.
15
Assertive outreach teams engaged 8,000 rough sleepers in major cities.
16
Family violence hubs supported 20,000 escapes from homelessness risk.
17
NDIS plans for homeless participants increased 25% in 2022.
18
Private rentals with bonds assistance aided 50,000 low-income entries.
19
Drug and alcohol rehab programs transitioned 3,500 to housing.
20
Big Issue Australia employed 2,000 formerly homeless vendors.
21
Homelessness apps like AskIzzy connected 100,000 to services in 2022.
22
State-based winter appeal funds provided 1,000 extra beds seasonally.
23
Women’s refuges housed 25,000 nights for DV victims.
24
Job training programs for homeless achieved 60% employment retention.
25
Telehealth mental health for homeless expanded to 15,000 sessions.
Interpretation
Services Interpretation
Australia's homelessness efforts are a masterclass in tireless, piecemeal heroism, desperately trying to outrun a crisis that fundamentally outmatches them in scale and systemic roots.
05 · Category
Trends21 stats
01
Rough sleeping counts in Melbourne reached 1,000 nightly in 2022.
02
National homelessness numbers rose 5.2% from 2016 to 2021 per Census.
03
SHS demand increased 23% since 2016, driven by housing costs.
04
Rough sleeping up 28% in capital cities post-COVID lockdowns.
05
Indigenous homelessness rates stagnant at high levels since 2006.
06
Female homelessness grew 13% from 2016-2021 Census.
07
Youth homelessness presentations to SHS up 10% in 2021-22.
08
Chronic homelessness (over 12 months) affects 15% long-term.
09
Housing waitlists grew 40% since 2018 to 200,000.
10
Rental vacancy rates fell to 1%, correlating with 15% homelessness rise.
11
Older age homelessness projected to double by 2030.
12
Post-COVID evictions spiked 25% in SHS data 2022.
13
Regional homelessness up 8% vs urban 4% from 2016-21.
14
Mental health-related SHS needs rose 12% over five years.
15
DV-related homelessness increased 30% since 2016.
16
Social housing completions down 50% since 2012 peak.
17
Rough sleeping in Sydney up 20% year-on-year 2022.
18
Exit rates from SHS to housing dropped to 16% in 2022.
19
Pandemic relief reduced visible homelessness temporarily by 10%.
20
Projections estimate 150,000 homeless by 2025 without intervention.
21
NT homelessness rate declined 10% from 2016-2021.
Interpretation
Trends Interpretation
Australia's homelessness crisis has transformed from a tragic outlier into a stubbornly entrenched national feature, as the system's failures—from a brutal rental market to a gutted social housing pipeline—now systematically manufacture despair across every demographic.
Reference
Cite This Report
This report is designed to be cited. We maintain stable URLs and versioned verification dates. Copy the format appropriate for your publication below.
APA
Timothy Grant. (2026, February 13). Homelessness In Australia Statistics. Gitnux. https://gitnux.org/homelessness-in-australia-statistics
MLA
Timothy Grant. "Homelessness In Australia Statistics." Gitnux, 13 Feb 2026, https://gitnux.org/homelessness-in-australia-statistics.
Chicago
Timothy Grant. 2026. "Homelessness In Australia Statistics." Gitnux. https://gitnux.org/homelessness-in-australia-statistics.
Sources & references
25 datasets cited across this report · attribution is report-level
aihw.gov.auabs.gov.auhomelessnessaustralia.org.au missionaustralia.com.ausalvationarmy.org.auyfoundations.org.audva.gov.auabc.net.auanrows.org.auminister.infrastructure.gov.auhomeground.org.audss.gov.aundis.gov.aulaunchhousing.org.aunationallegalaid.org.audtf.vic.gov.auheadspace.org.auvic.gov.aubigissue.org.auaskizzy.org.aunsw.gov.auwomenslegal.org.auhealth.gov.ausro.vic.gov.aucityofsydney.nsw.gov.au