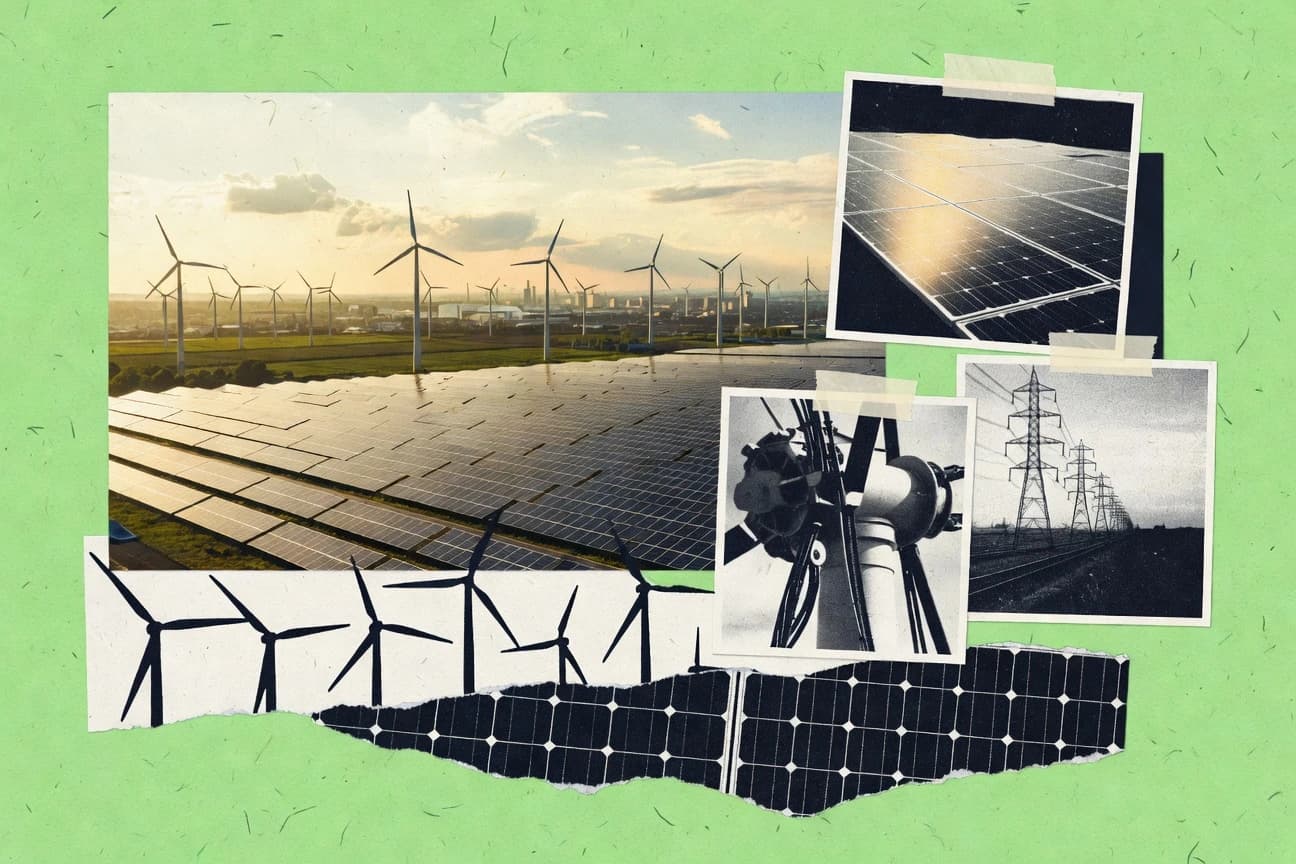

Solar and wind accounted for nearly all new renewable capacity last year, pushing global additions to a record 473 gigawatts. The real measure of progress, however, is electricity generation, which shifts more slowly than installed capacity. This article examines the latest statistics on build rates, actual power output, and resulting emissions impacts.
Key Takeaways
- Global bioenergy capacity reached 150 GW by end-2023.
- Global renewable capacity reached 3,870 GW by end-2023, 86% growth since 2013.
- Global hydropower capacity totaled 1,416 GW by end-2023.
- Global solar PV capacity reached 1,053 GW by the end of 2022, representing 4.7% of total global electricity capacity.
- Global onshore wind capacity reached 899 GW by end-2022, generating 2,157 TWh.
Renewables are rapidly expanding worldwide, boosting clean power generation and accelerating the shift away from fossil fuels.
Related reading
01 · Category
Bioenergy and Geothermal19 stats
01
Global bioenergy capacity reached 150 GW by end-2023.
02
Bioenergy generated 600 TWh electricity globally in 2023, 2.3% of total.
03
Global geothermal capacity stood at 15.9 GW in 2023.
04
Modern bioenergy heat production was 10 EJ globally in 2022.
05
US bioenergy capacity is 17 GW, largest globally in 2023.
06
Geothermal LCOE averaged $0.056/kWh worldwide in 2023.
07
Global biogas plants numbered 220,000 in 2023, producing 100 TWh equivalent.
08
Indonesia’s geothermal capacity is 2.3 GW, with 500 MW added since 2020.
09
Bioenergy jobs totaled 5.5 million globally in 2023.
10
Global solid biomass capacity is 100 GW in 2023.
11
Kenya generates 45% electricity from geothermal, total 900 MW in 2023.
12
Biofuel production reached 170 billion liters globally in 2023.
13
Iceland’s geothermal provides 30% electricity, 90% heating in 2023.
14
Global waste-to-energy plants capacity 50 GW in 2023.
15
Philippines geothermal capacity 1.9 GW, second largest.
16
Advanced biofuels capacity grew to 5 GW equivalent in 2023.
17
New Zealand geothermal 1 GW, 20% of electricity.
18
Global bioenergy investment $70 billion in 2023.
19
Turkey added 200 MW geothermal in 2023, total 1.7 GW.
Interpretation
Bioenergy and Geothermal Interpretation
While bioenergy and geothermal might be the overlooked workhorses of the renewable stable, generating substantial heat, power, and millions of jobs, they’re still a relatively small but mighty slice of the global energy pie.
02 · Category
Global Renewables Overview20 stats
01
Global renewable capacity reached 3,870 GW by end-2023, 86% growth since 2013.
02
Renewables generated 30% of global electricity in 2023, up from 19% in 2013.
03
Global renewable investment hit $1.8 trillion in 2023, double fossil fuels.
04
Renewables added 510 GW capacity worldwide in 2023, record high.
05
Global renewable jobs reached 13.7 million in 2023.
06
Renewables share in primary energy 12.5% in 2023.
07
Net zero renewables scenario needs 11,000 GW by 2030.
08
Global renewable power capacity growth averaged 10% annually 2013-2023.
09
Developing countries hold 60% of global renewable capacity in 2023.
10
Renewable LCOE 85% lower than fossils for new builds in 2023.
11
Asia added 70% of new renewable capacity in 2023.
12
Global clean energy manufacturing investment $200 billion in 2023.
13
Renewables avoided 2.5 Gt CO2 emissions in 2023.
14
Policy support drove 95% of renewable deployment in 2023.
15
Global renewable electricity trade grew 15% in 2023.
16
Corporate PPAs for renewables reached 50 GW globally in 2023.
17
Grid integration challenges caused 5% renewable curtailment globally.
18
Africa’s renewable capacity doubled to 60 GW 2018-2023.
19
Latin America renewables share 70% electricity in 2023.
20
Global energy storage for renewables hit 250 GW by 2023.
Interpretation
Global Renewables Overview Interpretation
While the world has dramatically accelerated its sprint toward renewable energy, we're still warming up while the planet’s clock is ticking down.
03 · Category
Hydropower19 stats
01
Global hydropower capacity totaled 1,416 GW by end-2023.
02
Hydropower generated 4,250 TWh globally in 2023, 15% of world electricity.
03
China holds 421 GW hydropower capacity, 30% of global total in 2023.
04
Brazil added 4 GW hydro in 2023, total 110 GW.
05
Global pumped storage hydropower capacity is 160 GW as of 2023.
06
Small hydropower (<10 MW) capacity worldwide exceeds 120 GW in 2023.
07
Hydropower LCOE averaged $0.047/kWh globally in 2023.
08
Canada’s hydro capacity is 82 GW, generating 60% of its electricity in 2023.
09
Run-of-river hydro capacity grew by 5 GW globally in 2023.
10
Hydropower investment reached $50 billion worldwide in 2023.
11
Global hydro jobs numbered 2.2 million in 2023.
12
Three Gorges Dam in China generated 111 TWh in 2023.
13
Africa’s hydro potential is 300 GW untapped, with 20 GW installed in 2023.
14
India added 1.2 GW hydro in FY23, total 47 GW.
15
Norway generated 88% electricity from hydro in 2023.
16
Global hydro capacity factor averaged 40-50% in 2023.
17
Russia’s hydro capacity is 53 GW, adding 0.5 GW in 2023.
18
Hydro refurbishments added 10 GW capacity globally in 2023.
19
Vietnam added 2 GW hydro in 2023, total 22 GW.
Interpretation
Hydropower Interpretation
While hydropower remains the steadfast, multi-talented veteran of the clean energy team—quietly generating 15% of the world's electricity, employing millions, and still leaving a continent-sized reservoir of untapped potential in Africa—its future relies on both honoring its legacy and innovating beyond its traditional dams.
More related reading
04 · Category
Solar Energy30 stats
01
Global solar PV capacity reached 1,053 GW by the end of 2022, representing 4.7% of total global electricity capacity.
02
In 2023, new solar PV installations worldwide totaled 447 GWdc, a 50% growth over 2022's 297 GWdc.
03
Solar PV accounted for 75% of all newly added renewable capacity globally in 2022.
04
By 2023, cumulative solar capacity installations exceeded 1.6 TW globally, driven by China’s 430 GW additions since 2020.
05
Global solar PV module manufacturing capacity hit 1,000 GW annually in 2023, with China holding 80% market share.
06
Solar power generation reached 1,300 TWh globally in 2023, up 25% from 2022.
07
Utility-scale solar PV levelized cost of electricity (LCOE) fell to $0.049/kWh globally in 2023, 89% lower than fossil fuel alternatives.
08
Distributed solar PV capacity grew by 110 GW globally in 2023, primarily in rooftops across Europe and the US.
09
By end-2023, solar PV represented 6.5% of global electricity generation.
10
Global solar PV investment reached $500 billion in 2023, surpassing all other energy technologies.
11
China installed 220 GW of solar PV in 2023, accounting for 49% of global additions.
12
Floating solar PV capacity worldwide reached 13 GW by 2023, with Asia leading at 90%.
13
Bifacial solar module deployment grew to 40% of new installations globally in 2023.
14
Global solar tracker market installed 70 GW in 2023, boosting utility-scale efficiency by 20%.
15
Concentrated solar power (CSP) capacity stood at 15 GW globally in 2023, with 80% in Spain and Middle East.
16
Solar PV recycling capacity reached 20 GW annually worldwide by 2023.
17
India’s solar capacity hit 73 GW by March 2023, with 15 GW added in FY23.
18
Europe added 56 GW of solar PV in 2023, led by Germany (14 GW) and Spain (12 GW).
19
US solar installations reached 32 GWdc in 2023, driven by IRA incentives.
20
Global solar irradiance potential could generate 1,575–49,837 TWh/year.
21
Solar PV capacity factor averaged 18-25% globally in 2023, varying by location.
22
Perovskite solar cell efficiency reached 26% in lab tests globally by 2023.
23
Global solar PV jobs numbered 4.3 million in 2022, projected to 5 million in 2023.
24
Australia’s solar rooftop capacity exceeded 20 GW by 2023.
25
Brazil added 12 GW solar in 2023, reaching 25 GW total.
26
Global solar battery storage pairings grew to 50 GW by 2023.
27
Vietnam installed 11 GW solar in 2023, total 18 GW.
28
Japan’s solar capacity reached 83 GW by end-2023.
29
Global solar PV curtailment losses were 25 TWh in 2023, mainly in China.
30
Morocco’s Noor CSP plant generated 1.8 TWh annually by 2023.
Interpretation
Solar Energy Interpretation
It seems the sun has become the world's most popular and overachieving employee, now accounting for 6.5% of the global electricity bill while still being endlessly promoted, with China as its most aggressive talent scout.
05 · Category
Wind Energy23 stats
01
Global onshore wind capacity reached 899 GW by end-2022, generating 2,157 TWh.
02
In 2023, global wind capacity additions hit 117 GW, with 75% onshore.
03
Offshore wind capacity worldwide stood at 72 GW by end-2023, up 18 GW from 2022.
04
Wind power accounted for 7.8% of global electricity generation in 2023.
05
China installed 44 GW onshore wind in 2023, leading global additions.
06
Europe added 29 GW wind capacity in 2023, with UK (7.8 GW) and Germany (6.5 GW).
07
US wind capacity reached 148 GW by end-2023, adding 6.4 GW.
08
Global wind LCOE for onshore dropped to $0.033/kWh in 2023, 67% below fossil fuels.
09
Offshore wind LCOE averaged $0.075/kWh globally in 2023.
10
Brazil added 4.7 GW onshore wind in 2023, total 30 GW.
11
India’s wind capacity hit 45 GW by March 2024, adding 3.3 GW in FY23.
12
Global wind turbine manufacturing capacity exceeded 150 GW/year by 2023.
13
Floating offshore wind capacity reached 200 MW globally by 2023.
14
Wind power investment globally was $180 billion in 2023.
15
Global wind jobs totaled 1.4 million in 2023.
16
Average onshore wind turbine hub height increased to 110m globally in 2023.
17
Offshore wind turbine capacity factor averaged 45% in mature markets like UK in 2023.
18
Australia added 1 GW wind in 2023, total 10 GW.
19
Vietnam’s wind capacity reached 4.5 GW by end-2023.
20
Global wind curtailment was 40 TWh in 2023, highest in China.
21
Turkey installed 2.2 GW wind in 2023, total 12 GW.
22
Global hybrid wind-solar projects reached 15 GW by 2023.
23
Denmark generated 57% of electricity from wind in 2023.
Interpretation
Wind Energy Interpretation
The world is now installing industrial-grade wind turbines at a clip that would make Icarus jealous, adding the equivalent of over a hundred large coal plants worth of capacity in a single year, all while driving costs so low that the fossil fuel industry is getting blown away both economically and literally.
Reference
Cite This Report
This report is designed to be cited. We maintain stable URLs and versioned verification dates. Copy the format appropriate for your publication below.
APA
Christopher Morgan. (2026, February 13). Global Renewable Energy Statistics. Gitnux. https://gitnux.org/global-renewable-energy-statistics
MLA
Christopher Morgan. "Global Renewable Energy Statistics." Gitnux, 13 Feb 2026, https://gitnux.org/global-renewable-energy-statistics.
Chicago
Christopher Morgan. 2026. "Global Renewable Energy Statistics." Gitnux. https://gitnux.org/global-renewable-energy-statistics.
Sources & references
48 datasets cited across this report · attribution is report-level