
In FY2022, 51,000 children were adopted from foster care, a 10% drop from pre-pandemic levels. At the same time, 125,000 children had parental rights terminated and were still waiting for adoption. The gap between legally freed children and finalized adoptions shows how the system continues to delay permanency, even as placements change.
Key Takeaways
- In FY2022, 51,000 children were adopted from foster care, down 10% from pre-pandemic levels.
- In FY2022, 52% of children in foster care were Caucasian, 22% African American, 25% Hispanic.
- In fiscal year 2022, approximately 391,098 children were in foster care on the last day of the year, with 42% placed in non-relative foster family homes.
- In foster adoptions, 75% of children achieve placement stability after 2 years.
- Caseloads over 15 reduce placement stability by 18%.
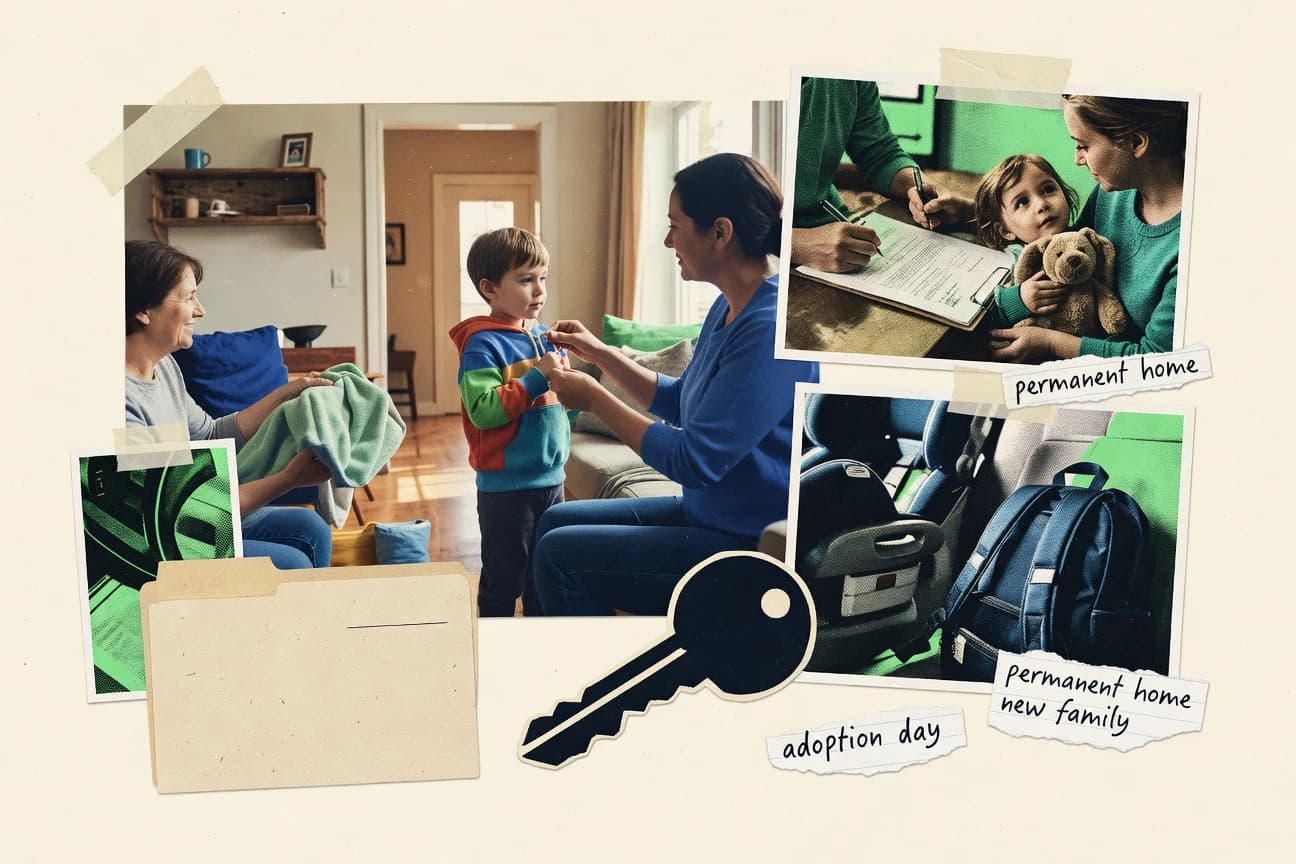
Thousands of children in foster care need stable adoptive families, making adoption statistics both urgent and hopeful.
Related reading
01 · Category
Adoption Statistics29 stats
01
In FY2022, 51,000 children were adopted from foster care, down 10% from pre-pandemic levels.
02
Adoption finalizations from foster care reached 49,360 in 2021.
03
80% of foster adoptions are by foster parents who have cared for the child.
04
Interstate adoptions from foster care number about 2,000 annually.
05
Adoption rates for children with special needs are 15% lower than non-special needs.
06
In 2022, 125,000 children in foster care had parental rights terminated and were waiting for adoption.
07
Average time to adoption from TPR is 25.2 months in 2022.
08
55% of foster adoptions are subsidized through Title IV-E.
09
Adoptions by relatives account for 28% of foster care adoptions.
10
Post-adoption disruption rate is 9.9% for foster adoptions.
11
In 2020, 118,000 children were waiting for adoption at start of year.
12
Adoption assistance payments average $20,000per child annually.
13
92% of foster adoptions are domestic, with international foster adoptions negligible.
14
States like Utah have adoption rates 20% above national average.
15
Sibling adoptions from foster care preserve 75% of sibling groups.
16
Post-TPR adoption rates improved 5% with family finding models.
17
40% of waiting children are 9+ years old for adoption.
18
Federal adoption incentives paid $80 million in 2022.
19
Kinship adoptions rose 15% from 2017-2022.
20
Average age at adoption from foster care is 7.7 years.
21
67% of adoptions are by married couples.
22
Adoption homestudy completion takes 3-6 months on average.
23
12% annual increase in older child adoptions since 2015.
24
Post-adoption services reach 60% of foster adoptive families.
25
Waiting children list has grown 8% since 2019.
26
85% of foster adoptions receive monthly subsidies.
27
In 2022, 4,000 children aged out before adoption.
28
76% of Black foster children are adopted by Black families.
29
Adoption rates for infants are 3x higher than for teens.
Interpretation
Adoption Statistics Interpretation
Behind every hopeful statistic lies a child's wait: while adoptions from foster care are ticking up, the chilling reality is that over 125,000 children are legally free for families yet still linger in the system, where adoption rates plummet for older kids and those with special needs, proving our collective capacity for love remains frustratingly selective.
02 · Category
Child Demographics27 stats
01
In FY2022, 52% of children in foster care were Caucasian, 22% African American, 25% Hispanic.
02
51% of foster children are male, 49% female as of 2021.
03
Children aged 1-5 years comprise 27% of foster care population.
04
15% of foster children have disabilities or special needs.
05
African American children are 14% of child population but 23% of foster care.
06
34% of foster children enter care due to parental drug abuse, affecting demographics.
07
Native American children are 1% of population but 2% of foster care, with 1.6x removal rate.
08
42% of foster children are under age 6.
09
LGBTQ+ youth are 20-40% of foster care population vs. 10% general.
10
Siblings represent 55% of foster care entries as groups.
11
25% of foster children have mental health diagnoses upon entry.
12
Hispanic children are 27% of foster care despite 26% general population.
13
Premature infants comprise 12% of under-1 foster entrants.
14
18% of foster youth identify as multiracial.
15
Children with developmental delays are 22% of foster population.
16
Urban foster children are 60% minority race/ethnicity.
17
8% of foster children are Asian/Pacific Islander.
18
Foster children with trauma histories: 70-80% prevalence.
19
Teens 13-17 are 25% of foster care.
20
Children entering care under 1 year: 20% of entries.
21
Foster girls experience higher sexual abuse rates at 30%.
22
35% of foster children have 3+ prior child welfare involvements.
23
Black girls are most overrepresented subgroup at 2.4x rate.
24
12% of foster children have physical health disabilities.
25
Immigrant children are 5% of foster care demographics.
26
Foster children with prenatal drug exposure: 32%.
27
Average age of foster children: 8.2 years in 2022.
Interpretation
Child Demographics Interpretation
This sobering snapshot reveals a system where our most vulnerable children—often very young, from sibling groups, and disproportionately from communities of color, LGBTQ+ youth, and those with special needs—are bearing the collective weight of societal crises like the opioid epidemic and systemic inequities.
03 · Category
Foster Care Population30 stats
01
In fiscal year 2022, approximately 391,098 children were in foster care on the last day of the year, with 42% placed in non-relative foster family homes.
02
As of September 30, 2021, 407,385 children were in foster care nationwide, marking a slight decline of 1.5% from 2020.
03
In 2020, 216,440 children entered foster care, primarily due to neglect (61%) and drug abuse by parents (34%).
04
By 2023 estimates, over 400,000 U.S. children remain in foster care annually, with Texas having the largest number at around 30,000.
05
Foster care entries peaked at 267,000 in 2009 but dropped to 193,000 by 2019 before rising again post-COVID.
06
In FY2021, 49% of children in foster care were white, 23% Black, and 22% Hispanic.
07
Approximately 6% of U.S. children will spend time in foster care before age 18, equating to 1 in 17 children.
08
California had 50,000 children in foster care in 2022, the highest of any state.
09
Foster care population has declined 20% since 2011, from 489,000 to 391,000 in 2022.
10
In 2021, 175,000 children exited foster care, with reunification accounting for 52% of exits.
11
Urban areas account for 55% of foster care placements, with rural areas at 20% and suburban at 25%.
12
Infants under 1 year old make up 18% of foster care entries annually.
13
In FY2020, parental incarceration led to 12% of foster care entries.
14
Foster care spending reached $8.4 billion federally in 2022 for Title IV-E.
15
27 states saw foster care population increases from 2017-2022, led by Florida with 15% growth.
16
Average length of stay in foster care is 20.4 months as of 2022.
17
10% of foster children are in group homes or institutions.
18
Kinship care placements rose to 37% of all foster care in 2022.
19
Foster care recidivism rate is 13.4% within 12 months of reunification.
20
56,000 children aged out of foster care without permanency from 2013-2022.
21
In 2022, 91% of foster children were in family-based settings.
22
Foster care population for children 0-5 years old was 47% in 2021.
23
Housing issues contributed to 7% of foster care removals in 2020.
24
Tribal children represent 2% of foster care but 10x overrepresented.
25
Post-pandemic, foster care entries rose 15% in some states by 2023.
26
Average caseload for foster care workers is 15-20 children per worker.
27
65% of foster children have chronic medical conditions.
28
Foster care exits totaled 193,000 in FY2021.
29
25% of foster youth have experienced 5+ placements.
30
In 2022, neglect was the reason for 59% of foster care entries.
Interpretation
Foster Care Population Interpretation
Behind the hopeful headlines of declining numbers lies a sobering truth: our systems still fail to reunify families quickly and place nearly half a million vulnerable children—disproportionately infants and minorities—into temporary care each year, a staggering cycle where even reunification carries a 13% risk of boomeranging them right back into the system.
More related reading
04 · Category
Placement Outcomes30 stats
01
In foster adoptions, 75% of children achieve placement stability after 2 years.
02
Reunification success rate is 52% within 12 months of entry.
03
Kinship placements have 20% lower disruption rates than non-kin.
04
85% of foster children in family homes experience improved school attendance.
05
Placement moves average 2.7 per child over stay.
06
Adopted foster children have 15% lower reentry rates to care.
07
60% of kinship foster homes receive lower support services.
08
Long-term foster care stability is achieved by 30% without exit.
09
Sibling placements together improve outcomes by 40% in behavior.
10
Foster-to-adopt transitions succeed 80% of the time.
11
25% reduction in mental health hospitalizations post-permanency.
12
Group home placements lead to 50% higher move rates.
13
Reunified families have 13% recidivism within 5 years.
14
Adoptive families report 90% satisfaction after 5 years.
15
Older youth placements disrupt at 27% rate.
16
Therapeutic foster care improves outcomes for 70% with trauma.
17
68% of stable placements lead to permanency within 24 months.
18
Kinship guardianships increase family stability by 35%.
19
Post-adoption contact with birth family aids 65% adjustment.
20
Foster parent retention rate is 60% after first year.
21
Children in 1-2 placements have 50% better educational outcomes.
22
Disruption rates drop 10% with pre-placement visits.
23
40% of placements for teens lead to independent living prep.
24
Family preservation services prevent 25% of entries.
25
Stable adoptive homes reduce behavioral issues by 30%.
26
55% of kinship placements are informal.
27
Post-discharge, 72% of reunified children remain home at 12 months.
28
Matching race/ethnicity improves placement stability by 15%.
29
20% of foster placements involve respite care usage.
30
Permanency achieved in 62% of cases under 24 months.
Interpretation
Placement Outcomes Interpretation
The statistics reveal that when foster care prioritizes kinship, stability, and genuine support, it can be a remarkably effective repair manual for broken families, but its success depends entirely on the quality of the tools—and the hands that wield them.
05 · Category
System Challenges30 stats
01
Caseloads over 15 reduce placement stability by 18%.
02
30% of foster children experience 4+ placement changes.
03
Shortage of foster homes affects 40 states critically.
04
Racial disparities: Black children wait 2x longer for permanency.
05
50% of child welfare workers leave within 2 years.
06
Funding gaps leave 20% of post-adoption services unmet.
07
Court delays average 14 months to TPR.
08
27% of foster youth age out homeless within 2 years.
09
Parental substance abuse unresolved in 60% of reunifications.
10
Inadequate trauma screening in 40% of entries.
11
Sibling separations occur in 53% of placements.
12
70% of foster children change schools 2+ times.
13
Kinship caregivers 50% more likely to live in poverty.
14
Mental health access delayed for 45% of foster kids.
15
15 states lack post-18 foster care extensions.
16
Overrepresentation of disabilities in foster care at 17%.
17
35% drop in recruitment post-COVID.
18
Visitation compliance only 65% for birth parents.
19
25% of cases exceed ASFA 15-month permanency timeline.
20
LGBTQ+ youth face 2x rejection in placements.
21
Training hours inadequate for 40% of foster parents.
22
Recidivism higher in underfunded states by 10%.
23
60% of aged-out youth lack health insurance.
24
Documentation errors delay 20% of adoptions.
25
Poverty correlates with 75% of removals.
26
Interstate compacts delay placements in 15% cases.
27
45% of workers report burnout annually.
28
Special needs matching fails 30% due to scarcity.
29
Federal funding covers only 50% of costs in some states.
30
18% of foster children run away annually.
Interpretation
System Challenges Interpretation
The foster care system is a house of cards built on a foundation of overworked staff, underfunded services, and heartbreaking statistics, where every number is a child waiting for stability that the structure itself seems designed to undermine.
Reference
Cite This Report
This report is designed to be cited. We maintain stable URLs and versioned verification dates. Copy the format appropriate for your publication below.
APA
David Kowalski. (2026, February 13). Foster Adoption Statistics. Gitnux. https://gitnux.org/foster-adoption-statistics
MLA
David Kowalski. "Foster Adoption Statistics." Gitnux, 13 Feb 2026, https://gitnux.org/foster-adoption-statistics.
Chicago
David Kowalski. 2026. "Foster Adoption Statistics." Gitnux. https://gitnux.org/foster-adoption-statistics.
Sources & references
16 datasets cited across this report · attribution is report-level