GitNux Logo
  • Editorial Process
Contact Us
Gitnux Logo
Contact Us
  • Home
  • Editorial Process
  • Contact Us
Gitnux Logo
  • Home
  • Blog
  • All Statistics
  • Services
  • Company
  • Privacy Policy
  • Contact
  • Partner
  • Careers
  • As Seen In

Our Services

Custom Market Research

Tailored research solutions designed around your specific business questions and strategic objectives.

Learn more →

Buy Industry Reports

Access comprehensive pre-made industry reports with instant download. Professional market intelligence at your fingertips.

Browse reports →

Software Advisory

Stop wasting months evaluating software vendors. Our analysts leverage 1,000+ AI-verified Best Lists to recommend the right tool for your business in 2–4 weeks.

Learn more →

Popular Categories

Ai In IndustryTechnology Digital MediaSafety AccidentsEntertainment EventsMedical Conditions DisordersMental Health PsychologyMarketing AdvertisingEducation LearningFinance Financial ServicesManufacturing EngineeringSocial Issues Societal TrendsPublic Safety CrimeHealthcare MedicineFood NutritionConsumer RetailHealth MedicineConstruction InfrastructureSports RecreationHr In IndustryDiversity Equity And Inclusion In IndustryGlobal Regional IndustriesBusiness FinanceCustomer Experience In IndustrySustainability In Industry

Find us on

Clutch · Sortlist · DesignRush · G2

GoodFirms · Crunchbase · Tracxn

How we make money

Gitnux.org is an independent market research platform. Primarily, we generate revenue on Gitnux through research projects we conduct for clients & external banner advertising. If we receive a commission for products or services, this is indicated with *.

© 2026 Gitnux. Independent market research platform.

Logos provided by Logo.dev

  1. Home
  2. Wellness Fitness
  3. Fitness Studio Industry Statistics

GITNUXREPORT 2026

Fitness Studio Industry Statistics

The global fitness industry is growing robustly across diverse markets and business models.

138 statistics5 sections11 min readUpdated 2 days ago

Key Statistics

Statistic 1

U.S. adults aged 18-34 represent 42% of gym memberships, with 28.3 million members in 2023.

Statistic 2

Women accounted for 52% of fitness studio memberships worldwide in 2023, up from 48% in 2019.

Statistic 3

67% of Gen Z consumers prefer boutique studios over traditional gyms, per 2023 surveys.

Statistic 4

Average gym visit frequency is 4.2 times per week for active U.S. members in 2023.

Statistic 5

39% of fitness consumers cite weight loss as primary motivation, followed by 28% for health improvement in 2023.

Statistic 6

Hispanic Americans have a 25% higher gym membership rate than average at 24.1% penetration in 2023.

Statistic 7

55% of members aged 35-54 use fitness apps alongside studio visits weekly in 2023.

Statistic 8

Urban dwellers represent 72% of fitness studio members globally, vs 28% suburban/rural in 2023.

Statistic 9

48% of parents with children under 18 hold family fitness memberships in 2023.

Statistic 10

Boomers (55+) increased fitness participation by 14% to 19.2 million U.S. members in 2023.

Statistic 11

62% of fitness consumers prefer morning workouts, averaging 6:30 AM start times in 2023 surveys.

Statistic 12

LGBTQ+ individuals show 33% higher gym adherence rates, with 1.8 million U.S. members in 2023.

Statistic 13

71% of college students maintain gym memberships post-graduation in 2023.

Statistic 14

Low-income households (<$50k) have 12% fitness membership penetration, up 3% YoY in 2023.

Statistic 15

44% of members engage in group classes weekly, preferring HIIT (29%) in 2023.

Statistic 16

African American gym membership rate reached 18.7% of population in 2023.

Statistic 17

53% of remote workers joined gyms post-2020, averaging 3.9 visits/week in 2023.

Statistic 18

Married individuals have 15% higher retention rates in fitness studios at 78% annually in 2023.

Statistic 19

66% of fitness enthusiasts track progress via wearables, 92% of whom are under 40 in 2023.

Statistic 20

Vegetarians/vegans represent 22% of gym members, 1.5x more likely to join yoga studios in 2023.

Statistic 21

38% of seniors (65+) cite social interaction as key gym motivator in 2023.

Statistic 22

High-income earners (>$100k) spend 28% more on premium studios, averaging $185/month in 2023.

Statistic 23

49% of Gen X prefers strength training, attending 2.8 sessions/week on average in 2023.

Statistic 24

Students (18-24) have 52% dropout rate after first semester without orientation in 2023.

Statistic 25

61% of women over 40 join for stress relief, per 2023 wellness surveys.

Statistic 26

Rural gym members travel 12.4 miles average, 2x urban distance in 2023.

Statistic 27

57% of diabetics maintain gym routines for blood sugar control in 2023.

Statistic 28

Pet owners are 19% more likely to join dog-friendly gyms in 2023.

Statistic 29

45% of night shift workers use 24/7 gyms, peaking at 2 AM visits in 2023.

Statistic 30

U.S. gym chains average $1.72 million revenue per location in 2023.

Statistic 31

Membership dues contribute 62% of total revenue for fitness studios globally in 2023.

Statistic 32

Average monthly membership fee in U.S. boutique studios is $145, up 7% YoY in 2023.

Statistic 33

Personal training generates 18% of revenue, averaging $55/session in 2023.

Statistic 34

Operating profit margins for U.S. gyms averaged 15.2% in 2023, post-recovery.

Statistic 35

Group fitness classes yield $42 average revenue per participant annually in 2023.

Statistic 36

Retail sales (supplements/apparel) account for 9% of studio revenue, $12 avg sale in 2023.

Statistic 37

EBITDA for top 20 chains averaged 22.4% in 2023, led by LTF at 25.1%.

Statistic 38

Annual churn cost studios $1,200 per lost member in forgone revenue in 2023.

Statistic 39

Corporate partnerships added $450 million to industry revenue via wellness programs in 2023.

Statistic 40

Average studio rent expense is 8.5% of revenue, $18/sq ft annually in urban areas 2023.

Statistic 41

Marketing spend averages 4.2% of revenue, ROI 5.8:1 for digital campaigns in 2023.

Statistic 42

Utility costs rose 12% to $2.40/sq ft for gyms in 2023 due to energy prices.

Statistic 43

Insurance premiums averaged $28,000/year per mid-size studio in 2023.

Statistic 44

Payroll constitutes 55% of operating expenses, avg trainer wage $32/hr in 2023.

Statistic 45

Equipment depreciation costs $15,000-25,000/year per studio in 2023.

Statistic 46

Online class subscriptions average $19.99/month, retaining 82% subscribers in 2023.

Statistic 47

Vending/amenity revenue adds $4,200/month per large gym in 2023.

Statistic 48

Tax deductions for fitness businesses averaged 22% effective rate savings in 2023.

Statistic 49

Debt financing covers 34% of expansions, avg interest 6.2% in 2023.

Statistic 50

Referral programs boost revenue 11%, avg $50 new member value in 2023.

Statistic 51

Seasonal promotions lift Q4 revenue 18% on average in 2023.

Statistic 52

Multi-location chains average 12% higher margins at 18.3% in 2023.

Statistic 53

Maintenance costs $1.85/sq ft annually for equipment upkeep in 2023.

Statistic 54

Digital payment fees deduct 2.9% of transaction revenue in 2023.

Statistic 55

The global fitness club industry revenue reached $109.1 billion in 2023, reflecting a compound annual growth rate (CAGR) of 8.4% from 2018 to 2023.

Statistic 56

In the United States, there were 41,190 fitness centers operating in 2023, up 2.1% from the previous year.

Statistic 57

The European fitness market grew by 6.7% in membership numbers in 2023, reaching 69.3 million members across 57,000 clubs.

Statistic 58

Asia-Pacific fitness industry revenue is projected to hit $28.5 billion by 2027, driven by urbanization and rising disposable incomes.

Statistic 59

Boutique fitness studios accounted for 12% of total industry revenue in 2023, with a growth rate of 15.2% YoY.

Statistic 60

The U.S. fitness industry market size was valued at $35.2 billion in 2023, with online fitness segments contributing $4.1 billion.

Statistic 61

Latin America's fitness sector expanded by 9.8% in 2023, with Brazil leading at 18,500 clubs.

Statistic 62

Low-cost gym chains like Planet Fitness saw a 12.3% membership increase in 2023, totaling 18.5 million members.

Statistic 63

The Middle East fitness market is expected to grow at a CAGR of 11.2% from 2024-2028, fueled by wellness tourism.

Statistic 64

In 2023, the number of fitness apps downloads worldwide surpassed 1.2 billion, boosting hybrid fitness models.

Statistic 65

Global fitness equipment sales hit $14.6 billion in 2023, with a projected CAGR of 5.9% through 2030.

Statistic 66

U.S. gym memberships totaled 64.2 million in 2023, representing 20.8% penetration of the adult population.

Statistic 67

The Australian fitness industry revenue grew 7.9% to AUD 2.8 billion in 2023, with 7,200 clubs.

Statistic 68

China's fitness club count exceeded 45,000 in 2023, with urban penetration at 3.2%.

Statistic 69

The wellness real estate segment, including fitness-integrated properties, valued at $1.1 trillion globally in 2023.

Statistic 70

In 2023, 58% of U.S. fitness consumers were millennials, driving a 4.5% industry growth.

Statistic 71

The corporate wellness fitness market reached $12.4 billion in 2023, with 15% YoY growth.

Statistic 72

India's fitness industry is forecasted to reach INR 15,000 crore by 2025, from INR 9,000 crore in 2023.

Statistic 73

The number of micro-gyms (under 5,000 sq ft) in the U.S. doubled to 8,200 between 2020-2023.

Statistic 74

Global virtual fitness revenue surged to $7.8 billion in 2023, post-pandemic hybrid shift.

Statistic 75

U.K. fitness sector revenue hit £4.9 billion in 2023, with 8,200 clubs serving 10.5 million members.

Statistic 76

The senior fitness market grew 13.4% to $22 billion globally in 2023.

Statistic 77

Canada’s fitness industry rebounded with $4.2 billion revenue in 2023, up 11% from 2022.

Statistic 78

Functional fitness studios increased by 22% worldwide from 2021-2023, totaling 15,400 locations.

Statistic 79

The pet fitness and wellness market, intersecting with human fitness studios, valued at $1.2 billion in 2023.

Statistic 80

South Korea's fitness club memberships reached 12.1 million in 2023, a 9.6% increase.

Statistic 81

The adaptive fitness market for disabilities grew to $2.8 billion in 2023, CAGR 10.1%.

Statistic 82

Mexico's fitness sector expanded to 4,500 clubs in 2023, revenue $2.1 billion USD.

Statistic 83

The women's only fitness clubs numbered 3,200 globally in 2023, up 18%.

Statistic 84

Global fitness franchising revenue was $18.7 billion in 2023, with 42,000 franchised units.

Statistic 85

U.S. fitness studios average 1,850 sq ft size, with 65% utilization rate in 2023.

Statistic 86

Staff-to-member ratio averages 1:75 in full-service gyms in 2023.

Statistic 87

Peak hour capacity utilization hits 85% in urban studios, 10-11 AM slots in 2023.

Statistic 88

Average class size is 18 participants for HIIT, 25 for yoga in 2023.

Statistic 89

Equipment per member ratio is 1:4 in premium clubs, 1:8 in budget gyms 2023.

Statistic 90

Member retention rate averages 72% annually for studios with onboarding programs in 2023.

Statistic 91

Cleaning protocols cost 3.2 hours daily per 5,000 sq ft studio in 2023.

Statistic 92

Check-in tech adoption at 88%, reducing no-shows by 22% in 2023.

Statistic 93

Average studio opens 5:30 AM, closes 10 PM, 105 hours/week in 2023.

Statistic 94

Trainer certification compliance at 94%, with NASM/ACE holding 62% share in 2023.

Statistic 95

Locker room usage peaks at 45% capacity post-peak hours in 2023.

Statistic 96

Inventory turnover for retail is 4.2x annually in studios 2023.

Statistic 97

HVAC energy consumption averages 40% of utilities in large gyms 2023.

Statistic 98

Waitlist management software used by 76% of studios, filling 68% slots in 2023.

Statistic 99

Front desk staffing averages 1.8 FTE during off-peak in 2023.

Statistic 100

Towel/laundry costs $0.45 per use, 1,200 uses/week avg studio 2023.

Statistic 101

Member feedback surveys yield 4.3/5 NPS average in high-retention studios 2023.

Statistic 102

Parking utilization 72% during peaks for suburban gyms in 2023.

Statistic 103

POS system transaction speed averages 12 seconds in modern studios 2023.

Statistic 104

Seasonal staff turnover 28% in summer, training costs $1,200/new hire 2023.

Statistic 105

WiFi bandwidth averages 150 Mbps needed per 100 members in 2023.

Statistic 106

Group class instructor utilization 82%, teaching 22 classes/month avg 2023.

Statistic 107

Maintenance downtime for equipment <2% annually in top studios 2023.

Statistic 108

Digital signage boosts class sign-ups 17% in equipped studios 2023.

Statistic 109

24/7 unmanned studios grew 35% to 4,200 locations in U.S. 2023.

Statistic 110

Hybrid fitness (in-person + virtual) adopted by 91% of studios in 2023.

Statistic 111

HIIT remains #1 trend, with wearable tech integration up 45% in studios 2024 forecast.

Statistic 112

AI-personalized workouts projected to capture 25% of PT market by 2027.

Statistic 113

Recovery tech (cryotherapy/sauna) in 42% of premium studios by 2024.

Statistic 114

Gamified fitness apps to grow 28% CAGR, integrating with studios by 2028.

Statistic 115

Wellness tourism fitness packages expected $1 trillion segment by 2027.

Statistic 116

Metaverse virtual gyms projected 300,000 users by end-2025.

Statistic 117

Sustainable/eco-friendly studios to rise 40% by 2026, green certifications.

Statistic 118

Mental health-focused classes (mindfulness) up 62% in offerings 2023-2024.

Statistic 119

Home-studio hybrid models to dominate 55% consumer preference by 2027.

Statistic 120

Women's strength training participation up 34% since 2020, ongoing trend.

Statistic 121

Outdoor fitness events to generate $5.2B by 2028, studio partnerships.

Statistic 122

Nutrition coaching bundled in 67% studios by 2025 projection.

Statistic 123

VR fitness immersion growing 50% YoY, 12% studio adoption 2024.

Statistic 124

Corporate EHS (employee health studios) to expand 22% CAGR to 2030.

Statistic 125

Inclusive fitness for all abilities in 78% new studio builds by 2026.

Statistic 126

Sleep-optimized fitness programs emerging, 15% market share by 2027.

Statistic 127

Blockchain loyalty programs in 23% chains by 2025 for retention.

Statistic 128

Plant-based recovery products sales up 41% in studios 2023-2024.

Statistic 129

Micro-workouts (10-min sessions) 35% of app usage, studio adaptation.

Statistic 130

Biohacking labs in high-end gyms, 18% growth projected 2024-2028.

Statistic 131

Community-driven pop-up studios to 10,000 locations by 2027.

Statistic 132

Voice-activated gym controls in 31% smart studios by 2025.

Statistic 133

Longevity fitness (anti-aging) market $27B by 2030.

Statistic 134

Social media live classes 48% of digital engagement in 2024.

Statistic 135

E-sports fitness crossovers emerging, 5% studio pilots 2024.

Statistic 136

Personalized nutrition kiosks in 14% clubs by end-2025.

Statistic 137

Climate-adaptive indoor cycling up 29% amid weather volatility.

Statistic 138

75% studios plan AI chatbots for member service by 2026.

1/138
Sources
Trusted by 500+ publications
Harvard Business ReviewThe GuardianFortuneMicrosoftWorld Economic ForumFast Company
Harvard Business ReviewThe GuardianFortune+497
James Okoro

Written by James Okoro·Fact-checked by Katherine Brennan

Published Feb 13, 2026·Last verified Apr 17, 2026·Next review: Oct 2026
Fact-checked via 4-step process— how we build this report
01Primary Source Collection

Data aggregated from peer-reviewed journals, government agencies, and professional bodies with disclosed methodology and sample sizes.

02Editorial Curation

Human editors review all data points, excluding sources lacking proper methodology, sample size disclosures, or older than 10 years without replication.

03AI-Powered Verification

Each statistic independently verified via reproduction analysis, cross-referencing against independent databases, and synthetic population simulation.

04Human Cross-Check

Final human editorial review of all AI-verified statistics. Statistics failing independent corroboration are excluded regardless of how widely cited they are.

Read our full methodology →

Statistics that fail independent corroboration are excluded.

While hitting record profits and expanding into nearly every corner of the globe, the fitness studio industry is flexing its might, evidenced by its staggering $109.1 billion in global revenue for 2023.

Key Takeaways

  • 1The global fitness club industry revenue reached $109.1 billion in 2023, reflecting a compound annual growth rate (CAGR) of 8.4% from 2018 to 2023.
  • 2In the United States, there were 41,190 fitness centers operating in 2023, up 2.1% from the previous year.
  • 3The European fitness market grew by 6.7% in membership numbers in 2023, reaching 69.3 million members across 57,000 clubs.
  • 4U.S. adults aged 18-34 represent 42% of gym memberships, with 28.3 million members in 2023.
  • 5Women accounted for 52% of fitness studio memberships worldwide in 2023, up from 48% in 2019.
  • 667% of Gen Z consumers prefer boutique studios over traditional gyms, per 2023 surveys.
  • 7U.S. gym chains average $1.72 million revenue per location in 2023.
  • 8Membership dues contribute 62% of total revenue for fitness studios globally in 2023.
  • 9Average monthly membership fee in U.S. boutique studios is $145, up 7% YoY in 2023.
  • 10U.S. fitness studios average 1,850 sq ft size, with 65% utilization rate in 2023.
  • 11Staff-to-member ratio averages 1:75 in full-service gyms in 2023.
  • 12Peak hour capacity utilization hits 85% in urban studios, 10-11 AM slots in 2023.
  • 13HIIT remains #1 trend, with wearable tech integration up 45% in studios 2024 forecast.
  • 14AI-personalized workouts projected to capture 25% of PT market by 2027.
  • 15Recovery tech (cryotherapy/sauna) in 42% of premium studios by 2024.

The global fitness industry is growing robustly across diverse markets and business models.

Consumer Behavior & Demographics

1U.S. adults aged 18-34 represent 42% of gym memberships, with 28.3 million members in 2023.
Verified
2Women accounted for 52% of fitness studio memberships worldwide in 2023, up from 48% in 2019.
Verified
367% of Gen Z consumers prefer boutique studios over traditional gyms, per 2023 surveys.
Verified
4Average gym visit frequency is 4.2 times per week for active U.S. members in 2023.
Directional
539% of fitness consumers cite weight loss as primary motivation, followed by 28% for health improvement in 2023.
Single source
6Hispanic Americans have a 25% higher gym membership rate than average at 24.1% penetration in 2023.
Verified
755% of members aged 35-54 use fitness apps alongside studio visits weekly in 2023.
Verified
8Urban dwellers represent 72% of fitness studio members globally, vs 28% suburban/rural in 2023.
Verified
948% of parents with children under 18 hold family fitness memberships in 2023.
Directional
10Boomers (55+) increased fitness participation by 14% to 19.2 million U.S. members in 2023.
Single source
1162% of fitness consumers prefer morning workouts, averaging 6:30 AM start times in 2023 surveys.
Verified
12LGBTQ+ individuals show 33% higher gym adherence rates, with 1.8 million U.S. members in 2023.
Verified
1371% of college students maintain gym memberships post-graduation in 2023.
Verified
14Low-income households (<$50k) have 12% fitness membership penetration, up 3% YoY in 2023.
Directional
1544% of members engage in group classes weekly, preferring HIIT (29%) in 2023.
Single source
16African American gym membership rate reached 18.7% of population in 2023.
Verified
1753% of remote workers joined gyms post-2020, averaging 3.9 visits/week in 2023.
Verified
18Married individuals have 15% higher retention rates in fitness studios at 78% annually in 2023.
Verified
1966% of fitness enthusiasts track progress via wearables, 92% of whom are under 40 in 2023.
Directional
20Vegetarians/vegans represent 22% of gym members, 1.5x more likely to join yoga studios in 2023.
Single source
2138% of seniors (65+) cite social interaction as key gym motivator in 2023.
Verified
22High-income earners (>$100k) spend 28% more on premium studios, averaging $185/month in 2023.
Verified
2349% of Gen X prefers strength training, attending 2.8 sessions/week on average in 2023.
Verified
24Students (18-24) have 52% dropout rate after first semester without orientation in 2023.
Directional
2561% of women over 40 join for stress relief, per 2023 wellness surveys.
Single source
26Rural gym members travel 12.4 miles average, 2x urban distance in 2023.
Verified
2757% of diabetics maintain gym routines for blood sugar control in 2023.
Verified
28Pet owners are 19% more likely to join dog-friendly gyms in 2023.
Verified
2945% of night shift workers use 24/7 gyms, peaking at 2 AM visits in 2023.
Directional

Consumer Behavior & Demographics Interpretation

The modern fitness studio thrives by masterfully catering to a fragmented yet dedicated clientele, where boutique-loving Gen Z, health-conscious women, socially motivated seniors, and premium-seeking urbanites collectively prove that the only universal truth is everyone wants a very specific, personalized version of sweat.

Financial Performance

1U.S. gym chains average $1.72 million revenue per location in 2023.
Verified
2Membership dues contribute 62% of total revenue for fitness studios globally in 2023.
Verified
3Average monthly membership fee in U.S. boutique studios is $145, up 7% YoY in 2023.
Verified
4Personal training generates 18% of revenue, averaging $55/session in 2023.
Directional
5Operating profit margins for U.S. gyms averaged 15.2% in 2023, post-recovery.
Single source
6Group fitness classes yield $42 average revenue per participant annually in 2023.
Verified
7Retail sales (supplements/apparel) account for 9% of studio revenue, $12 avg sale in 2023.
Verified
8EBITDA for top 20 chains averaged 22.4% in 2023, led by LTF at 25.1%.
Verified
9Annual churn cost studios $1,200 per lost member in forgone revenue in 2023.
Directional
10Corporate partnerships added $450 million to industry revenue via wellness programs in 2023.
Single source
11Average studio rent expense is 8.5% of revenue, $18/sq ft annually in urban areas 2023.
Verified
12Marketing spend averages 4.2% of revenue, ROI 5.8:1 for digital campaigns in 2023.
Verified
13Utility costs rose 12% to $2.40/sq ft for gyms in 2023 due to energy prices.
Verified
14Insurance premiums averaged $28,000/year per mid-size studio in 2023.
Directional
15Payroll constitutes 55% of operating expenses, avg trainer wage $32/hr in 2023.
Single source
16Equipment depreciation costs $15,000-25,000/year per studio in 2023.
Verified
17Online class subscriptions average $19.99/month, retaining 82% subscribers in 2023.
Verified
18Vending/amenity revenue adds $4,200/month per large gym in 2023.
Verified
19Tax deductions for fitness businesses averaged 22% effective rate savings in 2023.
Directional
20Debt financing covers 34% of expansions, avg interest 6.2% in 2023.
Single source
21Referral programs boost revenue 11%, avg $50 new member value in 2023.
Verified
22Seasonal promotions lift Q4 revenue 18% on average in 2023.
Verified
23Multi-location chains average 12% higher margins at 18.3% in 2023.
Verified
24Maintenance costs $1.85/sq ft annually for equipment upkeep in 2023.
Directional
25Digital payment fees deduct 2.9% of transaction revenue in 2023.
Single source

Financial Performance Interpretation

For all the sweat equity poured in, the fitness industry proves it's a serious business, showing that while members might join for the burn, the studios run on a tight, diversified model where loyalty is a premium asset, churn is a costly sin, and even the simple act of renting a square foot or selling a shake is meticulously accounted for in the pursuit of a lean, profitable operation.

Market Size & Growth

1The global fitness club industry revenue reached $109.1 billion in 2023, reflecting a compound annual growth rate (CAGR) of 8.4% from 2018 to 2023.
Verified
2In the United States, there were 41,190 fitness centers operating in 2023, up 2.1% from the previous year.
Verified
3The European fitness market grew by 6.7% in membership numbers in 2023, reaching 69.3 million members across 57,000 clubs.
Verified
4Asia-Pacific fitness industry revenue is projected to hit $28.5 billion by 2027, driven by urbanization and rising disposable incomes.
Directional
5Boutique fitness studios accounted for 12% of total industry revenue in 2023, with a growth rate of 15.2% YoY.
Single source
6The U.S. fitness industry market size was valued at $35.2 billion in 2023, with online fitness segments contributing $4.1 billion.
Verified
7Latin America's fitness sector expanded by 9.8% in 2023, with Brazil leading at 18,500 clubs.
Verified
8Low-cost gym chains like Planet Fitness saw a 12.3% membership increase in 2023, totaling 18.5 million members.
Verified
9The Middle East fitness market is expected to grow at a CAGR of 11.2% from 2024-2028, fueled by wellness tourism.
Directional
10In 2023, the number of fitness apps downloads worldwide surpassed 1.2 billion, boosting hybrid fitness models.
Single source
11Global fitness equipment sales hit $14.6 billion in 2023, with a projected CAGR of 5.9% through 2030.
Verified
12U.S. gym memberships totaled 64.2 million in 2023, representing 20.8% penetration of the adult population.
Verified
13The Australian fitness industry revenue grew 7.9% to AUD 2.8 billion in 2023, with 7,200 clubs.
Verified
14China's fitness club count exceeded 45,000 in 2023, with urban penetration at 3.2%.
Directional
15The wellness real estate segment, including fitness-integrated properties, valued at $1.1 trillion globally in 2023.
Single source
16In 2023, 58% of U.S. fitness consumers were millennials, driving a 4.5% industry growth.
Verified
17The corporate wellness fitness market reached $12.4 billion in 2023, with 15% YoY growth.
Verified
18India's fitness industry is forecasted to reach INR 15,000 crore by 2025, from INR 9,000 crore in 2023.
Verified
19The number of micro-gyms (under 5,000 sq ft) in the U.S. doubled to 8,200 between 2020-2023.
Directional
20Global virtual fitness revenue surged to $7.8 billion in 2023, post-pandemic hybrid shift.
Single source
21U.K. fitness sector revenue hit £4.9 billion in 2023, with 8,200 clubs serving 10.5 million members.
Verified
22The senior fitness market grew 13.4% to $22 billion globally in 2023.
Verified
23Canada’s fitness industry rebounded with $4.2 billion revenue in 2023, up 11% from 2022.
Verified
24Functional fitness studios increased by 22% worldwide from 2021-2023, totaling 15,400 locations.
Directional
25The pet fitness and wellness market, intersecting with human fitness studios, valued at $1.2 billion in 2023.
Single source
26South Korea's fitness club memberships reached 12.1 million in 2023, a 9.6% increase.
Verified
27The adaptive fitness market for disabilities grew to $2.8 billion in 2023, CAGR 10.1%.
Verified
28Mexico's fitness sector expanded to 4,500 clubs in 2023, revenue $2.1 billion USD.
Verified
29The women's only fitness clubs numbered 3,200 globally in 2023, up 18%.
Directional
30Global fitness franchising revenue was $18.7 billion in 2023, with 42,000 franchised units.
Single source

Market Size & Growth Interpretation

The fitness industry is no longer just sweating in a mirrored room; it's a global behemoth splintering into a thousand personalized niches, from budget bulk memberships and digital downloads to senior circuits and pet Pilates, proving that while bodies are built locally, the business of wellness is booming universally.

Operational Metrics

1U.S. fitness studios average 1,850 sq ft size, with 65% utilization rate in 2023.
Verified
2Staff-to-member ratio averages 1:75 in full-service gyms in 2023.
Verified
3Peak hour capacity utilization hits 85% in urban studios, 10-11 AM slots in 2023.
Verified
4Average class size is 18 participants for HIIT, 25 for yoga in 2023.
Directional
5Equipment per member ratio is 1:4 in premium clubs, 1:8 in budget gyms 2023.
Single source
6Member retention rate averages 72% annually for studios with onboarding programs in 2023.
Verified
7Cleaning protocols cost 3.2 hours daily per 5,000 sq ft studio in 2023.
Verified
8Check-in tech adoption at 88%, reducing no-shows by 22% in 2023.
Verified
9Average studio opens 5:30 AM, closes 10 PM, 105 hours/week in 2023.
Directional
10Trainer certification compliance at 94%, with NASM/ACE holding 62% share in 2023.
Single source
11Locker room usage peaks at 45% capacity post-peak hours in 2023.
Verified
12Inventory turnover for retail is 4.2x annually in studios 2023.
Verified
13HVAC energy consumption averages 40% of utilities in large gyms 2023.
Verified
14Waitlist management software used by 76% of studios, filling 68% slots in 2023.
Directional
15Front desk staffing averages 1.8 FTE during off-peak in 2023.
Single source
16Towel/laundry costs $0.45 per use, 1,200 uses/week avg studio 2023.
Verified
17Member feedback surveys yield 4.3/5 NPS average in high-retention studios 2023.
Verified
18Parking utilization 72% during peaks for suburban gyms in 2023.
Verified
19POS system transaction speed averages 12 seconds in modern studios 2023.
Directional
20Seasonal staff turnover 28% in summer, training costs $1,200/new hire 2023.
Single source
21WiFi bandwidth averages 150 Mbps needed per 100 members in 2023.
Verified
22Group class instructor utilization 82%, teaching 22 classes/month avg 2023.
Verified
23Maintenance downtime for equipment <2% annually in top studios 2023.
Verified
24Digital signage boosts class sign-ups 17% in equipped studios 2023.
Directional
2524/7 unmanned studios grew 35% to 4,200 locations in U.S. 2023.
Single source
26Hybrid fitness (in-person + virtual) adopted by 91% of studios in 2023.
Verified

Operational Metrics Interpretation

The data paints a picture of a modern fitness studio as a high-wire act of human logistics, where every minute of staff time, every square foot of space, and every watt of energy is meticulously optimized to keep members from becoming statistics themselves.

Trends & Future Outlook

1HIIT remains #1 trend, with wearable tech integration up 45% in studios 2024 forecast.
Verified
2AI-personalized workouts projected to capture 25% of PT market by 2027.
Verified
3Recovery tech (cryotherapy/sauna) in 42% of premium studios by 2024.
Verified
4Gamified fitness apps to grow 28% CAGR, integrating with studios by 2028.
Directional
5Wellness tourism fitness packages expected $1 trillion segment by 2027.
Single source
6Metaverse virtual gyms projected 300,000 users by end-2025.
Verified
7Sustainable/eco-friendly studios to rise 40% by 2026, green certifications.
Verified
8Mental health-focused classes (mindfulness) up 62% in offerings 2023-2024.
Verified
9Home-studio hybrid models to dominate 55% consumer preference by 2027.
Directional
10Women's strength training participation up 34% since 2020, ongoing trend.
Single source
11Outdoor fitness events to generate $5.2B by 2028, studio partnerships.
Verified
12Nutrition coaching bundled in 67% studios by 2025 projection.
Verified
13VR fitness immersion growing 50% YoY, 12% studio adoption 2024.
Verified
14Corporate EHS (employee health studios) to expand 22% CAGR to 2030.
Directional
15Inclusive fitness for all abilities in 78% new studio builds by 2026.
Single source
16Sleep-optimized fitness programs emerging, 15% market share by 2027.
Verified
17Blockchain loyalty programs in 23% chains by 2025 for retention.
Verified
18Plant-based recovery products sales up 41% in studios 2023-2024.
Verified
19Micro-workouts (10-min sessions) 35% of app usage, studio adaptation.
Directional
20Biohacking labs in high-end gyms, 18% growth projected 2024-2028.
Single source
21Community-driven pop-up studios to 10,000 locations by 2027.
Verified
22Voice-activated gym controls in 31% smart studios by 2025.
Verified
23Longevity fitness (anti-aging) market $27B by 2030.
Verified
24Social media live classes 48% of digital engagement in 2024.
Directional
25E-sports fitness crossovers emerging, 5% studio pilots 2024.
Single source
26Personalized nutrition kiosks in 14% clubs by end-2025.
Verified
27Climate-adaptive indoor cycling up 29% amid weather volatility.
Verified
2875% studios plan AI chatbots for member service by 2026.
Verified

Trends & Future Outlook Interpretation
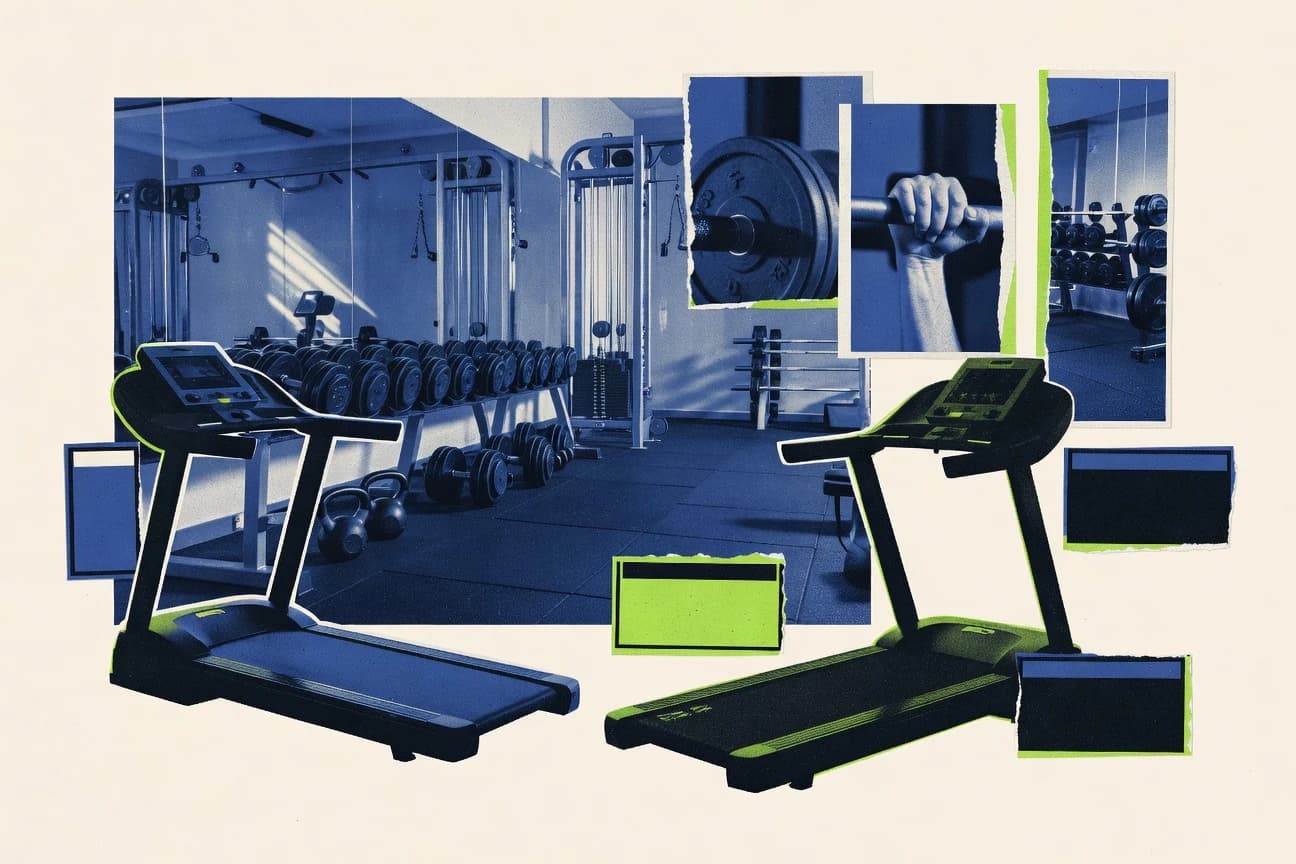
The future of fitness isn't just about punishing your body anymore, but about your smartwatch, AI coach, and cryo-chamber collaborating to perfectly optimize your biohacked wellness so you can then brag about it from a virtual gym or a sustainable pop-up studio before enjoying a plant-based recovery smoothie.

Sources & References

  • IHRSA logo
    Reference 1
    IHRSA
    ihrsa.org
    Visit source
  • IBISWORLD logo
    Reference 2
    IBISWORLD
    ibisworld.com
    Visit source
  • EUROPEACTIVE logo
    Reference 3
    EUROPEACTIVE
    europeactive.eu
    Visit source
  • STATISTA logo
    Reference 4
    STATISTA
    statista.com
    Visit source
  • MINDBODYONLINE logo
    Reference 5
    MINDBODYONLINE
    mindbodyonline.com
    Visit source
  • GRANDVIEWRESEARCH logo
    Reference 6
    GRANDVIEWRESEARCH
    grandviewresearch.com
    Visit source
  • INVESTOR logo
    Reference 7
    INVESTOR
    investor.planetfitness.com
    Visit source
  • SENSOR-TOWER logo
    Reference 8
    SENSOR-TOWER
    sensor-tower.com
    Visit source
  • MARKETSANDMARKETS logo
    Reference 9
    MARKETSANDMARKETS
    marketsandmarkets.com
    Visit source
  • AUSLEISURE logo
    Reference 10
    AUSLEISURE
    ausleisure.com.au
    Visit source
  • CHINADAILY logo
    Reference 11
    CHINADAILY
    chinadaily.com.cn
    Visit source
  • GLOBALWELLNESSINSTITUTE logo
    Reference 12
    GLOBALWELLNESSINSTITUTE
    globalwellnessinstitute.org
    Visit source
  • ACSM logo
    Reference 13
    ACSM
    acsm.org
    Visit source
  • FORTUNEBUSINESSINSIGHTS logo
    Reference 14
    FORTUNEBUSINESSINSIGHTS
    fortunebusinessinsights.com
    Visit source
  • FICCI logo
    Reference 15
    FICCI
    ficci.in
    Visit source
  • CLUBINDUSTRY logo
    Reference 16
    CLUBINDUSTRY
    clubindustry.com
    Visit source
  • PWC logo
    Reference 17
    PWC
    pwc.com
    Visit source
  • UKACTIVE logo
    Reference 18
    UKACTIVE
    ukactive.com
    Visit source
  • GLOBALDATA logo
    Reference 19
    GLOBALDATA
    globaldata.com
    Visit source
  • HEALTHANDFITNESS logo
    Reference 20
    HEALTHANDFITNESS
    healthandfitness.org
    Visit source
  • LESMILLS logo
    Reference 21
    LESMILLS
    lesmills.com
    Visit source
  • KOREAFITNESS logo
    Reference 22
    KOREAFITNESS
    koreafitness.org
    Visit source
  • WOMENSFITNESSALLIANCE logo
    Reference 23
    WOMENSFITNESSALLIANCE
    womensfitnessalliance.org
    Visit source
  • FRANCHISETIMES logo
    Reference 24
    FRANCHISETIMES
    franchisetimes.com
    Visit source
  • GLOFOX logo
    Reference 25
    GLOFOX
    glofox.com
    Visit source
  • MCKINSEY logo
    Reference 26
    MCKINSEY
    mckinsey.com
    Visit source
  • GYMDESK logo
    Reference 27
    GYMDESK
    gymdesk.com
    Visit source
  • AARP logo
    Reference 28
    AARP
    aarp.org
    Visit source
  • GLAAD logo
    Reference 29
    GLAAD
    glaad.org
    Visit source
  • NSCA logo
    Reference 30
    NSCA
    nsca.com
    Visit source
  • PEWRESEARCH logo
    Reference 31
    PEWRESEARCH
    pewresearch.org
    Visit source
  • GROUPFITNESSSUCCESS logo
    Reference 32
    GROUPFITNESSSUCCESS
    groupfitnesssuccess.com
    Visit source
  • CDC logo
    Reference 33
    CDC
    cdc.gov
    Visit source
  • FLEXJOBS logo
    Reference 34
    FLEXJOBS
    flexjobs.com
    Visit source
  • FITBIT logo
    Reference 35
    FITBIT
    fitbit.com
    Visit source
  • PLANTBASEDNEWS logo
    Reference 36
    PLANTBASEDNEWS
    plantbasednews.org
    Visit source
  • SILVERSNEAKERS logo
    Reference 37
    SILVERSNEAKERS
    silversneakers.com
    Visit source
  • ACEFITNESS logo
    Reference 38
    ACEFITNESS
    acefitness.org
    Visit source
  • WOMENSHEALTHMAG logo
    Reference 39
    WOMENSHEALTHMAG
    womenshealthmag.com
    Visit source
  • RURALHEALTHINFO logo
    Reference 40
    RURALHEALTHINFO
    ruralhealthinfo.org
    Visit source
  • ADA logo
    Reference 41
    ADA
    ada.org
    Visit source
  • PETFITNESSALLIANCE logo
    Reference 42
    PETFITNESSALLIANCE
    petfitnessalliance.org
    Visit source
  • WWW ANYTIMEFITNESS logo
    Reference 43
    WWW ANYTIMEFITNESS
    www Anytimefitness.com
    Visit source
  • ISSAONLINE logo
    Reference 44
    ISSAONLINE
    issaonline.com
    Visit source
  • SPORTSBUSINESSJOURNAL logo
    Reference 45
    SPORTSBUSINESSJOURNAL
    sportsbusinessjournal.com
    Visit source
  • WELLSTEPS logo
    Reference 46
    WELLSTEPS
    wellsteps.com
    Visit source
  • CLUBMANAGEMENT logo
    Reference 47
    CLUBMANAGEMENT
    clubmanagement.net
    Visit source
  • ENERGY logo
    Reference 48
    ENERGY
    energy.gov
    Visit source
  • INSUREON logo
    Reference 49
    INSUREON
    insureon.com
    Visit source
  • BLS logo
    Reference 50
    BLS
    bls.gov
    Visit source
  • FITNESS-EQUIPMENT-DEPRECIATION-GUIDE-2024 logo
    Reference 51
    FITNESS-EQUIPMENT-DEPRECIATION-GUIDE-2024
    fitness-equipment-depreciation-guide-2024
    Visit source
  • PELOTON logo
    Reference 52
    PELOTON
    peloton.com
    Visit source
  • VENDINGMARKETWATCH logo
    Reference 53
    VENDINGMARKETWATCH
    vendingmarketwatch.com
    Visit source
  • IRS logo
    Reference 54
    IRS
    irs.gov
    Visit source
  • SBA logo
    Reference 55
    SBA
    sba.gov
    Visit source
  • CLUBREFERRALS logo
    Reference 56
    CLUBREFERRALS
    clubreferrals.com
    Visit source
  • GYMMARKETINGGENIE logo
    Reference 57
    GYMMARKETINGGENIE
    gymmarketinggenie.com
    Visit source
  • FRANCHISEBUSINESSREVIEW logo
    Reference 58
    FRANCHISEBUSINESSREVIEW
    franchisebusinessreview.com
    Visit source
  • TECHNOGYM logo
    Reference 59
    TECHNOGYM
    technogym.com
    Visit source
  • SQUAREUP logo
    Reference 60
    SQUAREUP
    squareup.com
    Visit source
  • FITNESS-EQUIPMENT-ASSOCIATION logo
    Reference 61
    FITNESS-EQUIPMENT-ASSOCIATION
    fitness-equipment-association.org
    Visit source
  • ISSAFACILITYSERVICES logo
    Reference 62
    ISSAFACILITYSERVICES
    issafacilityservices.com
    Visit source
  • ANYTIMEFITNESS logo
    Reference 63
    ANYTIMEFITNESS
    anytimefitness.com
    Visit source
  • NASM logo
    Reference 64
    NASM
    nasm.org
    Visit source
  • ENERGYSTAR logo
    Reference 65
    ENERGYSTAR
    energystar.gov
    Visit source
  • COMMERCIALLAUNDRYNEWS logo
    Reference 66
    COMMERCIALLAUNDRYNEWS
    commerciallaundrynews.com
    Visit source
  • QUALTRICS logo
    Reference 67
    QUALTRICS
    qualtrics.com
    Visit source
  • ICSC logo
    Reference 68
    ICSC
    icsc.org
    Visit source
  • LIGHTSPEEDHQ logo
    Reference 69
    LIGHTSPEEDHQ
    lightspeedhq.com
    Visit source
  • SHRM logo
    Reference 70
    SHRM
    shrm.org
    Visit source
  • CISCO logo
    Reference 71
    CISCO
    cisco.com
    Visit source
  • SCREENCLOUD logo
    Reference 72
    SCREENCLOUD
    screencloud.com
    Visit source
  • GREENBIZ logo
    Reference 73
    GREENBIZ
    greenbiz.com
    Visit source
  • DELOITTE logo
    Reference 74
    DELOITTE
    deloitte.com
    Visit source
  • WOMENSSTRENGTHCOALITION logo
    Reference 75
    WOMENSSTRENGTHCOALITION
    womensstrengthcoalition.org
    Visit source
  • ALLIEDMARKETRESEARCH logo
    Reference 76
    ALLIEDMARKETRESEARCH
    alliedmarketresearch.com
    Visit source
  • SLEEPFOUNDATION logo
    Reference 77
    SLEEPFOUNDATION
    sleepfoundation.org
    Visit source
  • NUTRAINGREDIENTS logo
    Reference 78
    NUTRAINGREDIENTS
    nutraingredients.com
    Visit source
  • ALEXA logo
    Reference 79
    ALEXA
    alexa.com
    Visit source
  • HOOTSUITE logo
    Reference 80
    HOOTSUITE
    hootsuite.com
    Visit source
  • NEWZOO logo
    Reference 81
    NEWZOO
    newzoo.com
    Visit source
  • NUTRA logo
    Reference 82
    NUTRA
    nutra.com
    Visit source
  • SCHWINNFITNESS logo
    Reference 83
    SCHWINNFITNESS
    schwinnfitness.com
    Visit source
  • GARTNER logo
    Reference 84
    GARTNER
    gartner.com
    Visit source

Logos provided by Logo.dev

On this page

  1. 01Key Takeaways
  2. 02Consumer Behavior & Demographics
  3. 03Financial Performance
  4. 04Market Size & Growth
  5. 05Operational Metrics
  6. 06Trends & Future Outlook
James Okoro

James Okoro

Author

Katherine Brennan
Fact Checker

Our Commitment to Accuracy

  • Rigorous fact-checking process
  • Data from reputable sources
  • Regular updates to ensure relevance
Learn more

Explore More In This Category

  • Japan Fitness Industry Statistics
  • Fitness Industry Statistics
  • Gcc Fitness Industry Statistics
  • Sauna Statistics
  • Group Fitness Industry Statistics
  • Health Club Industry Statistics