
Global marine fisheries catch 2.7 billion animals as bycatch each year. The annual total reaches an estimated 7.3 million tonnes. Around 40 percent of global marine catch is discarded at sea, and 64 percent of fish species face bycatch risk in at least one region.
Key Takeaways
- 2.7 billion animals are caught as bycatch each year in global marine fisheries, representing an estimated 7.3 million tonnes of bycatch annually
- Around 40% of global marine catch is estimated to be discarded at sea as bycatch/discards, varying by fishery and region
- 64% of fish species are impacted by fisheries as bycatch in at least one region, according to a global assessment of marine bycatch risk
- €1.0 billion+ per year has been cited as administrative/compliance costs associated with discard bans and reporting burdens in EU fisheries management (reported in impact assessments)
- A 2020 meta-analysis found that bycatch reduction measures tend to have small-to-moderate economic impacts relative to baseline, with average effects varying by gear and measure
- Selective gear adoption can reduce discard rates and generate net benefits; one bioeconomic assessment estimated potential profitability gains from using species-selective trawl modifications under certain conditions
- NOAA estimates that BRDs (bycatch reduction devices) can reduce bycatch in shrimp trawl fisheries by up to 50% for some target regions/species
- For longline fisheries, weighted line devices can reduce seabird bycatch; controlled studies report reductions often in the range of 50% or more relative to unweighted baselines
- In Danish and North Sea trials, square-mesh codends increased cod selectivity; studies report cod retention increases while reducing undersized bycatch by measurable percentages (trial results)
- The EU’s Data Collection Framework requires recording of bycatch/discards data; Member State submissions support reported monitoring coverage for discard and bycatch sampling under DCF
- Smart gear trials using computer vision/AI in ports can classify bycatch items in near-real-time; pilot reports report precision/accuracy in the 80–90% range for specific taxonomic groups
- Satellite Vessel Monitoring Systems (VMS) transmit positions at set intervals; EU reporting indicates fleets using VMS for compliance under control regulations
- In 2022, FAO reported that 34% of global fish stocks were fished at biologically sustainable levels with trends; bycatch is a major pressure on impacted biodiversity and management decisions
- The EU Landing Obligation (discard ban) applies to EU fisheries, requiring that catches of regulated species be landed; adoption timelines are set in Regulation (EU) No 1380/2013
- NEAFC measures for bycatch reporting and control are implemented through binding regulations; annual records show adoption of specific bycatch-related requirements
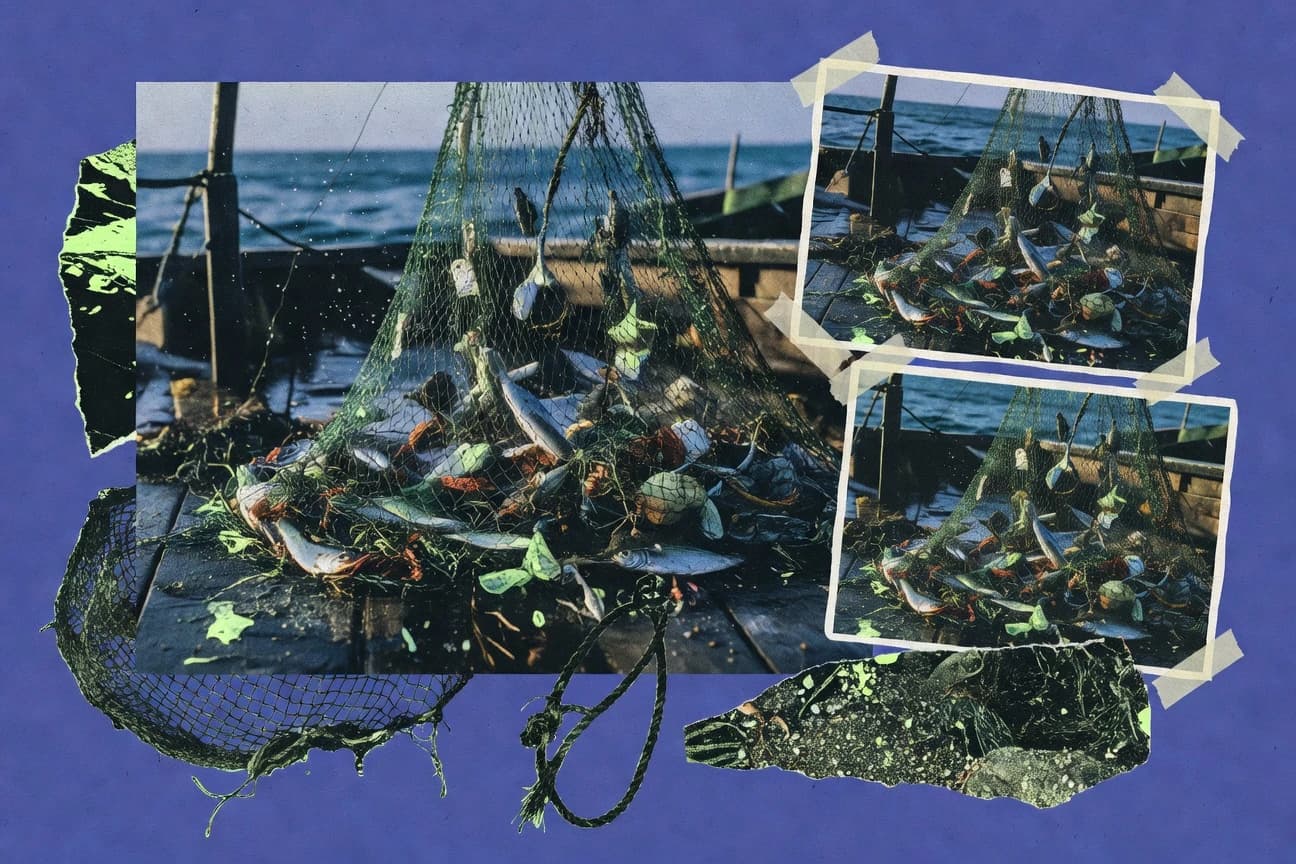
Bycatch harms billions of marine animals each year, with seabirds and turtles among the most affected.
Related reading
01 · Category
Industry Estimates21 stats
01
2.7 billion animals are caught as bycatch each year in global marine fisheries, representing an estimated 7.3 million tonnes of bycatch annually
02
Around 40% of global marine catch is estimated to be discarded at sea as bycatch/discards, varying by fishery and region
03
64% of fish species are impacted by fisheries as bycatch in at least one region, according to a global assessment of marine bycatch risk
04
Annual bycatch mortality for seabirds in global fisheries is estimated at 200,000–400,000 birds killed per year
05
Sea turtle bycatch in global fisheries is estimated at 6,000–40,000 individuals per year based on synthesis of regional estimates
06
Marine mammal bycatch in fishing operations is estimated at 300,000 individuals annually in global waters (mean of available estimates)
07
Chronic bycatch is a major contributor to declining pelagic shark populations; for several species, fisheries bycatch mortality has been identified as a key driver
08
Estimated bycatch of seabirds by longline fisheries is on the order of 200,000–300,000 birds annually (global range estimate)
09
Bycatch of marine mammals occurs across multiple gear types; in observer datasets, trawl fisheries are among the highest bycatch sources by mortality per unit effort
10
Observer coverage in many industrial fisheries remains limited; in some regions, fewer than 5–10% of trips are observed, reducing detection of bycatch events
11
In 2023, 95% of global ocean fishing effort is estimated to be unreported in a way that prevents perfect bycatch measurement; observed data is used to estimate bycatch rates
12
In 2019, global marine fisheries bycatch and discards were estimated as the majority of total catch mortality for many non-target groups in some assessments
13
A global synthesis estimated that bycatch is responsible for significant proportions of seabird population declines; one review quantified that seabirds are among the most affected taxa
14
Across observer datasets, bycatch rates for some taxa show overdispersion with tail events; studies report variance several times higher than mean for bycatch per tow/trip
15
For trawl fisheries, discard-to-catch ratios can range widely; studies report discard fractions exceeding 20% for some fleets and years based on regional sampling
16
In the North Sea, selective codend mesh sizes have been shown to measurably reduce undersized fish by lowering catch of sub-legal individuals (documented percent reductions in trials)
17
Bycatch of sharks and rays can be substantial; a study on global elasmobranch fisheries estimated millions of individuals incidentally captured as bycatch annually
18
In shrimp trawl fisheries, TED adoption is associated with large reductions in sea turtle bycatch; compliance requirement and monitoring are described with reported effectiveness
19
Longline seabird bycatch mitigation effectiveness is supported by controlled studies; weighted lines reduce seabird bycatch measurably (with quantified percent reductions)
20
A review reported that gear modifications for selective fishing generally yield bycatch reductions in the tens of percent to >50% range, depending on measure and species
21
A global assessment estimated that marine debris, including fishing gear contributing to ghost fishing, causes measurable mortality; ghost gear mitigation actions quantify gear removed in kg and items
Interpretation
Industry Estimates Interpretation
Industry estimates suggest bycatch is a massive, persistent reality of global fisheries, with about 2.7 billion animals and roughly 7.3 million tonnes caught each year and around 40% of marine catch discarded at sea.
02 · Category
Cost Analysis4 stats
01
€1.0 billion+ per year has been cited as administrative/compliance costs associated with discard bans and reporting burdens in EU fisheries management (reported in impact assessments)
02
A 2020 meta-analysis found that bycatch reduction measures tend to have small-to-moderate economic impacts relative to baseline, with average effects varying by gear and measure
03
Selective gear adoption can reduce discard rates and generate net benefits; one bioeconomic assessment estimated potential profitability gains from using species-selective trawl modifications under certain conditions
04
The U.S. at-sea observer program operating costs have been reported in the hundreds of millions of dollars over multi-year periods for maintaining coverage and training
Interpretation
Cost Analysis Interpretation
Cost analysis shows that bycatch management can come with very large compliance burdens, such as over €1.0 billion per year in EU administrative and reporting costs, yet the broader evidence still suggests that targeted measures and selective gear changes often deliver small to moderate economic effects and, in some cases, even potential profitability gains.
03 · Category
Mitigation Effectiveness8 stats
01
NOAA estimates that BRDs (bycatch reduction devices) can reduce bycatch in shrimp trawl fisheries by up to 50% for some target regions/species
02
For longline fisheries, weighted line devices can reduce seabird bycatch; controlled studies report reductions often in the range of 50% or more relative to unweighted baselines
03
In Danish and North Sea trials, square-mesh codends increased cod selectivity; studies report cod retention increases while reducing undersized bycatch by measurable percentages (trial results)
04
Chafing gear modifications in trawl fisheries can reduce damage and retain non-target species; experimental trials report reductions in non-target catch/escape rates by specific percentages
05
Real-time closure systems using risk-based triggers can reduce spatial overlap with sensitive species; pilot evaluations report bycatch reductions quantified in observed datasets
06
Salmon bycatch in fisheries can be reduced by improved gear selectivity; studies report measurable reductions in non-target salmon catch percentages after adopting modified gear
07
Acoustic deterrents can reduce bycatch in some settings; controlled experiments report measurable decreases in target species/bycatch interactions by percent reductions
08
Seasonal closures reduce bycatch by limiting fishing in sensitive periods; evaluations of time-area closures report measurable reductions in bycatch events in protected windows
Interpretation
Mitigation Effectiveness Interpretation
Across these mitigation measures, the strongest trend is that well-targeted gear and management changes can cut bycatch substantially, with many studies reporting reductions around 50% or more, such as up to 50% for shrimp trawls with BRDs and often 50% or greater for longline seabird bycatch using weighted line devices.
More related reading
04 · Category
Technology Adoption9 stats
01
The EU’s Data Collection Framework requires recording of bycatch/discards data; Member State submissions support reported monitoring coverage for discard and bycatch sampling under DCF
02
Smart gear trials using computer vision/AI in ports can classify bycatch items in near-real-time; pilot reports report precision/accuracy in the 80–90% range for specific taxonomic groups
03
Satellite Vessel Monitoring Systems (VMS) transmit positions at set intervals; EU reporting indicates fleets using VMS for compliance under control regulations
04
Remote electronic logbooks for fisheries can increase timeliness of bycatch reporting; program evaluations report faster reporting cycles (days vs weeks)
05
AI-assisted image-based discard estimation is being adopted; some government/industry pilots report that automated counting reduced manual labor by 50% in trials
06
Drones (UAVs) are used for maritime surveillance and can provide targeted counts; pilots report coverage of survey areas within hours (e.g., 20–50 km transects per flight day)
07
Electronic cameras and sensors onboard/at-landing can provide continuous footage; in EM systems, percent of footage retained/flagged for review is quantified in program technical docs (e.g., >90% of trips processed)
08
Bycatch reporting apps for fishers in some initiatives capture structured bycatch events; initiative reports quantify adoption by number of participating vessels (dozens to hundreds)
09
GPS-based gear monitoring can identify when gear deployment overlaps with protected areas; pilot results report reduction in violation events measured as a percentage drop
Interpretation
Technology Adoption Interpretation
Across the technology adoption efforts, near real time and automation are becoming operational, with AI and smart gear pilots reporting 80 to 90 percent accuracy for specific groups and automated counting cutting manual labor by about 50 percent, while remote and electronic reporting shortens bycatch report turnaround from weeks to days.
05 · Category
Policy And Regulation9 stats
01
In 2022, FAO reported that 34% of global fish stocks were fished at biologically sustainable levels with trends; bycatch is a major pressure on impacted biodiversity and management decisions
02
The EU Landing Obligation (discard ban) applies to EU fisheries, requiring that catches of regulated species be landed; adoption timelines are set in Regulation (EU) No 1380/2013
03
NEAFC measures for bycatch reporting and control are implemented through binding regulations; annual records show adoption of specific bycatch-related requirements
04
US bycatch reform under the Magnuson-Stevens Act includes annual catch limits and accountability measures; implementation reports quantify changes in management coverage
05
Internationally, the Agreement on Port State Measures (PSMA) requires inspection of catches; inspection actions quantify the scale of bycatch-risk detection at ports
06
The U.N. FAO International Guidelines for Bycatch Management and Reduction of Discards (2019) provide a quantified framework adopted by member states in formal FAO guidance
07
Convention on Biological Diversity (CBD) has decisions on bycatch of marine species; the number of COP decisions addressing bycatch is recorded across official decision documents
08
IWC-managed Antarctic krill fisheries include bycatch risk management measures; conservation measures specify operational requirements and monitoring for interactions
09
The EU Control Regulation requires vessel monitoring and cross-checking of catches; Articles specify obligations that impact bycatch/discards reporting compliance
Interpretation
Policy And Regulation Interpretation
Across policy frameworks, bycatch is increasingly treated as a concrete management lever, with FAO noting that only 34% of global fish stocks are fished at biologically sustainable levels in 2022 while EU, US, and international rules such as landing obligations, port state inspections, and catch accountability measures are designed to tighten bycatch reporting and control.
Reference
Cite This Report
This report is designed to be cited. We maintain stable URLs and versioned verification dates. Copy the format appropriate for your publication below.
APA
Daniel Varga. (2026, February 13). Bycatch Statistics. Gitnux. https://gitnux.org/bycatch-statistics
MLA
Daniel Varga. "Bycatch Statistics." Gitnux, 13 Feb 2026, https://gitnux.org/bycatch-statistics.
Chicago
Daniel Varga. 2026. "Bycatch Statistics." Gitnux. https://gitnux.org/bycatch-statistics.
Sources & references
51 datasets cited across this report · attribution is report-level
+30 additional datasets cited (not shown individually)