Take a thrilling ride with us as we explore not only the exhilarating liberations of cycling, but also dive deeper into a less thrilling arena – biking accidents statistics. The rising popularity of biking, whether for leisure, sport, or a means of daily commuting, brings a related increase in biking-related accidents.
From slight scrapes to more severe incidents, delving into the statistical world of these occurrences can help cyclists understand the dynamics involved. By grasifying this data, you can better prepare, protect yourself, and continue to revel in the joy of cycling while reducing the risks that come along with it. Let’s pedal into an insightful exploration of biking accidents statistics.
The Latest Biking Accidents Statistics Unveiled
In 2018, there were 857 bicyclists killed in traffic crashes in the United States.
Delving into the harrowing data of 2018, the United States identified a chilling number of 857 cyclists who never made it home, their journeys tragically cut short by traffic incidents. This stark number is not just ink on paper nor a digit on a screen, but a somber reminder of the risks bicycle enthusiasts often cope with on American roads. It anchors our understanding of the gravity of biking hazards, making the invisible toll of traffic safety hardly ignorable.
Shedding light on this disconcerting reality can provoke vital conversation and action regarding traffic discipline, infrastructure upgrade, policy changes, or perhaps even innovative safety technologies, with an ultimate aim of making our roads safer for every pedal pusher out there.
In the US, most bike fatalities happen between 6 P.M. and 9 P.M., according to 2017 results.
Highlighting the detail that a significant number of bike fatalities in the US occur between 6 P.M. and 9 P.M., as per the 2017 results, casts a spotlight on the potentially perilous time frame for cyclists. This underlines the need for extra caution during these hours.
The revelation not only sharpens the reader’s awareness about the risky hours but also invites further conversation about the reasons behind it. Is it because of reduced visibility during dusk, increased traffic, or perhaps most cyclists are out on the roads during this time period? Questions like these make this statistic a vital cog in the discussions about biking accident statistics and can aid in formulating preventive measures.
In 2019, 846 bicyclists were killed in traffic crashes.
Threaded into the narrative of our blog post on Biking Accidents Statistics, the numbers speak volumes and sadly, a disconcerting 846 bicyclists fell victim to traffic mishaps in 2019 alone. This chilling figure sets a stark reality check, adding an aura of gravity to our topic and urging us to delve deeper.
Viewed beyond mere numbers, it echoes the urgency for improved safety measures, responsible driving, and the importance of preventive actions in possibly curtailing such incidents in the future. While statistics are often seen as monotonous data, such figures contribute to the driving force behind our persistent efforts to understand, analyze, and address biking accidents on a broader scale.
The majority of deadly bicycle offenses, 60% in 2017, occurred in urban areas.
Drilling down into the labyrinth of data surrounding biking accidents, one piece of information stands out starkly – in 2017, the larger slice of the pie, an unsettling 60%, of fatal bicycle incidences rose from the bustling, congested streets of our urban areas. In the context of a blog post dedicated to biking accident statistics, this jarring number not only anchors the narrative, but inevitably drives the discourse around possible solutions.
It sharpens the focus on urban cycling safety, pushing for safer infrastructure and conscious development planning. Further, it highlights an urgent necessity to educate city dwellers – both cyclists and motorists, about sharing the streets harmoniously and conscientiously.
Moreover, this statistic fuels advocacy for better laws on city biking, their strict implementation and vigilance on adherence. Thus, the 60% urban fatality rate in 2017 serves as an imperative wake-up call, offering bloggers, cyclists, city planners, lawmakers, and drivers alike a common ground to rally on and a specific problem to tackle.
States like California, Florida, and Texas consistently have the highest number of bicyclist fatalities annually.
Highlighting the elevated number of bicycling fatal incidents in states such as California, Florida, and Texas pours a spotlight on these regions, making it crucial to dissect further. This statistical tally serves as a warning bell, cautioning cyclists about the heightened risks in these areas and possibly motivating them to take extra precautions.
In essence, it adds a geographical layer to our understanding of bike accidents, underscoring that certain areas might inherently possess more hazards than others. Moreover, it prompts questioning and investigating into the root causes—whether it is demographic density, inadequate cycling infrastructures, or unfavorable traffic norms—that are fueling these numbers.
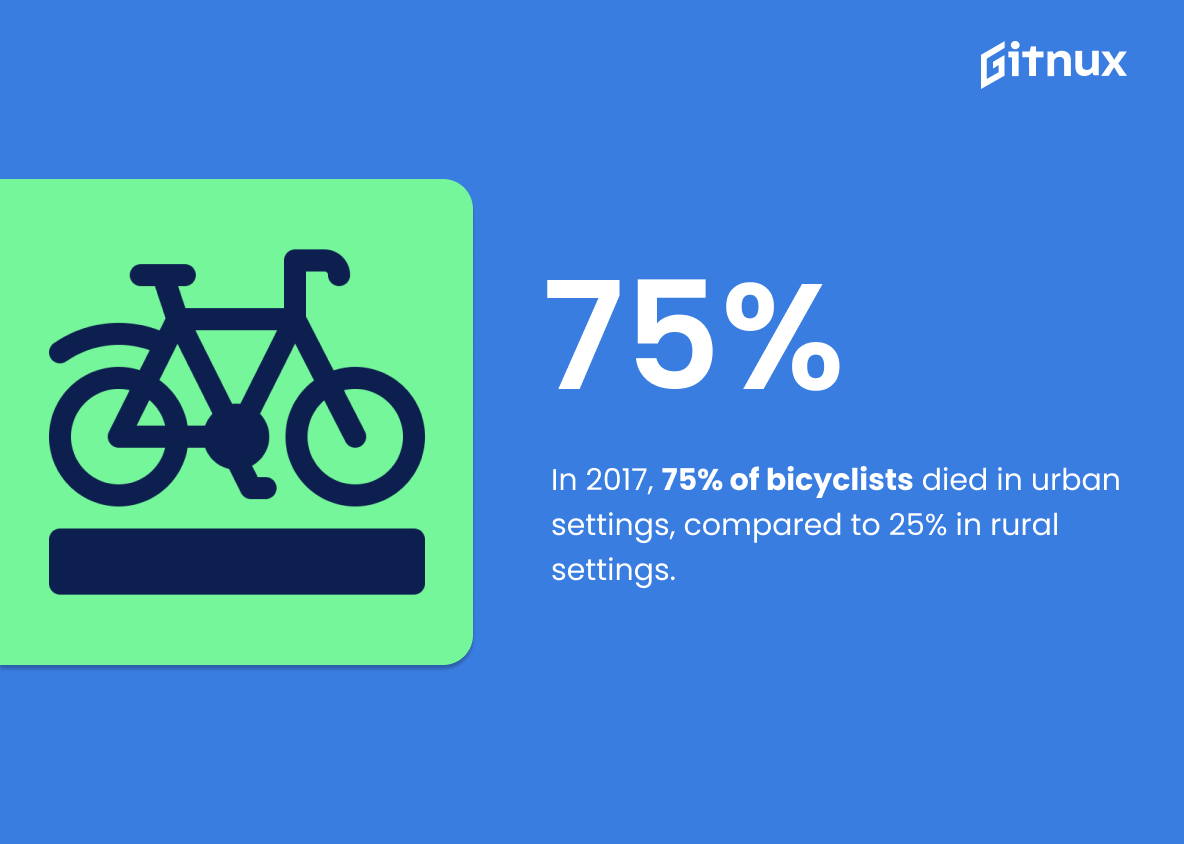
In 2017, 75% of bicyclists died in urban settings, compared to 25% in rural settings.
Taking a close look at this striking piece of data, it directs us to a stark revelation about the safety of bicyclists. The urban sprawl, known for its hustle and bustle, put forth a daunting picture of bicycle accidents in 2017. With three-quarters of all cycling fatalities happening in cities, this paints a cautionary tale wrapped in urban tarmac. Meanwhile in the contrasting tranquility of the countryside, a mere quarter of the fatal bicycling incidents occurred.
The sharp disparity highlights not just the ground realities of where you are most likely to encounter danger while biking, but also underpins the immediate need for measures to improve urban cycling safety. It simultaneously serves as a strong statistical call-to-arms for city planners, policy makers, and everyday cyclists to make our cities safer for pedal-powered journeys.
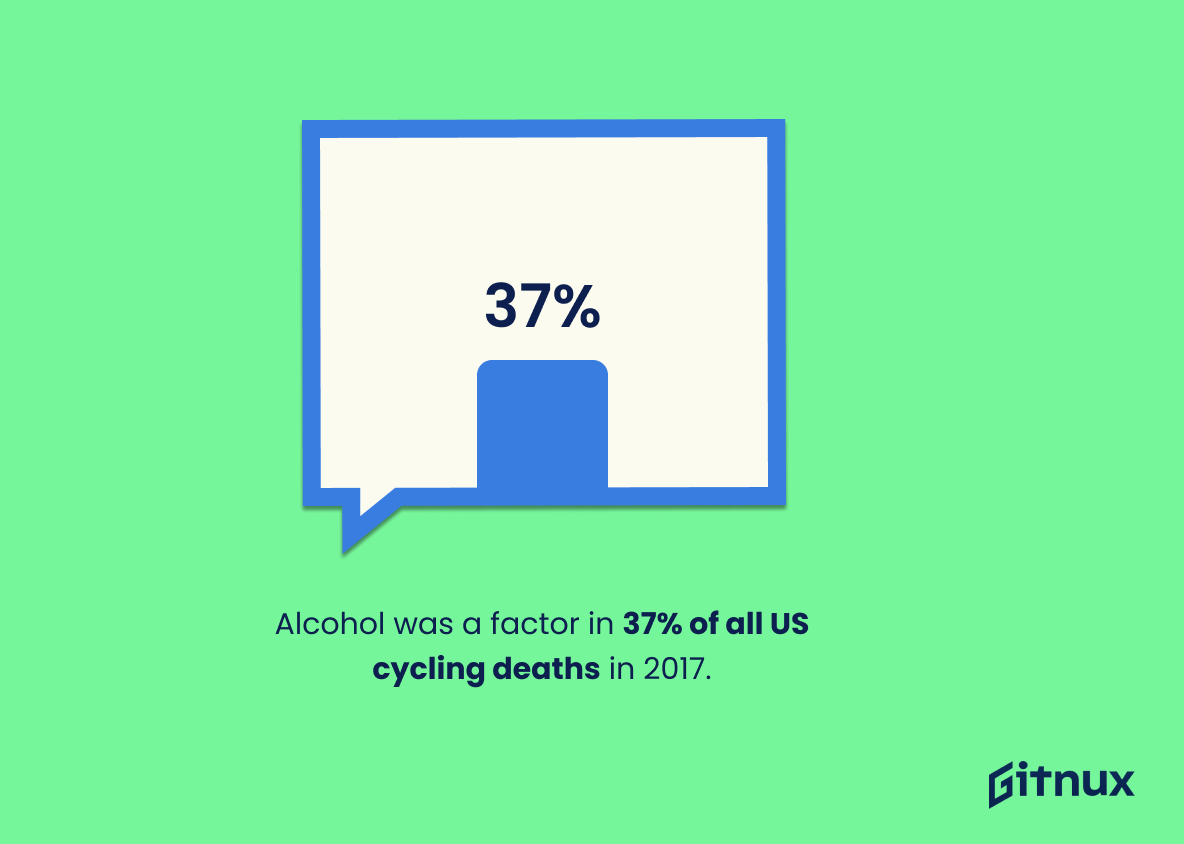
Alcohol was a factor in 37% of all US cycling deaths in 2017.
Delving into the realm of biking accident statistics, one cannot casually overlook the startling yet significant piece of data pointing out that in 2017, alcohol was implicated in 37% of all US cycling fatalities. This provides a sobering caveat to all riders, indicating a tangible and preventable risk on the roads. It serves as a stark reminder that the decisions we make before getting on the bike can have potentially fatal ramifications.
This data point underscores the importance of developing and disseminating safe biking campaigns, specifically ones targeting the hazards of biking under the influence. Moreover, it helps inform local authorities and policy makers, prompting them to take proactive measures like stricter drunken driving laws to curtail such accidents. Conclusively, this statistic is a critical cog in the wider machine of biking safety discourse.
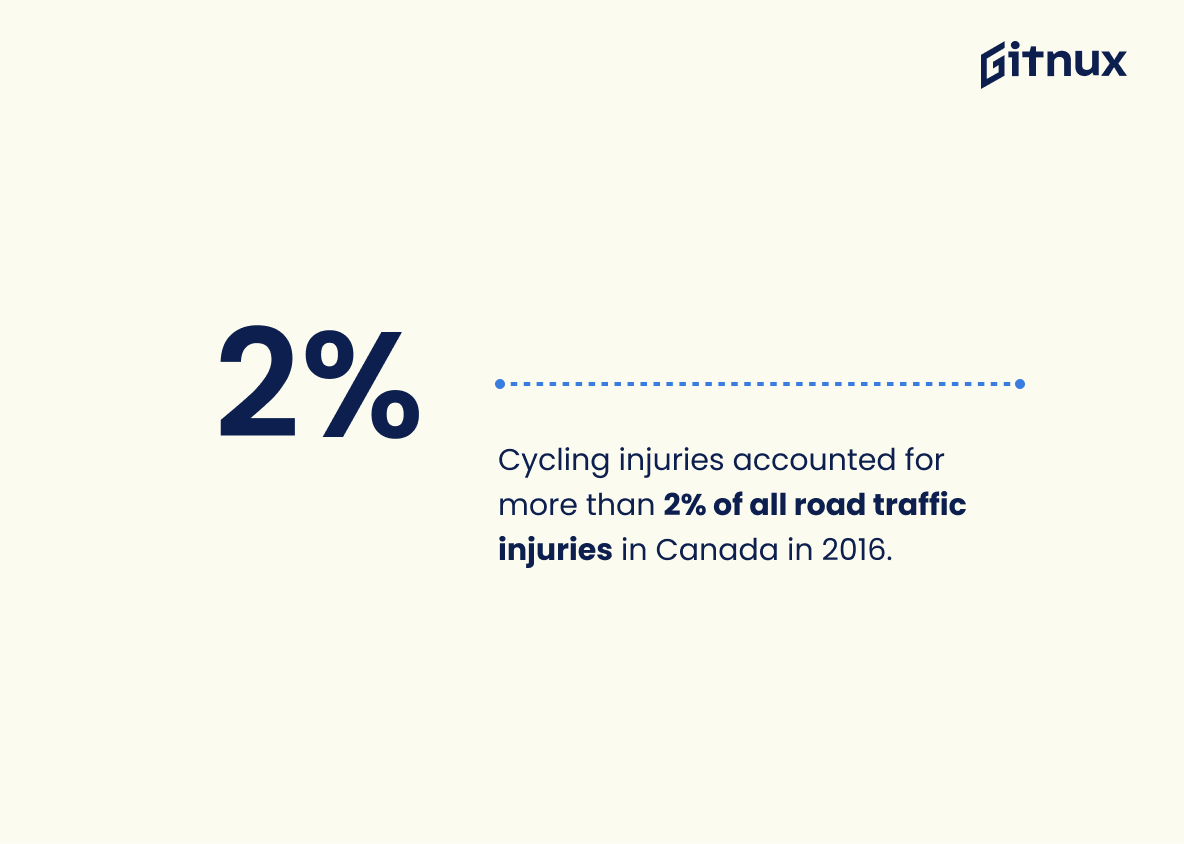
Cycling injuries accounted for more than 2% of all road traffic injuries in Canada in 2016.
The revelation that in 2016, more than 2% of all road traffic injuries in Canada were due to cycling, places a significant spotlight on the vulnerability of cyclists on Canadian roads. This concrete statistic underscores the pressing imperative to heighten awareness, shore up safety measures, and implement more cyclist-friendly policies. As readers traverse the terrain of Canadian biking accidents statistics in this blog post, the stark figures serve as a poignant reminder of every pedal’s potential perils, thus emphasizing the urgency for change and adaptation.
Men are at higher risk for bike fatalities with 88% of people who died in 2017 being male.
Unveiling the truth behind the numbers, one can’t ignore the glaring rooftop siren that 88% of bike-related fatalities in 2017 involved men. This compelling figure draws a very clear picture for readers of our blog post about Biking Accidents Statistics. It paints a stark realities landscape, highlighting the greater vulnerability of men to bike accidents, possibly stemming from factors like riskier behavior, more frequent usage or lesser protective measures. With men on the more threatened side of the biking world, this post emphasizes the urgency for more targeted safety measures and interventions, enabling riders to pedal on safer avenues.
The average age of cyclists killed in crashes was 47 years in 2017.
Highlighting the data that the average age of cyclists killed in crashes was 47 years in 2017 paints a worrying trend for our seasoned bikers. This chilling revelation punctuates the narrative that bike safety is not just a concern for the young or inexperienced. It underscores a grave need for preventative measures and safety precautions for riders of all ages, with an added emphasis on those approaching middle age. This insight serves as a wake-up call to nip misconceptions about cycling safety in the bud and urges a broader discussion about the proactive ways to ensure safety across all age groups.
In 2017, bicyclists ages 20-24 had the highest rate of non-fatal bicycle accidents.
Delving into the graph of biking accidents, an intriguing pattern emerges. In 2017, the peak of the non-fatal bicycle accidents was not monopolized by the young thrill-seekers nor by the older, perhaps less reflexive age groups. Instead, it was the 20-24-year-olds that recorded the highest rate. This reflection throws a glaring spotlight on the age group who, inspite of being in their prime, have been the most susceptible to biking mishaps.
It prompts a cognizant conversation about the possible causative factors—maybe it’s overconfidence, a lack of experience, or just the sheer pressure of the adrenalin rush. More importantly, this revelation should guide biking safety campaigns to target this age bracket more effectively, enhancing safeguards and thus possibly bending the curve of bike accident statistics in a more positive direction.
In the UK, 99 cyclists were killed, 3,707 were seriously injured and 13,744 were slightly injured in 2018.
In the pursuit of unveiling the tangible reality of cycling-related hazards within the UK, it’s vital to delve into the stark numbers observed in 2018. An unsettling toll of 99 cyclists tragically lost their lives, while another 3,707 were confined to the gravely serious realm of injury. Additionally, 13,744 cyclists were left nursing slight injuries.
These tangible numbers serve as an emblematic narrative of unpredictable risks and present a poignant call to action for increased road safety, improved infrastructure, and a more empathetic driving culture. Weaving a picture of the current state of affairs, these compelling figures can guide policy-making, encourage personal responsibility, and fuel the drive towards a safer tomorrow for UK’s blossoming cycling community.
The majority of fatal cycling accidents happen in London, followed by the South East, East of England, and the North West.
Delving into the heart of the given statistic sheds a spotlight on the high-risk zones for cycling accidents across England, with London, the South East, East of England, and the North West occupying the top spots. This insight is particularly of concern for cyclists as it gives them an immediate awareness of where caution is most needed. Furthermore, urban planning authorities, policy makers, and health professionals could leverage this information to strategize and implement safety measures, targeting high-risk areas first.
Overall, it becomes a catalyst for a safer cycling environment, emphasizing the pressing need for intervention in these regions. An understanding of this data brings us one pedal closer to reducing bicycle fatalities and introducing more rigorous safety measures for cyclists, ultimately improving urban cycling conditions.
Cyclist serious injury rates increased by 4.4% from 1,011 to 1,056 in Australia in 2018.
Painting a vivid image of the rising tide of cycling-related perils, the data underscores an alarming 4.4% surge in severe cyclist injuries in Australia in 2018, leaping from 1,011 to 1,056. This uptrend highlights a critical landscape in the biking universe, reinforcing the urgency for robust measures towards accident mitigation and cyclist safety. A profound dissection of this statistic not only propels the talk around biking accidents to the epicenter of the discourse but also intensifies the search for comprehensive solutions to shield the cycling community from such grim realities.
There were 3,222 bicyclists killed in Japan in 2017, a decrease of 330 from the previous year.
In weaving the narrative of biking accidents statistics, the revelation that 3,222 bicyclists met their untimely end on Japan’s roads in 2017 paints a poignant picture. Yet, embedded in this tragedy is a glimmer of hope. The gloomy canvas is brightened somewhat by the reduction of 330 in such fatalities from the preceding year. This indicates progress, albeit gradual, towards creating safer roads for cyclists in the island nation, a reality that illuminates the power of diligent traffic regulations and innovations in safety measures.
Such fluctuation in numbers not only provides a valuable benchmark for policy evaluation but also serves as a poignant reminder of the constant need to prioritize road safety. It’s an evocative testament to the efforts of the past and an imperative for the future—to ensure that every cyclist, whether commuter or leisure rider, is not a potential statistic, but a secure, confident participant on the roads of Japan.
Conclusion
In summary, examining biking accidents statistics offers crucial insights on where, when, and why these accidents occur. It highlights the necessity for more conscious efforts towards comprehensive safety measures for both bikers and drivers. While effective infrastructure, adherence to cycling regulations, safety gear, and public awareness significantly reduce mishaps, there isn’t a single foolproof solution.
Each biker’s safety ultimately lies in the collective responsibility of all road users. Continuous learning, sharing these stats, and promoting safety measures will imperatively create a safer environment for biking. Let’s ride towards that future.
References
0. – https://www.www.cbsc.org
1. – https://www.www.bitre.gov.au
2. – https://www.www.iihs.org
3. – https://www.www.nhtsa.gov
4. – https://www.www.rospa.com
5. – https://www.www.statista.com
6. – https://www.www.bts.gov
