GITNUXSOFTWARE ADVICE
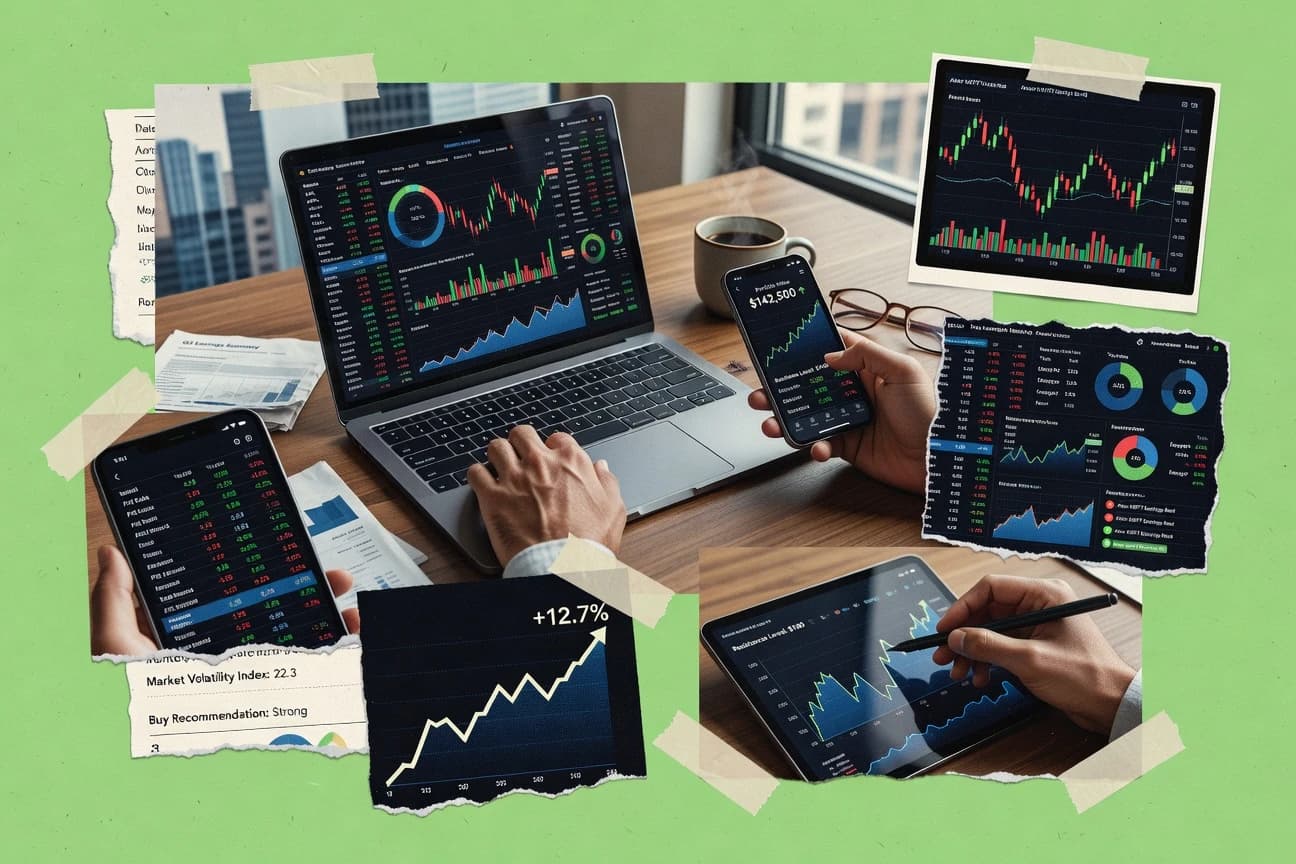
Finance Financial ServicesTop 10 Best Stock Investment Software of 2026
Discover top stock investment software to boost your portfolio. Find tools to simplify trading and maximize returns.

How we ranked these tools
Core product claims cross-referenced against official documentation, changelogs, and independent technical reviews.
Analyzed video reviews and hundreds of written evaluations to capture real-world user experiences with each tool.
AI persona simulations modeled how different user types would experience each tool across common use cases and workflows.
Final rankings reviewed and approved by our editorial team with authority to override AI-generated scores based on domain expertise.
Score: Features 40% · Ease 30% · Value 30%
Gitnux may earn a commission through links on this page — this does not influence rankings. Editorial policy
Editor picks
Three quick recommendations before you dive into the full comparison below — each one leads on a different dimension.
Portfolio Performance
Tax and dividend-aware performance calculations using security lots and transactions
Built for investors tracking taxable lots and performance across multiple accounts.
Quicken
Runner UpInvestment transaction importing and categorization inside Quicken's personal finance ledger
Built for individual investors managing budgeting plus stock records in one app.
Personal Capital
Also GreatNet worth and cash flow dashboards that contextualize stock portfolio performance
Built for investors wanting portfolio tracking plus net-worth and cash-flow analytics.
Related reading
- Finance Financial ServicesTop 10 Best Stock Market Tracking Software of 2026
- Finance Financial ServicesTop 10 Best Investment Advisor Software of 2026
- Finance Financial ServicesTop 10 Best Investment Performance Measurement Software of 2026
- Finance Financial ServicesTop 10 Best Investment Partnership Accounting Software of 2026
Comparison Table
This comparison table evaluates stock investment software across portfolio tracking, performance reporting, and investment analysis tools. It covers options such as Portfolio Performance, Quicken, Personal Capital, Morningstar Portfolio Manager, and TradingView to help readers match features to their trading and long-term tracking needs. Each entry highlights how the tools handle data import, account visibility, and analytics so side-by-side decisions are faster.
Portfolio Performance
desktop trackingTracks investment portfolios, performs performance calculations and tax reporting, and imports transactions from broker exports into a desktop system.
Tax and dividend-aware performance calculations using security lots and transactions
Portfolio Performance stands out by treating portfolio tracking as a data-driven workflow, with flexible transaction imports and customizable reports. The tool supports multi-currency holdings, dividends, taxes, and performance measurement with clear time series views. Detailed graphs, scenario-style analyses, and benchmark comparisons help turn raw brokerage activity into investment insights.
- +Highly configurable portfolio accounting with transactions, dividends, and lots
- +Robust performance reports with benchmarks and drill-down charts
- +Strong import flexibility for brokerage statements and transaction formats
- –Setup of accounts, security identifiers, and tax rules takes time
- –Interface complexity can slow users during initial configuration
- –Advanced reporting customization requires familiarity with the data model
Best for: Investors tracking taxable lots and performance across multiple accounts
More related reading
Quicken
all-in-one personal financeManages personal finance accounts and investment holdings with performance views and transaction tracking inside a consumer finance application.
Investment transaction importing and categorization inside Quicken's personal finance ledger
Quicken stands out for combining personal finance accounting with built-in stock portfolio tracking and transaction categorization. Core capabilities include importing brokerage transactions, tracking holdings and performance, and reconciling investment activity against bank and brokerage feeds.
The app also supports budgeting and net-worth views, which makes it practical for investors who want cash, debt, and investments in one ledger. Reporting is strongest for personal finance summaries rather than advanced portfolio analytics and optimization.
- +Brokerage transaction import reduces manual data entry
- +Portfolio performance views track gains, income, and holdings
- +One system links investments with budgeting and net worth
- +Reconciliation workflows help keep records consistent
- –Advanced portfolio analytics and factor tools are limited
- –Data quality depends heavily on feed and import accuracy
- –Reporting customization for investing is less flexible
- –Workflow can feel heavy for pure stock tracking
Best for: Individual investors managing budgeting plus stock records in one app
Personal Capital
portfolio dashboardAggregates investment accounts into a portfolio dashboard with allocation, fee visibility, and performance reporting across holdings.
Net worth and cash flow dashboards that contextualize stock portfolio performance
Personal Capital (Empower) stands out for merging portfolio tracking with deep personal finance analytics in one place. Stock investing is supported through aggregated holdings, allocation views, and performance reporting alongside cash flow and net worth dashboards.
Risk-oriented insights come through allocation breakdowns and goal-based reporting, which tie investment behavior to broader financial health. The tool also supports importing transactions so portfolio performance and holdings stay aligned with account activity.
- +Comprehensive portfolio analytics with holdings, allocation, and performance views
- +Strong dashboarding that links investing with net worth and cash flow
- +Transaction import helps keep investment data current across accounts
- –Stock-specific research is limited compared with dedicated brokerage analytics
- –Advanced metrics depend on accurate account linking and clean imports
- –Interface can feel dense due to combined investing and financial planning tools
Best for: Investors wanting portfolio tracking plus net-worth and cash-flow analytics
Morningstar Portfolio Manager
portfolio analyticsBuilds and analyzes stock and fund portfolios with risk metrics, performance analytics, and model-recommendation tools.
Portfolio X-Ray style holdings analysis for allocation and risk breakdowns
Morningstar Portfolio Manager stands out for turning multi-account holdings into structured portfolio views with measurable performance and risk analysis. The software supports asset allocation tracking, holdings and transactions import workflows, and scenario-style what-if evaluations for rebalance planning.
It also provides detailed reporting for allocation, performance attribution, and glide-path style monitoring across multiple portfolios. The experience is strongest when portfolio data is already standardized and frequent updates are part of the workflow.
- +Robust portfolio analytics with allocation, risk, and performance reporting
- +Multi-account support that keeps holdings aligned across portfolios
- +Scenario style rebalance planning for allocation changes
- –Setup for importing and reconciling data can be time intensive
- –Less flexible workflows for custom investment processes
- –Reporting screens can feel dense for new users
Best for: Individual investors or advisors needing allocation and risk reporting workflows
TradingView
market analyticsProvides stock charting and portfolio tracking with watchlists, alerts, and performance summaries backed by live market data.
TradingView Pine Script for custom indicators and backtested trading strategies on stock charts
TradingView stands out for chart-first research with tight integration to a large market data and indicator ecosystem. It supports stock charting with customizable indicators, drawing tools, and strategy backtesting using TradingView’s scripting language.
Collaboration features like public ideas and watchlists improve workflow for individual investors and small communities. Real-time alerts and multi-timeframe analysis are central to its daily stock monitoring experience.
- +Highly customizable stock charts with extensive built-in indicators and drawing tools
- +Strategy backtesting and paper trading support scripted systems for repeatable testing
- +Fast alerting with multi-timeframe conditions for disciplined market monitoring
- +Large community of published scripts and trade ideas accelerates research
- +Watchlists, screening by saved ideas, and account sync streamline daily workflows
- –Backtesting limitations exist for realistic slippage, fills, and execution modeling
- –Advanced scripting can feel steep for investors who only want simple screens
- –Sorting and filtering for screening needs can be less direct than dedicated screeners
- –Chart performance can degrade with heavy indicator stacks on lower-end systems
Best for: Active stock investors needing scripted chart analysis, alerts, and community research
Sharesight
investor trackingTracks investments and calculates returns including dividends and realized gains using automated activity uploads.
Dividend and performance attribution with corporate action adjustments across the portfolio
Sharesight stands out for automated portfolio reporting focused on dividends, performance, and tax-lot style tracking rather than generic charts. It supports corporate actions and dividend reinvestment so ownership metrics stay consistent as holdings change. Core workflows include importing trades, visualizing gains over time, and producing investor-ready reports like performance and income summaries.
- +Strong dividend and income tracking with automated reporting views
- +Corporate action handling helps keep holdings and history consistent
- +Trade import supports ongoing performance and attribution over time
- +Produces portfolio reports suited for investor summaries
- –Setup and data hygiene requirements can be time intensive
- –Advanced reporting flexibility needs more configuration than basic tracking
- –Less suited for complex multi-currency, multi-broker workflows
Best for: Investors who want dividends, corporate actions, and performance reporting
Stock Analysis
stock analyticsAnalyzes stocks with fundamental data, valuation metrics, and customizable watchlists plus performance tracking features.
Earnings and revenue trend analysis with linked financial statement history per company
StockAnalysis stands out for its stock-by-stock fundamental dashboards that combine financial statement history, valuation metrics, and analyst-style signals in one place. The platform emphasizes usable research views like profitability, balance sheet strength, cash flow trends, and detailed earnings context. It also supports screening and comparison workflows that help narrow opportunities before deeper research.
Coverage is strongest for U.S. equities with data structured for quick metric checks rather than complex custom backtesting.
- +Fundamental dashboards consolidate income, balance sheet, and cash flow metrics per ticker
- +Valuation and profitability views make it easy to track trends over time
- +Screeners and comparisons support faster shortlisting across multiple metrics
- –Limited portfolio and performance tooling for multi-holding tracking
- –Screeners are strong for fundamentals but weaker for strategy backtesting
- –Not optimized for complex watchlist automation or event-driven workflows
Best for: Investors researching U.S. stocks with fundamentals-focused dashboards and screening
Delta Investment Tracker
mobile portfolio trackerTracks brokerage and crypto holdings with portfolio performance, asset allocation, dividends, and import-based updates.
Interactive portfolio performance dashboards that update across holdings and time ranges
Delta Investment Tracker stands out by combining stock watchlists with a live portfolio view and goal-oriented dashboards. It supports tracking holdings, transactions, and performance metrics such as returns and allocation breakdowns. The app emphasizes fast analysis loops through importable data and interactive charts rather than heavy automation workflows.
- +Live portfolio performance view with clear returns and allocation signals
- +Watchlists and holdings tracking in one place for quicker decision cycles
- +Interactive charts help spot trends across time without complex setup
- –Automation depth is limited compared with professional portfolio platforms
- –Data import and reconciliation can be fiddly for multi-account histories
- –Advanced reporting and custom metrics require more manual configuration
Best for: Solo investors tracking portfolios and watchlists with fast performance visibility
Stooq
data providerDelivers downloadable market data and investment research outputs for building portfolio calculations using public time series.
Bulk historical data downloads per ticker in chart-ready time series format
Stooq stands out for its direct market data access and simple download-first workflow for stocks, indices, and historical prices. It offers quote pages, downloadable time series, and portfolio-style analysis through spreadsheet-friendly data exports.
The platform supports charting and screening-style browsing, with options to pull data across many tickers quickly. It is best treated as a data and research utility rather than a full trading terminal.
- +Quick access to historical price time series for many tickers
- +Charting and quote pages make stock research fast and readable
- +Spreadsheet-ready downloads support custom analytics workflows
- +Lightweight interface keeps navigation simple
- –Limited built-in portfolio accounting and performance attribution
- –Advanced screening and strategy tools are not on par with terminals
- –No native paper trading or order management workflow
Best for: Investors using data downloads for DIY analysis and charting workflows
Investing.com Portfolio
web portfolio trackerCreates portfolios and tracks holdings with market performance, watchlists, and news integration for monitored assets.
Portfolio performance and allocation dashboards driven by Investing.com market data
Investing.com Portfolio stands out by tying portfolio tracking to Investing.com market data like quotes, watchlists, and news. The core workflow centers on adding holdings, viewing performance and allocation views, and monitoring positions against market movements. It also supports cross-checking assets using the site’s broader coverage of equities and market indexes for quick context while reviewing results.
- +Connects portfolio views with Investing.com quote data for faster review
- +Provides allocation and performance breakdowns by holding and asset mix
- +Offers contextual market coverage like news and index information
- –Limited advanced analytics like factor attribution and tax lots
- –Manual tracking can be cumbersome for frequent rebalancing and trades
- –Portfolio-level benchmarking and goal tracking are not deeply customizable
Best for: Individual investors tracking equity holdings with market context and simple reporting
Conclusion
After evaluating 10 finance financial services, Portfolio Performance stands out as our overall top pick — it scored highest across our combined criteria of features, ease of use, and value, which is why it sits at #1 in the rankings above.
Use the comparison table and detailed reviews above to validate the fit against your own requirements before committing to a tool.
How to Choose the Right Stock Investment Software
This buyer's guide helps match investment workflows to specific stock and portfolio tools, covering Portfolio Performance, Quicken, Personal Capital, Morningstar Portfolio Manager, TradingView, Sharesight, Stock Analysis, Delta Investment Tracker, Stooq, and Investing.com Portfolio. It maps real capabilities like tax-lot performance, dividend and corporate action handling, allocation and risk reporting, scripted charting, and bulk data downloads to the investing problems those tools solve. It also lists common setup and workflow failures so selection focuses on the mechanics that matter.
What Is Stock Investment Software?
Stock investment software organizes brokerage and holdings data to produce performance views like gains, income, allocations, and portfolio summaries. It reduces manual spreadsheet work by importing transactions, tracking dividends and corporate actions, and calculating realized and time-series performance. Many tools also add research workflows such as watchlists, fundamentals dashboards, and charting with alerts, including TradingView for indicator-driven stock monitoring. Solutions like Portfolio Performance focus on tax-lot aware performance from imported lots, while Quicken combines investment tracking with personal finance ledgers.
Key Features to Look For
The right feature set determines whether a tool turns raw trades into accurate results and whether those results fit the investing decisions being made.
Tax and dividend-aware performance using security lots and transactions
Portfolio Performance calculates performance with tax and dividend awareness by using security lots and transactions, which supports taxable lot tracking across time. Sharesight also ties performance reporting to dividends and corporate action adjustments so income and ownership history remain consistent.
Brokerage and transaction import workflows that keep records aligned
Quicken’s standout workflow imports brokerage transactions into a personal finance ledger so investment activity stays consistent with reconciled accounts. Personal Capital also supports transaction import so holdings and performance stay aligned across aggregated accounts.
Allocation, risk, and portfolio analytics across multiple accounts
Morningstar Portfolio Manager provides portfolio analytics with allocation and risk reporting and uses multi-account support to keep holdings aligned across portfolios. Personal Capital adds dashboarding that contextualizes stock performance through allocation breakdowns tied to net worth and cash flow.
Portfolio X-Ray style holdings analysis for allocation and risk breakdowns
Morningstar Portfolio Manager’s Portfolio X-Ray style holdings analysis breaks down allocation and risk by examining structured portfolio compositions. This helps when rebalancing decisions depend on exposure changes rather than just top-line returns.
Scripted charting, strategy backtesting, and alerting
TradingView excels with TradingView Pine Script for custom indicators and scripted trading strategy backtesting directly on stock charts. It also provides fast alerts with multi-timeframe conditions to support disciplined monitoring for active investors.
Dividend, corporate action, and reinvestment handling
Sharesight focuses on dividend and performance attribution while applying corporate action adjustments so realized and income reporting remains coherent as holdings change. Investing.com Portfolio ties portfolio performance and allocation views to market data and supports ongoing monitoring, but it does not reach Sharesight’s corporate-action depth.
How to Choose the Right Stock Investment Software
Choosing the right tool starts with matching the required calculations and workflows to the specific mechanics each product supports best.
Start with the required accounting depth
If taxable lot performance and dividend-aware calculations are required, Portfolio Performance is built around security lots and transaction-based performance measurement. If dividends and corporate actions like dividend reinvestment and ownership consistency are the priority, Sharesight delivers dividend and performance attribution with corporate action adjustments.
Match import and reconciliation to the data sources used
If investments must stay inside a broader personal finance ledger, Quicken imports brokerage transactions and links investment holdings with budgeting and net worth views. If accounts need to be aggregated for a portfolio dashboard, Personal Capital supports transaction import so holdings, allocation, and performance reflect account activity.
Select analytics based on allocation and risk planning needs
If allocation tracking and measurable risk reporting drive decisions, Morningstar Portfolio Manager supports allocation, risk, and performance attribution plus scenario-style what-if evaluations for rebalance planning. If the goal is a contextual dashboard that ties investing to cash flow and net worth, Personal Capital focuses on portfolio analytics that connect holdings and performance to broader financial health.
Pick the research and monitoring workflow that matches daily behavior
For chart-first research with alerts and custom logic, TradingView provides customizable indicators, drawing tools, and Pine Script for custom indicators and backtested strategies. For fundamentals-first ticker research with linked financial statements, Stock Analysis emphasizes profitability and balance sheet dashboards plus earnings and revenue trend analysis.
Choose data utilities when DIY analysis and exports matter most
If bulk historical time series downloads are needed for spreadsheet-driven portfolio calculations, Stooq provides bulk historical data downloads in chart-ready time series format. If portfolio monitoring must be tied to Investing.com market data and news context, Investing.com Portfolio connects portfolio performance and allocation dashboards to Investing.com quotes and watchlists.
Who Needs Stock Investment Software?
Stock investment software fits distinct investing workflows that range from tax-lot accounting to charting and DIY research exports.
Investors who track taxable lots across multiple accounts and want tax-aware performance
Portfolio Performance is built for taxable lot tracking and calculates tax and dividend-aware performance using security lots and transactions across multiple accounts. Morningstar Portfolio Manager also supports multi-account portfolio analytics, but Portfolio Performance is the tighter fit for tax-lot and dividend-aware performance mechanics.
Investors who want dividends, corporate actions, and attribution-focused portfolio reporting
Sharesight delivers dividend and performance attribution with corporate action adjustments and reinvestment consistency, which supports clean income and gain reporting over time. Portfolio Performance also handles dividends and taxes with lot-based calculations, which suits investors who need both income tracking and detailed taxable performance.
Investors who need portfolio analytics blended with net worth and cash flow dashboards
Personal Capital focuses on net worth and cash flow dashboards that contextualize stock portfolio performance with allocation views and performance reporting. Quicken also links investments with budgeting and net worth, but Personal Capital’s dashboarding is more portfolio-centric for aggregated holdings.
Active stock investors who trade frequently and rely on alerts, custom indicators, and chart research
TradingView is the strongest match for scripted chart analysis and disciplined monitoring through real-time alerts and multi-timeframe conditions. TradingView also supports Pine Script for custom indicators and backtested trading strategies, which fits investors who iterate on strategies before placing trades.
Common Mistakes to Avoid
Common failures come from choosing the wrong calculation depth, underestimating setup work, or expecting charting or research tools to do full portfolio accounting.
Choosing a charting tool when tax-lot or corporate-action accounting is required
TradingView excels with scripted indicators, alerts, and chart-based backtesting, but it does not provide tax-lot performance accounting or corporate action adjustments in the same way as Portfolio Performance and Sharesight. Portfolio Performance and Sharesight handle dividend and tax-aware performance using lots and corporate action adjustments so performance totals remain accounting-grade.
Underestimating the setup work for accurate portfolio calculations
Portfolio Performance requires setup of accounts, security identifiers, and tax rules, and the tool’s reporting customization depends on familiarity with the underlying data model. Morningstar Portfolio Manager also takes time to import and reconcile data, while Sharesight requires data hygiene and setup to keep automated reporting accurate.
Expecting general personal finance dashboards to replace portfolio analytics workflows
Quicken links investments with budgeting and net worth, but advanced portfolio analytics and factor tools are limited compared with dedicated portfolio platforms like Morningstar Portfolio Manager. Personal Capital provides portfolio analytics dashboards, but stock-specific research depth is more limited than dedicated research tools like Stock Analysis.
Using fundamentals screeners as replacements for multi-holding performance tracking
Stock Analysis delivers earnings and revenue trend analysis with linked financial statement history and strong fundamental dashboards, but it has limited portfolio and performance tooling for multi-holding tracking. Stooq can supply bulk historical data exports for DIY analysis, but it lacks native portfolio accounting and performance attribution.
How We Selected and Ranked These Tools
We evaluated every tool on three sub-dimensions. Features received a weight of 0.4, ease of use received a weight of 0.3, and value received a weight of 0.3. The overall rating is the weighted average using overall = 0.40 × features + 0.30 × ease of use + 0.30 × value. Portfolio Performance separated itself by combining high feature depth for tax and dividend-aware performance using security lots and transactions with consistently strong features scoring.
Frequently Asked Questions About Stock Investment Software
Which stock investment software best handles taxable lot tracking and dividend-aware performance calculations?
Which tool combines stock portfolio tracking with a full personal finance net worth and cash flow view?
What software is best for allocation, performance attribution, and rebalance scenario planning across multiple accounts?
Which platform is best for chart-first stock research with real-time alerts and customizable indicators?
Which tool produces investor-ready dividend and corporate action reports with automated adjustments?
What’s the best option for fundamental stock research across many companies with earnings and valuation context?
Which software is best for fast watchlists plus interactive portfolio dashboards without heavy automation?
Which tool is most useful for DIY research workflows that rely on bulk historical price downloads and spreadsheet exports?
Which portfolio tracker ties holdings performance to live market data, watchlists, and news from a single ecosystem?
Tools reviewed
Primary sources checked during evaluation.
Referenced in the comparison table and product reviews above.
Keep exploring
Comparing two specific tools?
Software Alternatives
See head-to-head software comparisons with feature breakdowns, pricing, and our recommendation for each use case.
Explore software alternatives→In this category
Finance Financial Services alternatives
See side-by-side comparisons of finance financial services tools and pick the right one for your stack.
Compare finance financial services tools→FOR SOFTWARE VENDORS
Not on this list? Let’s fix that.
Our best-of pages are how many teams discover and compare tools in this space. If you think your product belongs in this lineup, we’d like to hear from you—we’ll walk you through fit and what an editorial entry looks like.
Apply for a ListingWHAT THIS INCLUDES
Where buyers compare
Readers come to these pages to shortlist software—your product shows up in that moment, not in a random sidebar.
Editorial write-up
We describe your product in our own words and check the facts before anything goes live.
On-page brand presence
You appear in the roundup the same way as other tools we cover: name, positioning, and a clear next step for readers who want to learn more.
Kept up to date
We refresh lists on a regular rhythm so the category page stays useful as products and pricing change.