GITNUXSOFTWARE ADVICE
Technology Digital MediaTop 10 Best Pc System Monitoring Software of 2026
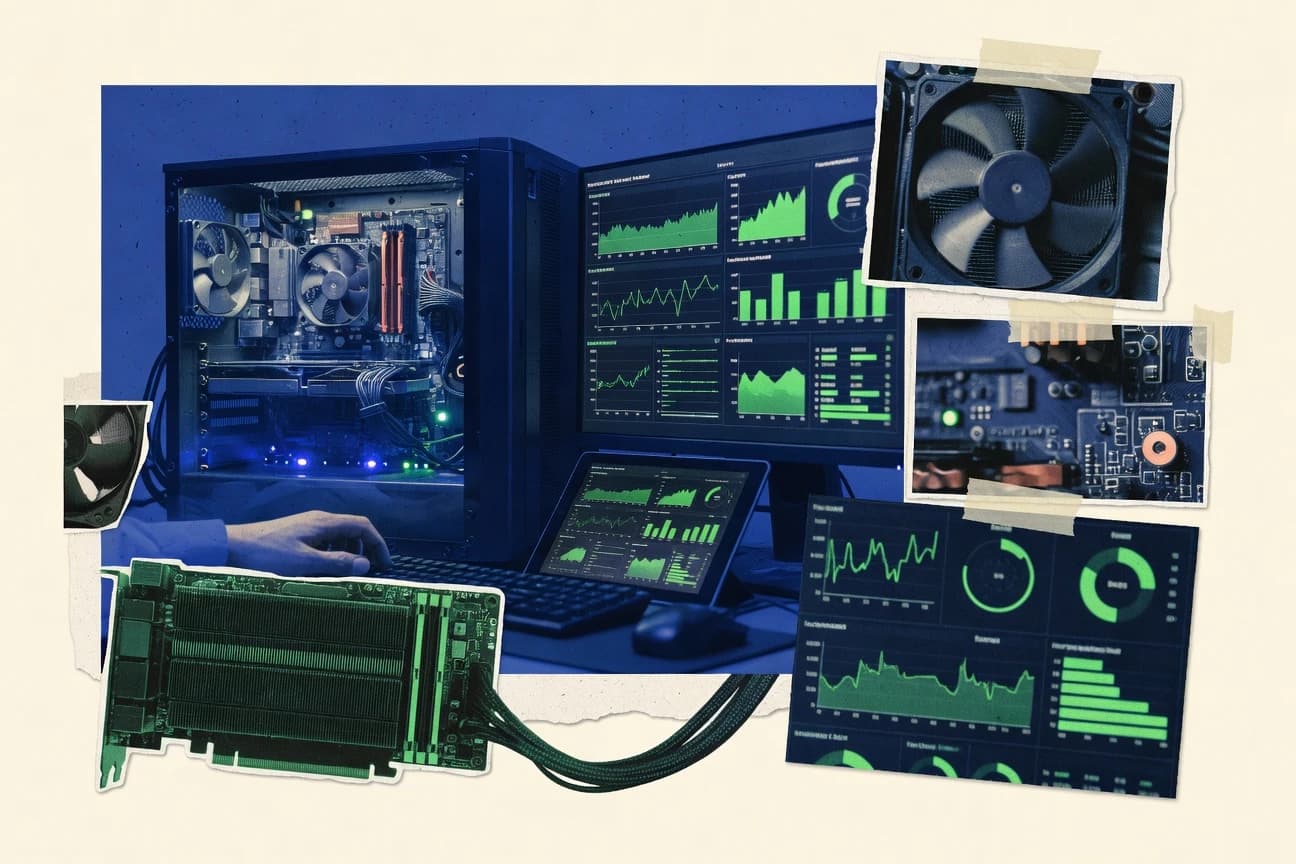
Discover the top 10 best PC system monitoring software to track performance, identify issues, optimize setups.

How we ranked these tools
Core product claims cross-referenced against official documentation, changelogs, and independent technical reviews.
Analyzed video reviews and hundreds of written evaluations to capture real-world user experiences with each tool.
AI persona simulations modeled how different user types would experience each tool across common use cases and workflows.
Final rankings reviewed and approved by our editorial team with authority to override AI-generated scores based on domain expertise.
Score: Features 40% · Ease 30% · Value 30%
Gitnux may earn a commission through links on this page — this does not influence rankings. Editorial policy
Editor picks
Three quick recommendations before you dive into the full comparison below — each one leads on a different dimension.
Zabbix
Trigger-based alerting with complex expressions and escalation-driven notification rules
Built for organizations needing scalable, customizable monitoring across PCs, servers, and networks.
PRTG Network Monitor
Sensor-based monitoring with thousands of predefined sensor types and alert triggers
Built for iT teams monitoring networks and services with sensor-level control and reporting.
SolarWinds Server & Application Monitor
Application dependency mapping that links server health to application services and workflows
Built for iT operations teams monitoring Windows servers and business applications.
Related reading
Comparison Table
This comparison table evaluates PC system monitoring software used to track uptime, server health, network performance, and application metrics across tools like Zabbix, PRTG Network Monitor, SolarWinds Server and Application Monitor, and Datadog. You can scan key differences in data collection, alerting, dashboarding, integrations, deployment options, and scalability so you can match each platform to your monitoring workflow.
| # | Tool | Category | Overall | Features | Ease of Use | Value |
|---|---|---|---|---|---|---|
| 1 | Zabbix Zabbix monitors servers, networks, and applications with agent and agentless data collection plus alerting, dashboards, and historical performance analytics. | enterprise monitoring | 9.1/10 | 9.6/10 | 7.7/10 | 8.9/10 |
| 2 | PRTG Network Monitor PRTG provides sensors for hardware and network metrics with real time dashboards, alerting, and automated discovery. | all-in-one monitoring | 8.1/10 | 9.0/10 | 7.4/10 | 7.8/10 |
| 3 | SolarWinds Server & Application Monitor SolarWinds Server & Application Monitor delivers infrastructure and application performance monitoring with intelligent troubleshooting and alerting. | infrastructure observability | 8.4/10 | 9.1/10 | 7.6/10 | 7.9/10 |
| 4 | Datadog Datadog monitors CPU, memory, disk, and system health through host agents with metrics, dashboards, and alerting across infrastructure. | cloud observability | 8.4/10 | 9.2/10 | 7.6/10 | 7.9/10 |
| 5 | Grafana with Prometheus Grafana and Prometheus combine metric collection and visualization to monitor system resources like CPU and memory with flexible alerting. | metrics stack | 8.7/10 | 9.3/10 | 7.9/10 | 8.2/10 |
| 6 | Nagios XI Nagios XI monitors host and service health using plugins, schedules checks, and triggers alerts based on thresholds. | check-based monitoring | 7.2/10 | 7.6/10 | 6.9/10 | 7.3/10 |
| 7 | ManageEngine OpManager OpManager monitors network and server performance with templates for SNMP and agents, plus alerts and reporting. | network-centric monitoring | 7.4/10 | 8.2/10 | 7.1/10 | 7.0/10 |
| 8 | LibreNMS LibreNMS is an open source monitoring platform that tracks device and interface health with SNMP polling, graphs, and alerting. | open-source monitoring | 8.0/10 | 8.8/10 | 7.4/10 | 8.6/10 |
| 9 | Netdata Netdata provides real time host and system monitoring with streaming metrics, dashboards, and anomaly detection. | real-time monitoring | 7.6/10 | 8.4/10 | 7.1/10 | 7.9/10 |
| 10 | HWiNFO HWiNFO collects detailed PC hardware sensors for CPU, GPU, temperatures, and voltages with logging for manual monitoring and troubleshooting. | hardware sensors | 6.6/10 | 8.3/10 | 6.2/10 | 6.7/10 |
Zabbix monitors servers, networks, and applications with agent and agentless data collection plus alerting, dashboards, and historical performance analytics.
PRTG provides sensors for hardware and network metrics with real time dashboards, alerting, and automated discovery.
SolarWinds Server & Application Monitor delivers infrastructure and application performance monitoring with intelligent troubleshooting and alerting.
Datadog monitors CPU, memory, disk, and system health through host agents with metrics, dashboards, and alerting across infrastructure.
Grafana and Prometheus combine metric collection and visualization to monitor system resources like CPU and memory with flexible alerting.
Nagios XI monitors host and service health using plugins, schedules checks, and triggers alerts based on thresholds.
OpManager monitors network and server performance with templates for SNMP and agents, plus alerts and reporting.
LibreNMS is an open source monitoring platform that tracks device and interface health with SNMP polling, graphs, and alerting.
Netdata provides real time host and system monitoring with streaming metrics, dashboards, and anomaly detection.
HWiNFO collects detailed PC hardware sensors for CPU, GPU, temperatures, and voltages with logging for manual monitoring and troubleshooting.
Zabbix
enterprise monitoringZabbix monitors servers, networks, and applications with agent and agentless data collection plus alerting, dashboards, and historical performance analytics.
Trigger-based alerting with complex expressions and escalation-driven notification rules
Zabbix stands out with deep, agent-based monitoring plus flexible discovery and alerting tuned for infrastructure at scale. It delivers host and service health tracking, log and metric collection options, and robust alert rules with escalation paths. Its visualizations and dashboards support both NOC-style operations and long-term capacity analysis through historical data retention. Zabbix also scales through distributed components, letting larger environments centralize reporting while polling many sites.
Pros
- Strong flexibility with SNMP, agent checks, and custom scripts for tailored monitoring
- Powerful alerting supports thresholds, triggers, and multi-step escalation workflows
- Built-in dashboards and reporting for historical trends and operational visibility
- Scales well with distributed polling and support for large numbers of metrics
Cons
- Initial setup and tuning of triggers and templates can be time-consuming
- UI configurability is powerful but not lightweight for day-to-day editing
- Some advanced integrations require careful parameter and security planning
Best For
Organizations needing scalable, customizable monitoring across PCs, servers, and networks
More related reading
- Technology Digital MediaTop 10 Best Computer Use Monitoring Software of 2026
- Technology Digital MediaTop 10 Best Web Page Monitoring Software of 2026
- Technology Digital MediaTop 10 Best Internet Connection Monitoring Software of 2026
- Technology Digital MediaTop 10 Best Good Hardware Monitoring Software of 2026
PRTG Network Monitor
all-in-one monitoringPRTG provides sensors for hardware and network metrics with real time dashboards, alerting, and automated discovery.
Sensor-based monitoring with thousands of predefined sensor types and alert triggers
PRTG Network Monitor stands out with its sensor-driven monitoring approach that quickly turns device checks into detailed metrics and alerts. It covers network availability, server health, bandwidth, and service responses through thousands of built-in sensor types and flexible alerting. A central web interface supports dashboards, reports, and event-based notifications for operations teams running PC and server environments. Its breadth of monitoring depth can increase configuration time compared with simpler PC monitoring tools.
Pros
- Large library of built-in sensors for network and service monitoring
- Web-based dashboards and reporting for ongoing operational visibility
- Flexible alerting with triggers, notifications, and escalation options
- Strong device discovery and dependency mapping for faster onboarding
Cons
- Sensor-heavy setups can become complex to design and maintain
- Pricing and licensing can add cost at larger monitoring footprints
- Advanced customization requires careful configuration to avoid alert noise
- UI is functional but can feel dense for quick local PC checks
Best For
IT teams monitoring networks and services with sensor-level control and reporting
SolarWinds Server & Application Monitor
infrastructure observabilitySolarWinds Server & Application Monitor delivers infrastructure and application performance monitoring with intelligent troubleshooting and alerting.
Application dependency mapping that links server health to application services and workflows
SolarWinds Server & Application Monitor stands out with deep Microsoft and application-focused monitoring built on a mature network management ecosystem. It provides agentless and agent-based visibility into Windows and Linux servers, IIS, and common application services, along with performance baselines and alerting. You can build service maps and correlate infrastructure health with application metrics to trace impact across tiers. Reporting supports capacity trending and SLA-oriented views for operations teams that manage both servers and the apps they run.
Pros
- Strong Windows and application monitoring with IIS and service awareness
- Correlates application performance with server and infrastructure metrics
- Service maps and dependency views help diagnose cross-tier issues
- Configurable baselines improve signal quality for performance changes
Cons
- Setup and tuning require more time than lighter server monitors
- Alert noise can increase without careful threshold and baseline design
- Licensing cost rises with larger monitored footprints
- Reporting can feel complex for teams needing simple dashboards
Best For
IT operations teams monitoring Windows servers and business applications
More related reading
- Technology Digital MediaTop 10 Best Syslog Monitoring Software of 2026
- Technology Digital MediaTop 10 Best Cloud Based Monitoring Software of 2026
- Technology Digital MediaTop 10 Best Application Performance Monitoring Software of 2026
- Technology Digital MediaTop 10 Best Data Center Monitoring Software of 2026
Datadog
cloud observabilityDatadog monitors CPU, memory, disk, and system health through host agents with metrics, dashboards, and alerting across infrastructure.
Datadog APM-to-infrastructure correlation for pinpointing which host caused an error spike
Datadog stands out with a unified observability stack that brings infrastructure metrics, container signals, application traces, and logs into one correlation layer. On Windows and Linux systems, it uses an agent to collect host performance metrics, process and network telemetry, and service-level views that tie back to deployments. For PC system monitoring use cases, it delivers searchable event and log context, customizable dashboards, and anomaly and SLO style alerting that routes issues to chat and ticketing workflows. Its main limitation is that deeper data collection and high-cardinality telemetry can increase operational overhead and cost as your footprint grows.
Pros
- Host metrics and process telemetry with deep correlations to traces and logs
- Custom dashboards, monitors, and alert routing across multiple tools
- Built-in anomaly detection for faster triage of performance regressions
- Strong container and service visibility for mixed infrastructure estates
Cons
- High-cardinality metrics and log volume can drive significant cost growth
- Setup and tuning for alerts and telemetry pipelines takes meaningful effort
- Learning advanced queries and dashboards requires time and practice
- Agent footprint and data retention settings need careful operational governance
Best For
Enterprises needing correlated host, app, and log monitoring across many endpoints
Grafana with Prometheus
metrics stackGrafana and Prometheus combine metric collection and visualization to monitor system resources like CPU and memory with flexible alerting.
Grafana dashboards powered by PromQL with label-based slicing and reusable templates
Grafana with Prometheus stands out by combining time series monitoring with a powerful dashboard layer that supports live metrics exploration. You use Prometheus to scrape system metrics like CPU, memory, disk, and network from PC or server agents and then visualize them in Grafana panels and dashboards. Grafana alerting and annotation features help you track incidents on those same dashboards, while Grafana’s query model lets you slice metrics by host, job, and labels. This pairing is strong for teams that want reusable dashboards for recurring hardware and performance checks.
Pros
- Highly flexible dashboards with drilldown and consistent panel reuse
- Prometheus labeling enables precise per-host filtering for system metrics
- Alerting can route notifications based on PromQL thresholds
Cons
- Requires Prometheus scrape configuration and Grafana data source setup
- Resource usage grows with high-cardinality metric label sets
- Alert tuning is harder than simple agent-only monitoring tools
Best For
Operations teams monitoring many hosts with dashboarding and metric alerts
Nagios XI
check-based monitoringNagios XI monitors host and service health using plugins, schedules checks, and triggers alerts based on thresholds.
Event-driven alerting with web-managed notification rules and historical audit trail
Nagios XI stands out for combining classic Nagios-style monitoring with a commercial, appliance-like web interface for managing alerts and services. It monitors hosts, services, and resources with active checks, passive checks, and a rules-based alerting workflow. The system also supports distributed monitoring through add-ons and supports common IT operations needs like event history, notifications, and reporting. For PC system monitoring, it is strongest when you standardize targets and want reliable alerting across many Windows and Linux endpoints.
Pros
- Web-based monitoring UI that centralizes hosts, services, and alerts
- Active and passive checks support many operational monitoring patterns
- Flexible notification rules with event history for faster incident review
Cons
- Setup and customization often require Nagios knowledge and scripting
- UI workflows can feel heavier than newer monitoring platforms
- Alert tuning can take time when scaling to many endpoints
Best For
Teams needing alert-first monitoring for mixed Windows and Linux systems
More related reading
ManageEngine OpManager
network-centric monitoringOpManager monitors network and server performance with templates for SNMP and agents, plus alerts and reporting.
Dependency Mapping for service-impact visualization across monitored infrastructure
ManageEngine OpManager stands out with deep infrastructure monitoring across servers, networks, and applications in one operational view. It combines SNMP-based device monitoring, interface and service health checks, and performance trending with alerting and report generation. The tool also supports dependency mapping so troubleshooting can trace impacted services back to the likely root cause. Strong out-of-the-box monitoring templates reduce setup time for common PC and infrastructure scenarios.
Pros
- Broad monitoring coverage for devices, interfaces, services, and apps
- Dependency mapping helps connect symptoms to probable root causes
- Detailed performance baselines and trending for faster anomaly detection
- Flexible alerting with actionable notifications and scheduling
Cons
- PC-specific monitoring requires more configuration than infrastructure
- Dashboards can feel dense once monitors scale
- Onboarding large environments takes careful template and threshold tuning
Best For
IT teams monitoring networks and servers with dependency-driven troubleshooting
LibreNMS
open-source monitoringLibreNMS is an open source monitoring platform that tracks device and interface health with SNMP polling, graphs, and alerting.
SNMP-based auto-discovery with sensor graphing for CPU, memory, and interface performance
LibreNMS stands out with broad SNMP and network device coverage plus a modular architecture for adding sensors and integrations. It delivers monitoring for CPU, memory, fans, disk usage, and interface traffic across routers, switches, servers, and other managed endpoints. Its alerting uses threshold rules and notifications, and its dashboards visualize performance trends over time. Strong auto-discovery and graphing reduce manual setup for multi-device environments.
Pros
- Uses SNMP polling plus device and sensor auto-discovery to expand coverage quickly
- Powerful graphing for interfaces, CPU, memory, and many device health metrics
- Flexible alert rules with notifications for threshold and status changes
- Modular design supports plugins for extra checks and integrations
- Web UI centralizes dashboards, device status, and historical trends
Cons
- Setup requires careful configuration of SNMP, credentials, and polling settings
- UI navigation can feel dense when managing large device inventories
- Performance tuning is needed for high device counts and heavy polling
Best For
Network and systems teams needing SNMP-based monitoring with strong graphing
More related reading
Netdata
real-time monitoringNetdata provides real time host and system monitoring with streaming metrics, dashboards, and anomaly detection.
Real-time system metrics with interactive, zoomable dashboards and built-in anomaly views
Netdata stands out with always-on infrastructure observability that turns system metrics into interactive, shareable dashboards. It collects host metrics, container metrics, and application signals with a real-time, time-series focus. You can set up alerts, drill into resource bottlenecks, and view performance history across many machines through a centralized cloud interface. The strongest fit is PC and server monitoring where rapid visual correlation matters more than deep custom analytics.
Pros
- Real-time dashboards for CPU, memory, disk, network, and host health
- High-cardinality time-series storage with fast drill-down and comparisons
- Alerting tied to metrics with notification support for incidents
- Centralized view across multiple monitored hosts and containers
Cons
- Initial configuration and agent permissions can be nontrivial
- High metric volume can increase storage and processing overhead
- Some advanced tuning requires familiarity with monitoring concepts
- UI navigation can feel dense when monitoring many services
Best For
Teams monitoring multiple Windows and Linux machines with real-time dashboards
HWiNFO
hardware sensorsHWiNFO collects detailed PC hardware sensors for CPU, GPU, temperatures, and voltages with logging for manual monitoring and troubleshooting.
HWiNFO sensor and telemetry collection across many hardware components with granular real-time graphs
HWiNFO stands out for extremely deep hardware visibility, including low-level sensors and detailed component reporting for CPUs, GPUs, and storage devices. It can monitor live telemetry and log readings across many sensor types, with separate views for summary, per-device stats, and real-time graphs. It also supports hardware inventory-style data collection, which is useful for audits and troubleshooting without needing a separate diagnostic suite.
Pros
- Very broad sensor coverage across CPU, GPU, motherboard, and storage
- Real-time monitoring with graphs, logging, and per-sensor detail
- Comprehensive hardware inventory for diagnostics and asset checks
Cons
- Interfaces can feel dense because it exposes many low-level readings
- Alerting and workflow automation features are limited compared with monitoring platforms
- High sensor counts can overwhelm dashboards for quick reviews
Best For
PC diagnostics and power-user hardware monitoring for troubleshooting and logging
Conclusion
After evaluating 10 technology digital media, Zabbix stands out as our overall top pick — it scored highest across our combined criteria of features, ease of use, and value, which is why it sits at #1 in the rankings above.
Use the comparison table and detailed reviews above to validate the fit against your own requirements before committing to a tool.
How to Choose the Right Pc System Monitoring Software
This buyer's guide helps you choose PC system monitoring software across infrastructure, networks, applications, and hardware telemetry using tools like Zabbix, PRTG Network Monitor, SolarWinds Server & Application Monitor, Datadog, Grafana with Prometheus, and Netdata. You will also see how LibreNMS, Nagios XI, ManageEngine OpManager, and HWiNFO fit when you need SNMP monitoring, alert-first workflows, dependency-driven troubleshooting, or deep hardware sensor logging. Use this guide to map your monitoring goals to concrete capabilities such as trigger logic, sensor libraries, dependency maps, and real-time dashboards.
What Is Pc System Monitoring Software?
PC system monitoring software continuously collects health and performance signals from Windows and Linux machines such as CPU, memory, disk usage, and network activity. It turns those signals into dashboards, alerting rules, and historical trend views so teams can detect outages and performance regressions and trace them to likely causes. It also supports different collection models, including agent-based metrics collection like Datadog and Zabbix, sensor-driven discovery like PRTG Network Monitor, and SNMP polling like LibreNMS. In practice, the category looks like Zabbix for scalable alerting and analytics, or Grafana with Prometheus when you want reusable dashboarding powered by metric labels.
Key Features to Look For
The features that matter most are the ones that decide how quickly you can see problems, how accurately you can alert on them, and how effectively you can troubleshoot them after alerts fire.
Trigger-based alerting with escalation workflows
Zabbix excels with trigger-based alerting using complex expressions plus multi-step escalation-driven notification rules. Nagios XI supports event-driven alerting with web-managed notification rules and a historical audit trail, which helps operations teams review what happened and why. This capability matters because alert logic that can escalate reduces time to resolution and helps prevent repeated manual checks.
Sensor-driven monitoring with large built-in device coverage
PRTG Network Monitor stands out with sensor-based monitoring and thousands of predefined sensor types. That approach matters when you want fast onboarding of network availability, bandwidth, and service response checks with alert triggers tied to each sensor. LibreNMS also supports modular sensor checks and graphing, but PRTG’s sensor library focuses on rapid, sensor-level configuration.
Application and infrastructure dependency mapping
SolarWinds Server & Application Monitor provides application dependency mapping that links server health to application services and workflows. ManageEngine OpManager and its dependency mapping connect symptoms to likely root causes across monitored infrastructure. This feature matters because it turns raw host metrics into an impact view that explains which application paths are affected.
APM-to-infrastructure correlation for root-cause pinpointing
Datadog is built for correlated observability, including correlation between APM errors and the infrastructure host that caused an error spike. This matters because you can connect application symptoms to the specific CPU, memory, or service health signals on the responsible machine. It also reduces the need for manual log scrubbing when triaging performance and reliability incidents.
Reusable dashboards powered by flexible metric queries
Grafana with Prometheus combines PromQL label-based slicing with dashboards and drill-down for consistent views across many hosts. That matters because per-host filtering and panel reuse reduce dashboard duplication and speed up recurring hardware and performance reviews. Zabbix also provides dashboards and historical trend analytics, but Grafana emphasizes query-driven exploration.
Real-time, interactive system metrics visualization with anomaly views
Netdata focuses on always-on streaming metrics, interactive zoomable dashboards, and built-in anomaly views for rapid bottleneck discovery. This matters when you want immediate visual correlation between CPU, memory, disk, and network changes across multiple machines. Netdata’s centralized cloud interface also supports consolidated viewing for multi-host monitoring.
How to Choose the Right Pc System Monitoring Software
Pick a tool by matching your collection model and troubleshooting workflow to the way your team detects and resolves incidents.
Start with your collection model and target environment
Choose agent-based metric monitoring when you need consistent host telemetry like Datadog and Zabbix, which monitor CPUs, memory, disk, and system health through agents. Choose sensor-driven monitoring like PRTG Network Monitor when you want device checks implemented as thousands of predefined sensor types. Choose SNMP polling like LibreNMS when your PC monitoring overlaps heavily with network device health and you need SNMP auto-discovery.
Define how you want alerts to behave when incidents start
If you need complex alert logic and escalation paths, select Zabbix because it supports trigger-based alerting with complex expressions and multi-step escalation-driven notifications. If you want alert rules managed through a web workflow with an audit trail, select Nagios XI because it uses event-driven alerting with web-managed notification rules and historical event history. If you need alerts tied to real-time anomaly views across many hosts, select Netdata because it links alerting to streaming metrics and anomaly views.
Map your troubleshooting workflow to dashboards and dependency views
If outages and slowdowns need impact mapping across application services, choose SolarWinds Server & Application Monitor because it provides application dependency mapping. Choose ManageEngine OpManager when you want dependency mapping that traces service impact back to probable root causes across devices, interfaces, and services. Choose Datadog when correlation from APM symptoms to infrastructure hosts is the fastest path to identifying the responsible machine.
Choose between off-the-shelf monitoring depth and query-driven flexibility
Choose PRTG Network Monitor when you want broad built-in sensor coverage for network and service monitoring without building everything from scratch. Choose Grafana with Prometheus when you want flexible dashboarding and reusable panels powered by PromQL label slicing across hosts and jobs. Use Zabbix when you want built-in dashboards plus powerful trigger expressions and scalable distributed polling for large metric sets.
Validate operational fit using setup complexity and UI workflow
Plan for setup and tuning time when you choose Zabbix or SolarWinds Server & Application Monitor because trigger and threshold baselines often require deliberate configuration to avoid alert noise. Expect configuration and knowledge overhead with Nagios XI because its setup and customization commonly require Nagios knowledge and scripting. For quick visual correlation, choose Netdata and use its real-time dashboards, while for deep hardware root causes choose HWiNFO because it delivers granular CPU, GPU, temperature, and voltage sensor logging with hardware inventory-style data.
Who Needs Pc System Monitoring Software?
Different teams need different monitoring strengths such as scalable alerting, SNMP auto-discovery, dependency-driven troubleshooting, or real-time interactive dashboards.
NOC and infrastructure teams that must scale customizable monitoring across many hosts and sites
Zabbix fits teams that need trigger-based alerting with complex expressions plus distributed polling for scaling host and service health checks. Its dashboards and historical performance analytics support long-term capacity analysis when you monitor PC and server fleets together.
IT networks and service teams that want sensor-level monitoring with fast device onboarding
PRTG Network Monitor fits teams that want thousands of predefined sensor types for availability, bandwidth, and service response checks. LibreNMS also fits when your environment is heavy on SNMP device health and you want graphing plus SNMP auto-discovery.
Teams running Windows servers and business applications who need dependency-aware incident tracing
SolarWinds Server & Application Monitor fits IT operations teams that need application dependency mapping and service maps that link server health to application workflows. ManageEngine OpManager fits teams that want dependency mapping to connect service impact to probable root causes while monitoring interfaces, services, and performance baselines.
Enterprises that must correlate application errors to the exact host causing them
Datadog fits organizations that need APM-to-infrastructure correlation to pinpoint which host caused an error spike. It also supports customizable dashboards and anomaly detection when host performance regressions must be found quickly.
Operations teams that want metric-label slicing and reusable dashboards across many endpoints
Grafana with Prometheus fits teams that need PromQL label-based slicing for per-host filtering and reusable dashboard templates. It is a strong fit when you expect recurring hardware and performance checks that should look consistent across fleets.
Teams that prioritize real-time visual correlation and streaming anomaly detection
Netdata fits teams that want interactive, zoomable system dashboards and built-in anomaly views for CPU, memory, disk, and network bottlenecks. It also fits when centralized visibility across multiple monitored hosts and containers matters for fast triage.
Common Mistakes to Avoid
These pitfalls show up when teams pick the wrong collection model, under-design alert logic, or mismatch monitoring tooling to the troubleshooting workflow they actually use.
Deploying complex alert logic without planning escalation and baseline behavior
Zabbix can produce accurate escalations with trigger-based complex expressions, but it requires careful template and trigger tuning to avoid alert storms. SolarWinds Server & Application Monitor also needs baseline and threshold design to reduce alert noise when correlating application performance to infrastructure metrics.
Assuming sensor libraries eliminate configuration work
PRTG Network Monitor’s thousands of sensor types accelerate coverage, but sensor-heavy setups still require design to prevent excessive complexity and alert noise. LibreNMS also reduces manual setup through SNMP auto-discovery, but SNMP credentials and polling settings must be configured carefully.
Choosing visualization flexibility without accounting for query and setup effort
Grafana with Prometheus delivers highly flexible dashboards with PromQL label slicing, but it requires Prometheus scrape configuration and Grafana data source setup. Datadog provides unified observability dashboards, but high-cardinality telemetry and log volume can increase operational overhead if you do not govern data retention and telemetry scope.
Using a hardware sensor tool as a full monitoring platform
HWiNFO provides extremely deep hardware visibility with logging and per-sensor graphs, but its alerting and workflow automation features are limited compared with monitoring platforms like Zabbix and Nagios XI. If you need alert rules and incident workflows, pair HWiNFO-style sensor logging with a monitoring solution that supports triggers, dashboards, and notifications.
How We Selected and Ranked These Tools
We evaluated Zabbix, PRTG Network Monitor, SolarWinds Server & Application Monitor, Datadog, Grafana with Prometheus, Nagios XI, ManageEngine OpManager, LibreNMS, Netdata, and HWiNFO across overall capability, feature depth, ease of use, and value for real monitoring workflows. We separated Zabbix from lower-ranked options by weighing how far trigger-based alerting with complex expressions and escalation-driven notification rules can scale with dashboards and historical performance analytics. We also rewarded tools that connect monitoring signals to practical troubleshooting outputs such as SolarWinds and OpManager dependency mapping and Datadog APM-to-infrastructure correlation. We then checked how operational overhead shows up in practice, including UI density, tuning effort, SNMP credential setup, Prometheus scrape configuration, and high-cardinality telemetry governance.
Frequently Asked Questions About Pc System Monitoring Software
Which tool is best for PC system monitoring when you need customizable trigger logic and scalable alert escalation?
Zabbix supports trigger-based alerting with complex expressions and escalation-driven notification rules across many hosts. Its distributed components help centralize reporting while polling multiple sites, which suits large PC fleets.
What monitoring approach is easiest to stand up for network and service checks around Windows and PC environments?
PRTG Network Monitor uses thousands of built-in sensor types that turn common device checks into detailed metrics and alerts. That sensor-driven workflow can be faster to deploy than tools that require more manual metric and dashboard design from scratch.
How do I monitor Windows and Linux PCs plus application health in the same workflow?
SolarWinds Server & Application Monitor connects Windows and Linux server visibility with IIS and application service monitoring. It builds service maps and correlates server health with application metrics so you can trace which tier is impacting users.
Which option best correlates host telemetry with logs and traces for root-cause analysis of PC incidents?
Datadog ties infrastructure metrics from agents to searchable event and log context, and it correlates APM signals back to the host that triggered an error spike. This makes it practical to pivot from an anomaly on a PC endpoint to the underlying deployment activity.
What setup fits teams that want flexible time-series dashboards and metric alerting across many machines?
Grafana with Prometheus lets you scrape PC and server system metrics in Prometheus and visualize them in Grafana panels. Grafana alerting and annotations help you track incidents directly on the dashboards while slicing metrics by host and labels via PromQL.
When should I use an alert-first monitoring workflow for mixed Windows and Linux PCs and servers?
Nagios XI supports active checks, passive checks, and rules-based alerting with a web-managed notification workflow. It also keeps event history and reporting, which helps operations teams manage repeated PC and service incidents consistently.
Which tool is strong for dependency-driven troubleshooting across PCs, servers, and network services?
ManageEngine OpManager pairs SNMP-based device monitoring with interface and service health checks and performance trending. Its dependency mapping helps you identify the likely root cause by linking impacted services back to underlying infrastructure.
Which monitoring option is best if I rely on SNMP and want strong graphing plus auto-discovery for many endpoints?
LibreNMS provides SNMP-based monitoring with modular sensor additions and dashboards that visualize performance trends over time. Auto-discovery reduces manual setup when you add switches, routers, and other managed endpoints that expose CPU, memory, fans, and interface traffic.
What should I choose if I need real-time, interactive PC dashboards to quickly find bottlenecks during incidents?
Netdata focuses on always-on infrastructure observability with real-time, interactive dashboards that you can zoom into during troubleshooting. It also includes built-in anomaly views and alerting so you can correlate resource bottlenecks across many Windows and Linux machines quickly.
Which tool is best for deep hardware sensor telemetry and hardware inventory during PC diagnostics?
HWiNFO provides extremely granular hardware visibility across CPUs, GPUs, and storage with detailed component reporting and live sensor telemetry. It can also collect hardware inventory-style data, which is useful for audits and troubleshooting without needing separate diagnostic tooling.
Tools reviewed
Referenced in the comparison table and product reviews above.
Keep exploring
Comparing two specific tools?
Software Alternatives
See head-to-head software comparisons with feature breakdowns, pricing, and our recommendation for each use case.
Explore software alternatives→In this category
Technology Digital Media alternatives
See side-by-side comparisons of technology digital media tools and pick the right one for your stack.
Compare technology digital media tools→FOR SOFTWARE VENDORS
Not on this list? Let’s fix that.
Our best-of pages are how many teams discover and compare tools in this space. If you think your product belongs in this lineup, we’d like to hear from you—we’ll walk you through fit and what an editorial entry looks like.
Apply for a ListingWHAT THIS INCLUDES
Where buyers compare
Readers come to these pages to shortlist software—your product shows up in that moment, not in a random sidebar.
Editorial write-up
We describe your product in our own words and check the facts before anything goes live.
On-page brand presence
You appear in the roundup the same way as other tools we cover: name, positioning, and a clear next step for readers who want to learn more.
Kept up to date
We refresh lists on a regular rhythm so the category page stays useful as products and pricing change.