GITNUXSOFTWARE ADVICE
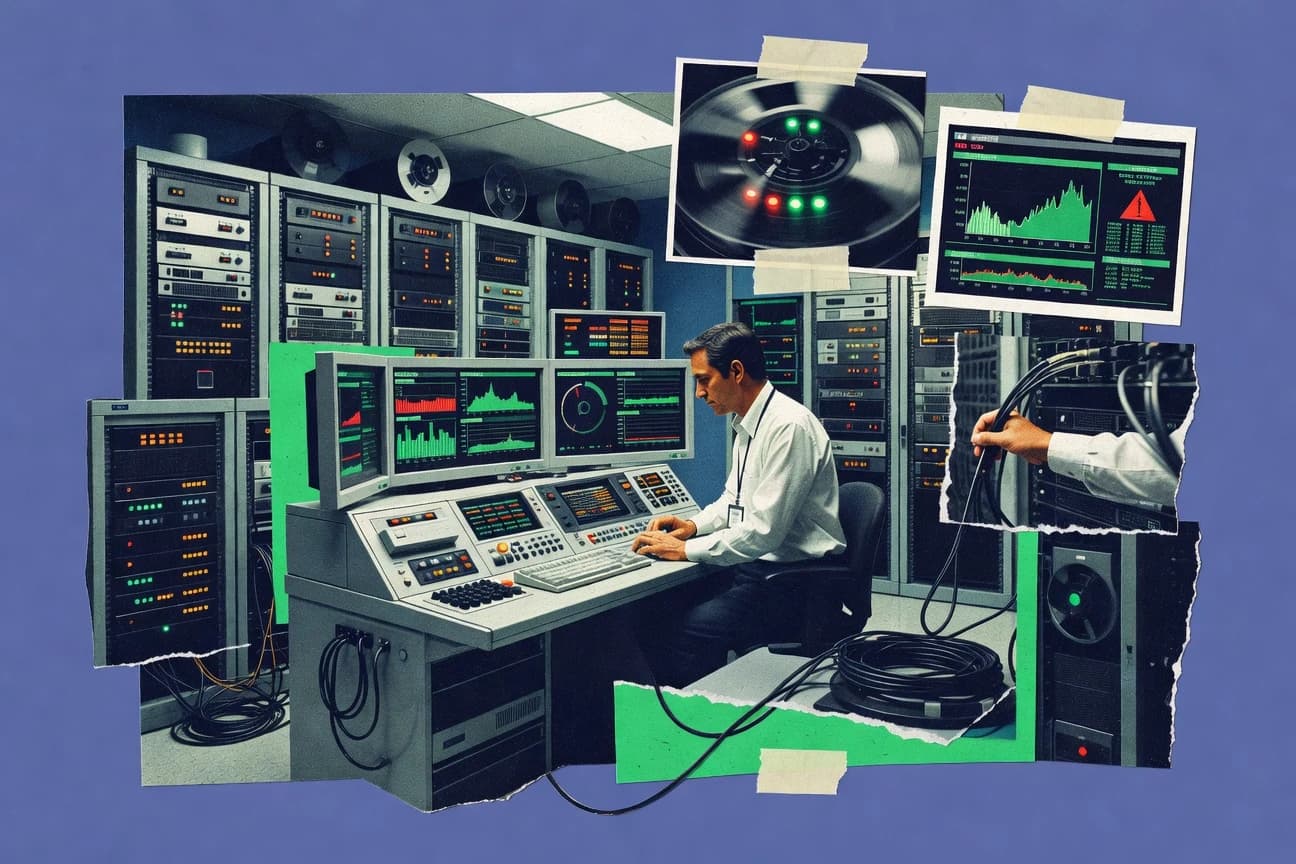
Technology Digital MediaTop 10 Best Mainframe Monitoring Software of 2026
Discover the top mainframe monitoring software tools to optimize performance and reliability. Find your best fit now.

How we ranked these tools
Core product claims cross-referenced against official documentation, changelogs, and independent technical reviews.
Analyzed video reviews and hundreds of written evaluations to capture real-world user experiences with each tool.
AI persona simulations modeled how different user types would experience each tool across common use cases and workflows.
Final rankings reviewed and approved by our editorial team with authority to override AI-generated scores based on domain expertise.
Score: Features 40% · Ease 30% · Value 30%
Gitnux may earn a commission through links on this page — this does not influence rankings. Editorial policy
Editor’s top 3 picks
Three quick recommendations before you dive into the full comparison below — each one leads on a different dimension.
Rocket z/OS Automation
Agent-based event automation that triggers z/OS remediation workflows from monitoring signals
Built for enterprises automating z/OS monitoring-to-remediation across multiple mainframe systems.
Broadcom AIOps for Mainframe
Editor pickAI-assisted anomaly detection that correlates mainframe signals into incident-oriented troubleshooting paths
Built for enterprises needing mainframe anomaly correlation and automated triage workflows.
IBM z/OS Management Facility (z/OSMF)
Editor pickAutomated console and task workflows via z/OSMF workflows and policy-based operations
Built for mainframe operations teams needing automated monitoring and workflow execution.
Related reading
- Technology Digital MediaTop 10 Best Pc System Monitoring Software of 2026
- Technology Digital MediaTop 10 Best Data Center Monitoring Software of 2026
- Technology Digital MediaTop 10 Best Snmp Network Monitoring Software of 2026
- Technology Digital MediaTop 10 Best Internet Connection Monitoring Software of 2026
Comparison Table
This comparison table benchmarks mainframe monitoring software across key operational needs like z/OS automation, event management, performance visibility, and systems management workflows. You can compare products such as Rocket z/OS Automation, Broadcom AIOps for Mainframe, IBM z/OSMF, CA NetMaster, and IBM Tivoli Netcool Operations Insight on the capabilities that affect day-to-day monitoring and incident response.
Rocket z/OS Automation
enterprise automationRocket z/OS Automation monitors and manages z/OS operations with workflow-driven automation for alerts, scheduling, and operational control.
Agent-based event automation that triggers z/OS remediation workflows from monitoring signals
Rocket z/OS Automation stands out with agent-based z/OS operations that combine monitoring, scheduling, and automated resolution for mainframe jobs and incidents. The solution supports event-driven workflows that react to system and application conditions across multiple z/OS images.
It provides actionable views of job status, automation history, and health signals so teams can move from alerting to controlled remediation. It also integrates with Rocket products and common automation patterns used in enterprise mainframe environments.
- +Event-driven automation links monitoring alerts to executable remediation workflows.
- +Centralized visibility across z/OS systems for job status and operational health.
- +Strong support for automated scheduling and operational task handling.
- +Automation history improves auditability and faster incident follow-ups.
- –Operational setup requires mainframe expertise and careful workflow design.
- –UI-based configuration can feel heavy compared with lightweight monitoring tools.
- –Complex environments may need more tuning to reduce alert noise.
Best for: Enterprises automating z/OS monitoring-to-remediation across multiple mainframe systems
More related reading
Broadcom AIOps for Mainframe
AIOps correlationBroadcom AIOps for Mainframe correlates telemetry across z/OS to detect anomalies, reduce noise, and drive faster incident resolution.
AI-assisted anomaly detection that correlates mainframe signals into incident-oriented troubleshooting paths
Broadcom AIOps for Mainframe focuses on AI-assisted operations for IBM mainframe environments, with anomaly detection and event correlation aimed at reducing alert noise. It supports monitoring across common mainframe data sources and operational signals, then translates telemetry into actionable incidents for operations teams.
The solution emphasizes faster triage using automated root-cause style analysis patterns rather than manual log hunting. It is best suited to organizations that already standardize on broader Broadcom operations and want mainframe-specific AIOps workflows.
- +AI-driven anomaly detection reduces repetitive mainframe alert storms
- +Correlation across mainframe operational signals speeds incident triage
- +Automated troubleshooting workflows cut manual log and metric scanning
- +Integrates with enterprise operations tooling common in Broadcom ecosystems
- –Requires mainframe data integration work before value appears
- –Tuning alert thresholds can take time for noisy environments
- –Licensing and deployment complexity favor larger operations teams
- –Out-of-the-box mainframe dashboards may need customization for unique KPIs
Best for: Enterprises needing mainframe anomaly correlation and automated triage workflows
IBM z/OS Management Facility (z/OSMF)
platform monitoringIBM z/OS Management Facility provides web-based administration and health monitoring for z/OS workflows, tasks, and resources.
Automated console and task workflows via z/OSMF workflows and policy-based operations
IBM z/OS Management Facility stands out because it integrates monitoring, automation, and operations management directly for z/OS systems under one web-based interface. It provides availability and performance monitoring with built-in collections, historical views, and alerting tied to operational policies.
It also supports workflow-driven task execution with Health Checker integration, console automation, and improved visibility across multiple LPARs and sysplex environments. Its dependency on z/OS-native components and IBM ecosystem integration can limit its fit for shops seeking vendor-neutral monitoring across non-z/OS platforms.
- +Web-based operations views for z/OS availability and performance
- +Policy-based automation reduces manual console and operations work
- +Health event integration links monitoring signals to actions
- –Best results require z/OS configuration and IBM management stack alignment
- –Cross-platform monitoring needs additional tooling beyond z/OSMF
- –Admin setup and tuning can be demanding for smaller teams
Best for: Mainframe operations teams needing automated monitoring and workflow execution
CA NetMaster
system managementOpenText CA NetMaster offers mainframe system monitoring with automated checks, reporting, and operational management for critical resources.
Integrated capacity planning with forecasting built from monitored mainframe performance metrics
CA NetMaster stands out for combining mainframe performance visibility with integrated capacity planning and workload oversight. It monitors critical mainframe resources such as CPU and storage and ties trends to forecasting so teams can manage performance before incidents.
It also supports operational views for systems and applications across enterprise scheduling and resource management workflows. The result is strong mainframe-centric monitoring with planning hooks, but it is less flexible for non-mainframe monitoring needs.
- +Mainframe-focused monitoring across CPU, storage, and workload components
- +Capacity planning and forecasting linked to observed performance trends
- +Operational dashboards support faster incident triage on core systems
- +Works well for teams managing batch and scheduled workloads
- –Admin setup and data modeling require mainframe expertise
- –Less useful for environments that are not primarily mainframe-based
- –Interface and workflows can feel complex for day-to-day operators
Best for: Mainframe operations teams needing monitoring plus capacity forecasting
IBM Tivoli Netcool Operations Insight
event correlationIBM Tivoli Netcool Operations Insight aggregates and deduplicates events from mainframe sources to support incident views and operational triage.
Netcool Operations Insight event correlation and workflow-based alert triage
IBM Tivoli Netcool Operations Insight stands out for its event-driven operations approach that turns signal data into actionable workflows. It ingests and correlates events from network, middleware, and infrastructure sources to drive investigations, alerts, and case handling.
Its strength for mainframe monitoring is visual alert management and correlation that helps reduce noise from high-volume event streams. It also relies on a rules and integrations model that requires careful design to match your IBM Z signal sources and operational processes.
- +Event correlation and triage reduce alert noise from high-volume monitoring feeds
- +Visual case and workflow views speed investigations across operators and teams
- +Works well with heterogeneous monitoring sources that emit events and alarms
- –Initial setup and tuning for event rules can be time-consuming
- –Designing correlations for mainframe-specific signals needs expert knowledge
- –Cost and licensing complexity can be heavy for smaller environments
Best for: Enterprises needing correlated mainframe event triage with workflow-driven operations
IBM NetView for z/OS
operations monitoringIBM NetView for z/OS monitors network and system status with automated discovery, alerts, and operator consoles for z/OS.
Automated operator and workflow actions driven by z/OS message automation rules
IBM NetView for z/OS stands out with deep IBM mainframe operational heritage and robust automation for console, network, and application events. It provides monitoring of z/OS messages, views of system activity, and rule-based actions that can route alerts to operators and downstream workflows.
Built around mainframe-centric instrumentation and automation policies, it supports both real-time operations and controlled response patterns across complex environments. NetView focuses on orchestration and monitoring for z/OS systems rather than cross-platform agent-based observability.
- +Strong z/OS message and console monitoring with automation hooks
- +Rule-driven responses help standardize operator workflows at scale
- +Proven fit for complex mainframe operations and network awareness
- –Configuration and rule tuning require specialized mainframe expertise
- –Modern UI and self-service analytics are limited compared with newer tools
- –Integration effort can be significant for non-mainframe monitoring stacks
Best for: Large mainframe environments needing automated console and message-driven operations
Turbonomic by IBM
capacity optimizationTurbonomic provides capacity and performance monitoring for mainframe-adjacent workloads by analyzing demand, capacity, and utilization signals.
Closed-loop optimization that uses policy controls to recommend or apply resource changes.
Turbonomic by IBM focuses on automated application and infrastructure performance optimization, not just passive monitoring. It uses policy-based actions to recommend or enact changes on compute, storage, and network resources tied to application demand.
Its strength is closing the loop between telemetry and control, which helps maintain mainframe-dependent workloads during capacity pressure. Integration with enterprise environments and IBM ecosystem tooling supports cross-domain visibility for hybrid infrastructure performance management.
- +Actionable optimization recommendations tied to real workload demand
- +Cross-domain visibility across compute, storage, and network resources
- +Policy-driven automation supports repeatable capacity and performance control
- –Mainframe-specific setup can be complex in heterogeneous environments
- –Automation requires careful governance to avoid unwanted workload changes
- –Licensing and deployment costs can be heavy for smaller teams
Best for: Enterprises needing closed-loop performance optimization for mainframe workloads
Zabbix
open-source monitoringZabbix monitors z/OS and other enterprise systems by collecting metrics, raising alerts, and offering dashboards with configurable checks.
Trigger-based event generation with discovery rules and templated monitoring configurations
Zabbix stands out for its free, open source monitoring engine that can supervise both infrastructure and application health with one unified alerting model. It collects mainframe-relevant signals through SNMP, agent-based checks, and integrations that translate vendor or middleware metrics into Zabbix items.
Its core capabilities include configurable triggers, threshold-based and discovery-driven monitoring, and dashboards that support operations across many environments. Zabbix also supports automation through alert escalation actions and notification scripts.
- +Free open source core supports large mainframe monitoring deployments
- +Flexible triggers and event correlation with dashboard-driven situational awareness
- +Discovery and templating speed standardized monitoring across many systems
- +Alerting actions support routing to email, chat, webhooks, and scripts
- –Initial configuration for mainframe data sources can be time-consuming
- –Scaling performance tuning requires careful sizing for large metric volumes
- –Advanced visualizations and workflows need hands-on configuration work
Best for: Teams building cost-conscious mainframe monitoring with customizable alert logic
Dynatrace
APM monitoringDynatrace monitors end-to-end application performance that can include mainframe interactions by using distributed traces, logs, and service health.
Davis AI with automatic root-cause analysis and anomaly clustering across monitored services
Dynatrace stands out with AI-driven root-cause analysis that links infrastructure, applications, and user experience into a single operational view. For mainframe monitoring, it supports distributed tracing and deep telemetry so you can correlate batch, CICS, and transaction performance with end-user outcomes.
Its workflow includes automated anomaly detection, service mapping, and dynamic dashboards for fast troubleshooting across complex hybrid environments. You still need strong data hygiene and agent configuration to keep traces actionable in highly customized mainframe landscapes.
- +AI root-cause analysis correlates mainframe impact with service and UX metrics
- +Service mapping ties telemetry to dependencies for faster batch and transaction triage
- +Automated anomaly detection highlights regressions without manual rule tuning
- +Rich visualization dashboards speed handoff from operations to engineering
- +Distributed tracing supports end-to-end correlation across hybrid components
- –Mainframe onboarding can be complex for tightly integrated, highly customized setups
- –Advanced analytics require disciplined tagging and consistent telemetry standards
- –License cost can be high for smaller teams with limited instrumentation needs
Best for: Enterprises needing AI-correlated mainframe troubleshooting across hybrid services
Datadog
cloud observabilityDatadog collects telemetry and monitoring signals for mainframe-integrated services to power alerts, dashboards, and incident workflows.
APM service maps with trace-to-metric correlation across dependent systems
Datadog stands out with unified observability that merges metrics, logs, and traces with a single query language. For mainframe monitoring, it connects through agents and integrations to collect host, database, and application telemetry and then correlates it across services.
It also provides service maps, dashboards, and alerting so teams can detect performance anomalies and trace them to specific dependencies. Advanced users benefit from custom monitors, multi-step workflows, and detailed event analytics for long-running batch and transaction patterns.
- +Unified metrics, logs, and traces enable correlated mainframe troubleshooting
- +Service maps reveal dependency chains across batch jobs and backend services
- +High-cardinality custom monitors support precise batch SLAs and error rates
- +Flexible dashboards combine KPIs, logs, and traces in one view
- +Automation features improve alert workflows with routing and escalation
- –Mainframe setup and data modeling can be complex for first-time adopters
- –Pricing scales with usage, which can make mainframe telemetry expensive
- –Some mainframe-specific signals require custom ingestion and tuning
- –Alert fatigue risk increases without strong guardrails and thresholds
- –Large environments demand careful governance for tags and retention
Best for: Enterprises standardizing observability across mainframes, apps, and cloud services
Conclusion
After evaluating 10 technology digital media, Rocket z/OS Automation stands out as our overall top pick — it scored highest across our combined criteria of features, ease of use, and value, which is why it sits at #1 in the rankings above.
Use the comparison table and detailed reviews above to validate the fit against your own requirements before committing to a tool.
How to Choose the Right Mainframe Monitoring Software
This buyer’s guide helps you choose mainframe monitoring software by mapping z/OS operational needs to concrete capabilities in Rocket z/OS Automation, Broadcom AIOps for Mainframe, IBM z/OS Management Facility, and CA NetMaster. It also covers event correlation and operator workflows in IBM Tivoli Netcool Operations Insight and IBM NetView for z/OS. You will see how cross-domain observability from Dynatrace and Datadog compares to capacity-driven optimization in Turbonomic by IBM and metric-driven alerting in Zabbix.
What Is Mainframe Monitoring Software?
Mainframe monitoring software collects z/OS operational signals such as system health and workload status, then raises alerts and drives investigation workflows when thresholds or anomalies trigger. Many products also connect monitoring to action using policy-based automation, z/OS console workflows, or event correlation so operators can move from detection to remediation without manual log hunting. Tools like IBM z/OS Management Facility use z/OS-native workflows and health event integration to automate console and task actions. Tools like Rocket z/OS Automation go further by using agent-based event automation to trigger z/OS remediation workflows from monitoring signals across multiple z/OS images.
Key Features to Look For
These features determine whether a mainframe monitoring platform only notifies you or actually reduces downtime through correlated triage and controlled actions.
Monitoring-to-remediation workflows
Look for execution paths that turn monitoring events into actionable workflows. Rocket z/OS Automation excels with agent-based event automation that triggers z/OS remediation workflows from monitoring signals.
AI-assisted anomaly detection and incident-oriented correlation
Choose tools that correlate signals into incidents rather than flooding teams with raw alerts. Broadcom AIOps for Mainframe focuses on AI-assisted anomaly detection that correlates mainframe signals into incident-oriented troubleshooting paths.
z/OS-native policy automation and console task workflows
If your operations model depends on z/OS consoles and operational policies, prioritize built-in workflow execution. IBM z/OS Management Facility provides automated console and task workflows via z/OSMF workflows and policy-based operations with health event integration.
Capacity planning and forecasting from observed mainframe performance
If you manage performance risk ahead of incidents, require integrated capacity planning. CA NetMaster combines monitoring with capacity planning and forecasting built from monitored mainframe performance metrics.
Event correlation and workflow-driven case triage for high-volume signals
Prioritize correlation, deduplication, and case workflows when mainframe event volume is high. IBM Tivoli Netcool Operations Insight aggregates and deduplicates events to support incident views and workflow-based alert triage.
End-to-end dependency visibility with service maps and root-cause analytics
Select platforms that connect batch and transaction outcomes to dependencies across the stack. Dynatrace uses Davis AI with automatic root-cause analysis and anomaly clustering across monitored services, and Datadog provides APM service maps with trace-to-metric correlation across dependent systems.
How to Choose the Right Mainframe Monitoring Software
Pick the tool whose control loop matches your operations model from z/OS automation to AI correlation to cross-domain observability.
Start with your desired control loop
If your goal is to automate remediation from monitoring triggers, evaluate Rocket z/OS Automation for agent-based event automation that launches z/OS remediation workflows. If you want AI to reduce alert storms and speed troubleshooting paths, evaluate Broadcom AIOps for Mainframe for AI-assisted anomaly detection that correlates mainframe signals into incident-oriented paths.
Validate that actions run in the environment you operate
For shops built around z/OS workflows and policy-driven console actions, IBM z/OS Management Facility provides automated console and task workflows via z/OSMF workflows. For larger environments that already rely on z/OS message automation, IBM NetView for z/OS provides rule-driven responses that route alerts to operator and downstream workflow actions.
Cover capacity risk if performance management is part of the job
If you need forecasting and workload oversight tied to observed metrics, CA NetMaster integrates capacity planning and forecasting built from monitored performance. For demand-driven performance optimization and closed-loop control, Turbonomic by IBM focuses on policy-driven recommendations or actions based on utilization and workload demand signals.
Design for noise control using correlation or deduplication
If you receive high-volume monitoring feeds, IBM Tivoli Netcool Operations Insight aggregates and deduplicates events to reduce alert noise and supports workflow-driven case triage. If you build your own metric logic and want discovery-driven templating, Zabbix provides trigger-based event generation with discovery rules and templated monitoring configurations.
Align mainframe visibility with application and infrastructure dependencies
If you troubleshoot based on how mainframe work impacts services, Dynatrace provides distributed tracing and Davis AI root-cause analysis that links mainframe interactions to service and user outcomes. If you standardize observability across mainframes, apps, and cloud systems, Datadog unifies metrics, logs, and traces with APM service maps for dependency chains and trace-to-metric correlation.
Who Needs Mainframe Monitoring Software?
Mainframe monitoring software fits teams that must detect z/OS operational issues, reduce alert noise, and connect signals to workflows that operators can execute.
Enterprises automating z/OS monitoring-to-remediation across multiple mainframe systems
Rocket z/OS Automation is the best match when you need agent-based event automation that triggers remediation workflows from monitoring signals across multiple z/OS images. This segment also benefits from operational auditability using automation history for incident follow-ups.
Enterprises needing AI-driven mainframe anomaly correlation and automated triage workflows
Broadcom AIOps for Mainframe fits teams that want AI-assisted anomaly detection and correlated incident-oriented troubleshooting paths. This model helps reduce repetitive alert storms by correlating mainframe operational signals into actionable incidents.
Mainframe operations teams running z/OS policy workflows and console automation
IBM z/OS Management Facility is designed for automated monitoring and workflow execution using z/OSMF workflows and health event integration. IBM NetView for z/OS fits environments that depend on z/OS message automation rules to route alerts to operator consoles and downstream workflows.
Teams that must forecast capacity and manage performance risk before incidents
CA NetMaster fits organizations that need integrated capacity planning and forecasting built from monitored mainframe performance metrics. Turbonomic by IBM fits organizations that want closed-loop performance optimization with policy-controlled recommendations or actions tied to workload demand.
Enterprises standardizing observability across mainframes, apps, and hybrid services
Dynatrace fits teams that require AI-correlated mainframe troubleshooting using distributed tracing and service mapping tied to dependencies. Datadog fits teams that want unified observability with APM service maps and trace-to-metric correlation across dependent systems.
Common Mistakes to Avoid
Misaligned expectations and under-scoped integration work cause mainframe monitoring deployments to deliver noise or slow manual triage.
Building alerts without an action path
If teams collect signals but do not execute remediation workflows, operators still spend time hunting logs. Rocket z/OS Automation and IBM z/OS Management Facility reduce this failure mode by tying monitoring signals to workflow execution for console and task actions.
Assuming AI correlation works without integration and tuning
AI-assisted anomaly detection still requires mainframe data integration to produce usable incident signals. Broadcom AIOps for Mainframe and Dynatrace both rely on integrating telemetry and aligning configuration so anomalies translate into actionable investigations.
Overloading teams with correlated events and ungoverned rules
Event correlation can become noisy when rules and thresholds do not match your operational signals. IBM Tivoli Netcool Operations Insight reduces noise through event correlation and deduplication, while Zabbix relies on carefully configured triggers and discovery rules.
Ignoring mainframe-specific expertise for console and rule tuning
Tools that depend on z/OS message automation rules need specialized configuration skills. IBM NetView for z/OS and CA NetMaster both require admin setup, data modeling, and rule tuning work tied to mainframe expertise.
How We Selected and Ranked These Tools
We evaluated Rocket z/OS Automation, Broadcom AIOps for Mainframe, IBM z/OS Management Facility, CA NetMaster, IBM Tivoli Netcool Operations Insight, IBM NetView for z/OS, Turbonomic by IBM, Zabbix, Dynatrace, and Datadog across overall capability, feature depth, ease of use, and value for mainframe monitoring outcomes. We separated Rocket z/OS Automation from lower-ranked options by emphasizing its agent-based event automation that directly triggers z/OS remediation workflows from monitoring signals, which reduces the gap between alerting and controlled action. We also weighed how each product handles noise and triage using AI correlation in Broadcom AIOps for Mainframe, event correlation and deduplication in IBM Tivoli Netcool Operations Insight, and tracing plus dependency mapping in Dynatrace and Datadog. We used the same dimensions to assess how much operational setup effort the tool demands, including mainframe tuning requirements seen in IBM NetView for z/OS, CA NetMaster, and data integration-heavy platforms like Broadcom AIOps for Mainframe and Dynatrace.
Frequently Asked Questions About Mainframe Monitoring Software
Which tool is best when you want monitoring to trigger automated z/OS remediation workflows?
What’s the difference between anomaly correlation and event triage in mainframe operations tooling?
Which solution gives the most native, web-based operational interface for z/OS monitoring and workflows?
Which tool is strongest for performance visibility plus capacity planning using monitored mainframe trends?
How do event-based systems handle high-volume alert noise in mainframe environments?
Which option is best when your requirement includes console, network, and application event automation on z/OS?
What should teams use when they need closed-loop performance control rather than passive monitoring?
Which tool fits best for cost-conscious, highly customizable monitoring logic across many systems including mainframe-relevant signals?
Which solution is best for AI-driven troubleshooting that links mainframe batch and transaction performance to user experience?
Which tool is best for unified observability across metrics, logs, and traces with service maps for dependency tracing?
Tools reviewed
Primary sources checked during evaluation.
Referenced in the comparison table and product reviews above.
Keep exploring
Comparing two specific tools?
Software Alternatives
See head-to-head software comparisons with feature breakdowns, pricing, and our recommendation for each use case.
Explore software alternatives→In this category
Technology Digital Media alternatives
See side-by-side comparisons of technology digital media tools and pick the right one for your stack.
Compare technology digital media tools→FOR SOFTWARE VENDORS
Not on this list? Let’s fix that.
Our best-of pages are how many teams discover and compare tools in this space. If you think your product belongs in this lineup, we’d like to hear from you—we’ll walk you through fit and what an editorial entry looks like.
Apply for a ListingWHAT THIS INCLUDES
Where buyers compare
Readers come to these pages to shortlist software—your product shows up in that moment, not in a random sidebar.
Editorial write-up
We describe your product in our own words and check the facts before anything goes live.
On-page brand presence
You appear in the roundup the same way as other tools we cover: name, positioning, and a clear next step for readers who want to learn more.
Kept up to date
We refresh lists on a regular rhythm so the category page stays useful as products and pricing change.