GITNUXSOFTWARE ADVICE
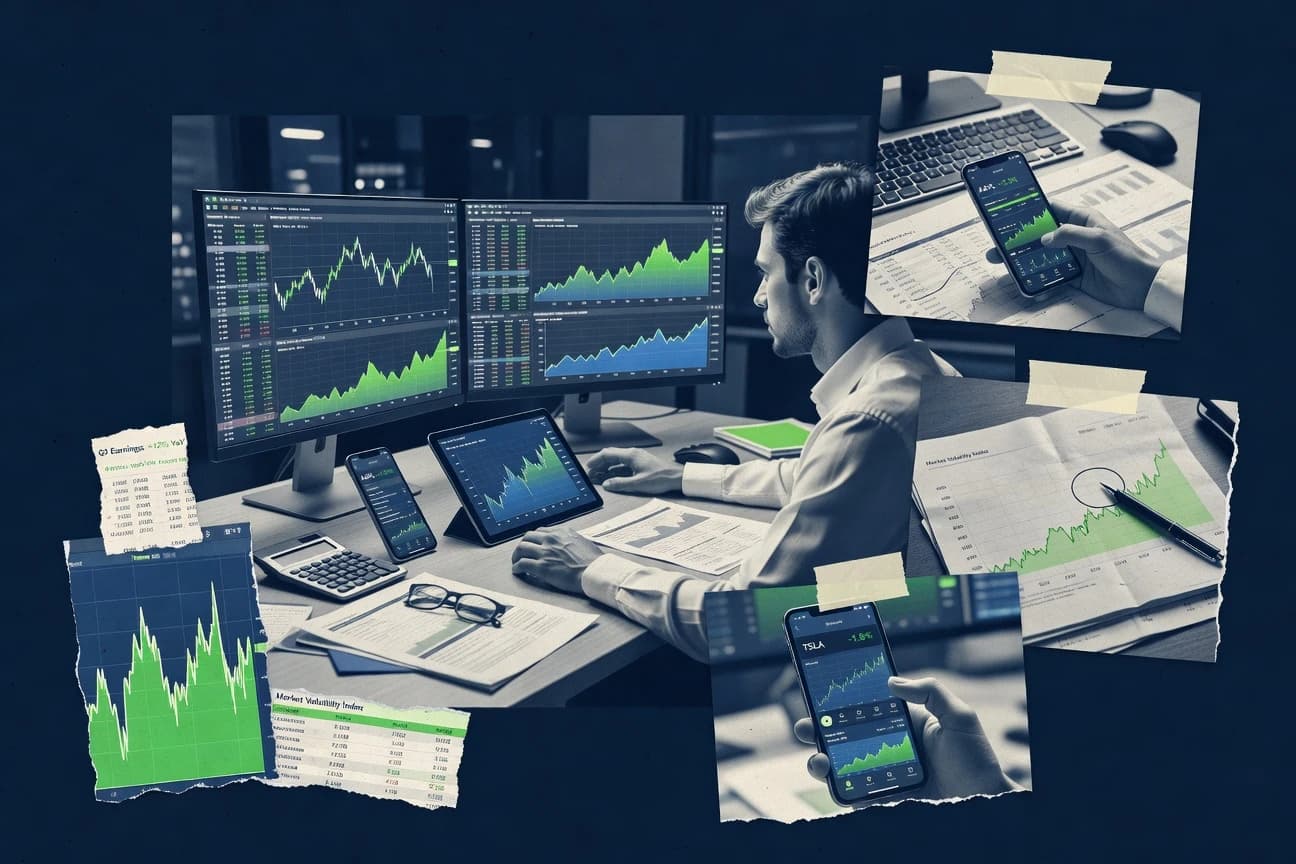
Finance Financial ServicesTop 10 Best Investor Software of 2026
Explore top 10 best investor software to streamline trading, analyze markets & boost returns. Find your perfect tool today—start investing smarter now.

How we ranked these tools
Core product claims cross-referenced against official documentation, changelogs, and independent technical reviews.
Analyzed video reviews and hundreds of written evaluations to capture real-world user experiences with each tool.
AI persona simulations modeled how different user types would experience each tool across common use cases and workflows.
Final rankings reviewed and approved by our editorial team with authority to override AI-generated scores based on domain expertise.
Score: Features 40% · Ease 30% · Value 30%
Gitnux may earn a commission through links on this page — this does not influence rankings. Editorial policy
Editor’s top 3 picks
Three quick recommendations before you dive into the full comparison below — each one leads on a different dimension.
TradingView
Pine Script for custom indicators, strategies, and automated alert conditions
Built for investors needing fast chart research, custom indicators, and alert-driven monitoring.
MetaTrader 4
Editor pickStrategy Tester with strategy replay and tick-level backtesting for expert advisors
Built for investors running rule-based strategies and tracking trades on a desktop terminal.
MetaTrader 5
Editor pickStrategy Tester with genetic algorithm optimization for Expert Advisors in MT5.
Built for traders and quant-minded investors building automated strategies with rigorous charting..
Related reading
- Finance Financial ServicesTop 10 Best Investor Management Software of 2026
- Finance Financial ServicesTop 10 Best Investor Relationship Management Software of 2026
- Finance Financial ServicesTop 10 Best Private Equity Investor Relations Software of 2026
- Real Estate PropertyTop 10 Best Property Investor Software of 2026
Comparison Table
This comparison table evaluates leading investor software used for market analysis, charting, and trade execution, including TradingView, MetaTrader 4, MetaTrader 5, TC2000, TrendSpider, and more. Each row highlights key capabilities so traders can compare platforms by workflow fit, analytics depth, and integration options before choosing a tool for their strategy.
TradingView
chartingProvides web and mobile charting, technical indicators, and strategy alerts for market analysis and trading workflows.
Pine Script for custom indicators, strategies, and automated alert conditions
TradingView stands out with chart-first investing tools that combine real-time market data, customizable technical analysis, and social idea sharing. Investors can build watchlists, create advanced indicators and strategies with Pine Script, and monitor alerts for price and indicator conditions.
The platform also supports multi-timeframe analysis, extensive drawing tools, and portfolio-style insights using broker connections and market watch features. Chart publishing and community scripts make it easier to discover proven setups and reuse analysis across symbols.
- +Charting engine supports multi-timeframe layouts and detailed drawing tools
- +Pine Script enables custom indicators, strategies, and backtesting logic
- +Alert engine triggers on price levels and indicator conditions across symbols
- +Large public library of indicators and scripts accelerates analysis setup
- –Portfolio functionality is limited compared with full accounting and tax workflows
- –Strategy backtests depend on assumptions that can diverge from live execution
- –Some advanced workflows feel complex for investors focused on simple signals
- –Advanced visual customization can slow down heavily annotated charts
Best for: Investors needing fast chart research, custom indicators, and alert-driven monitoring
More related reading
MetaTrader 4
broker terminalDelivers broker-connected trading terminals with automated strategies through MQL-based expert advisors.
Strategy Tester with strategy replay and tick-level backtesting for expert advisors
MetaTrader 4 stands out for its long-standing charting and automated trading workflow built around expert advisors and custom indicators. It supports multi-asset market data feeds, order types for trading execution, and backtesting with strategy replay for rule-based systems.
Investors also get built-in risk controls like stop loss and take profit placement, plus a trade journal view to track outcomes. The ecosystem includes third-party indicators and trading robots that expand functionality without platform-level customization.
- +Robust automated trading via expert advisors and custom indicators
- +Backtesting with strategy tester and visual chart replay for execution logic
- +Broad broker support and consistent order ticket features for execution control
- +MQL4 programming enables advanced custom indicators and trading logic
- –UI complexity can slow setup for nontechnical investors and portfolio tracking
- –Backtesting limitations may not capture full market microstructure effects
- –Desktop-first workflow reduces convenience for investors needing mobile oversight
- –Risk monitoring features are basic compared with portfolio analytics suites
Best for: Investors running rule-based strategies and tracking trades on a desktop terminal
MetaTrader 5
broker terminalOffers an upgraded trading terminal with advanced order types and MQL automated trading support for live and backtesting.
Strategy Tester with genetic algorithm optimization for Expert Advisors in MT5.
MetaTrader 5 stands out for combining a full multi-asset trading terminal with a robust strategy development workflow for automated systems. It supports advanced order types, market depth, and extensive technical indicators alongside a built-in backtesting and optimization environment. The platform also enables deployment of algorithmic strategies through Expert Advisors and signaling via alerts tied to charts.
- +Expert Advisors and indicators cover trading automation and research in one terminal.
- +Backtesting and strategy optimization support repeatable evaluation of trading logic.
- +Charting, technical indicators, and order execution tools are tightly integrated.
- +Supports hedging and advanced trade features through a mature execution model.
- –Algorithmic development and debugging in MQL5 adds complexity for non-coders.
- –Backtest results can diverge from live trading without careful modeling and validation.
- –Workspaces and layout customization can feel rigid compared with newer platforms.
- –Data and connectivity issues can disrupt workflows during live market hours.
Best for: Traders and quant-minded investors building automated strategies with rigorous charting.
TC2000
stock analysisCombines screening, charting, and trading tools for US and global markets with portfolio and watchlist support.
Advanced Stock Scans with customizable criteria that jump directly into analysis charts
TC2000 stands out for its scan-to-chart workflow and highly configurable charting for equities and ETFs. It combines watchlists, real-time market quotes, advanced screening, and technical chart studies to support day trading and swing analysis. The platform also emphasizes strategy-style review with saved layouts, custom indicators, and historical analysis tools.
- +Fast scan-to-chart process for equities and ETFs
- +Highly configurable charting with extensive study options
- +Flexible watchlists for organizing symbols and alerts
- –Advanced scanners and layouts can take time to master
- –Technical-tool depth can overwhelm users focused on simple investing
- –Workflow depends heavily on chart-centric analysis
Best for: Active equity and ETF traders using technical screens and chart-driven workflows
TrendSpider
AI technical analysisUses automated technical analysis features like trendlines and pattern detection to speed up market research and decision-making.
Automated trendline detection that updates in real time
TrendSpider stands out for automated trendline drawing with real-time analytics and technical indicator signals that update as markets move. It supports backtesting of trading ideas, portfolio-style watchlists, and alerts built around predefined chart conditions.
The platform emphasizes visual charting and automated pattern tools over manual indicator setup, which speeds up research for many market styles. It also integrates brokerage connectivity for trade alerts and order workflows, with chart data designed for iterative strategy refinement.
- +Automated trendlines reduce manual charting effort
- +Backtesting supports validating indicator-driven strategies
- +Real-time alerts tie signals to actionable chart conditions
- +Advanced charting handles multiple timeframes and indicators
- –Strategy setup can feel complex for beginners
- –Automation outputs still require human verification
- –Chart rendering and scanning can be heavy on performance
Best for: Active investors needing automated chart analysis and signal alerts
Koyfin
investment dashboardsProvides dashboards for equities, fixed income, macro research, and portfolio analytics with customizable data views.
Cross-asset interactive dashboards that combine macro, equities, FX, and rates in one workspace
Koyfin stands out for combining market data, multi-asset charting, and interactive dashboards in one workspace with configurable watchlists. It supports equity, macro, rates, FX, and commodities views, with tools for peer comparison, factor-style screening, and event-style analysis through saved layouts.
Users can build models and workflows around time series data, then export visuals and tables for sharing. The experience emphasizes fast visual iteration more than deep single-name fundamental workflows.
- +Unified dashboards across equities, macro, FX, rates, and commodities
- +Fast visual exploration with saved layouts and customizable watchlists
- +Peer and segment comparisons support quicker relative valuation checks
- +Interactive charts and tables speed up analyst-style narrative building
- –Deep fundamental research and filings workflows are limited
- –Advanced modeling requires more setup than spreadsheet-based workflows
- –Some data coverage gaps can force external tools for niche metrics
- –Collaboration and governance features lag behind dedicated platforms
Best for: Analysts building cross-asset dashboards and fast relative valuation views
Seeking Alpha
researchAggregates earnings data, market commentary, and investment research with watchlists and portfolio tracking.
Stock Ideas and author-driven research streams tied to tickers and earnings catalysts
Seeking Alpha stands out for turning market research into shareable, analyst-style articles and stock ideas. The platform offers real-time and historical market data, earnings and fundamental context, and portfolio tracking features for following positions.
It also provides screening and sentiment-style signals through author activity and earnings coverage, which helps users triangulate catalysts. Research quality varies by author, so the main value comes from curating sources and themes rather than relying on one standardized model.
- +Large library of equity research focused on companies, sectors, and catalysts
- +Portfolio tracking links holdings to ongoing coverage and relevant article streams
- +Market data tools support fundamental comparison for stock idea follow-through
- –Author coverage can be uneven across tickers and themes
- –Signal extraction requires more curation than structured institutional workflows
- –Search and filtering can feel complex when narrowing to specific thesis criteria
Best for: Investors who screen ideas through published research and maintain annotated watchlists
Morningstar Direct
professional researchSupplies investment research and portfolio analytics tooling for funds, stocks, and asset allocation decisions.
Fund and portfolio attribution with holdings-level drilldowns for performance decomposition.
Morningstar Direct stands out for research-grade portfolio and market analytics tied to Morningstar’s data coverage and methodology. The platform supports screening, portfolio construction workflows, and multi-asset valuation and performance analysis for investment teams.
Users can build repeatable models and reports with flexible output formats for ongoing research and client deliverables. Broad functionality covers equities, funds, fixed income, and macro inputs, with strong emphasis on attribution and underlying holdings transparency.
- +Deep fund, equity, and fixed income analytics with strong attribution views
- +Flexible screens and research workflows for repeatable, team-based analysis
- +Modeling and reporting tools support export-ready investment research outputs
- –Power-user setup and data navigation can feel heavy for first-time users
- –Some workflows require training to use efficiently across research teams
- –Customization is strong but can slow down ad hoc analysis
Best for: Investment research teams needing attribution, screening, and portfolio analytics.
Portfolio Performance
open-source portfolioOpen-source desktop portfolio tracker that imports transactions and supports performance, allocation, and tracking by security.
Performance calculation with configurable benchmarks and cash-flow handling using TWR and MWR methods
Portfolio Performance focuses on portfolio tracking with detailed performance reporting and practical accounting features for investors. It supports security and transaction imports, time-weighted and money-weighted return calculations, and portfolio allocation analytics.
The tool stands out for its spreadsheet-like flexibility in how assets, cash flows, and valuations drive reporting outputs. It is also known for extensibility through plugins that expand reports and data handling.
- +Time-weighted and money-weighted performance calculations with cash-flow awareness
- +Rich reporting for holdings, allocations, and realized versus unrealized results
- +Plugin-driven extensibility for adding data sources and extra reports
- +Import-focused workflows for transactions and security data
- –Setup and data modeling require deliberate configuration
- –User interface feels technical compared with browser-based portfolio tools
- –Some advanced reporting workflows take effort to learn
Best for: Investors needing desktop-grade performance analytics with customizable reports
Sharesight
portfolio trackingTracks investment portfolios with income, cost basis, and performance reporting across many accounts and asset types.
Dividend and corporate-action aware performance calculations inside portfolio reporting
Sharesight stands out for portfolio-grade performance reporting tied to shareholder actions like dividends and corporate events. The platform tracks holdings, calculates returns, and produces tax- and income-focused views for investors and advisors.
Strong reporting covers unrealized and realized performance, income history, and benchmark-style comparisons across accounts and holdings. The experience is most effective when portfolios are maintained in a structured way that keeps holdings and action data synchronized.
- +Automates dividend and corporate-action impact on portfolio performance reports
- +Produces detailed income and total return reporting across multiple accounts
- +Supports watchlists and consistent tracking of positions over time
- –Setup and data cleanup are required to keep holdings and actions accurate
- –Advanced reporting customization can feel less flexible than spreadsheet workflows
- –Some analyses depend heavily on complete and correctly categorized holdings data
Best for: Investors needing dividend and total-return tracking with detailed portfolio reporting
Conclusion
After evaluating 10 finance financial services, TradingView stands out as our overall top pick — it scored highest across our combined criteria of features, ease of use, and value, which is why it sits at #1 in the rankings above.
Use the comparison table and detailed reviews above to validate the fit against your own requirements before committing to a tool.
How to Choose the Right Investor Software
This buyer’s guide helps select investor software built for chart research, market screening, trading automation, and portfolio reporting. It covers TradingView, MetaTrader 4, MetaTrader 5, TC2000, TrendSpider, Koyfin, Seeking Alpha, Morningstar Direct, Portfolio Performance, and Sharesight. Each section maps concrete tool capabilities to specific investor workflows like alerts, automated strategies, attribution, and dividend-aware performance.
What Is Investor Software?
Investor software is a workflow platform that turns market data into actionable screens, charts, alerts, and performance reporting. It solves problems like tracking positions and cash flows, validating trade ideas with backtesting, and organizing research across watchlists and dashboards. Tools like TradingView deliver chart-first research plus Pine Script alerts. Tools like Sharesight deliver dividend and corporate-action aware portfolio reporting with income history and total return views.
Key Features to Look For
These features determine whether an investor can move from analysis to execution and then to correct performance reporting without rebuilding the workflow in spreadsheets.
Custom indicator and strategy logic with automation-ready alerts
TradingView supports Pine Script for custom indicators, strategies, and automated alert conditions tied to price and indicator rules. TrendSpider accelerates signal creation by using automated trendline detection that updates in real time and drives alerting from predefined chart conditions.
Backtesting and execution validation for rule-based strategies
MetaTrader 4 includes the Strategy Tester with strategy replay and tick-level backtesting for expert advisors and custom indicators. MetaTrader 5 adds a Strategy Tester with genetic algorithm optimization for Expert Advisors plus backtesting and optimization capabilities.
Scan-to-chart workflows for equities and ETFs
TC2000 emphasizes a scan-to-chart workflow with Advanced Stock Scans that use customizable criteria and jump directly into analysis charts. This design supports active chart-driven equity and ETF investors who want screens to immediately feed technical review.
Automated chart analysis to reduce manual trendline work
TrendSpider automatically detects trendlines and updates them as markets move. This reduces manual chart setup effort while still enabling backtesting and real-time alerts connected to chart conditions.
Cross-asset dashboards for relative valuation and multi-market context
Koyfin provides cross-asset interactive dashboards that combine macro, equities, FX, and rates in one workspace. It supports peer and segment comparisons plus saved layouts that speed up repeated analyst-style narrative building.
Attribution, performance decomposition, and investor-grade reporting
Morningstar Direct delivers fund and portfolio attribution with holdings-level drilldowns for performance decomposition. Sharesight focuses on dividend and corporate-action aware performance calculations that produce income history and total return reporting across multiple accounts.
How to Choose the Right Investor Software
Selection comes down to matching the tool’s primary workflow to the way investment decisions and record-keeping happen end to end.
Start with the primary workflow: chart research, automation, or portfolio accounting
Choose TradingView when the daily process is chart research with custom Pine Script logic and alert-driven monitoring across multiple symbols. Choose MetaTrader 4 or MetaTrader 5 when the process is executing and validating automated rule-based strategies using expert advisors, strategy tester backtesting, and chart-integrated signals.
Match analysis depth to the asset type and research style
Select TC2000 for equities and ETFs when rapid scan-to-chart exploration is the main path from screening to technical review. Select Koyfin for cross-asset analysis that blends macro, FX, rates, commodities, and equities inside interactive dashboards with peer comparisons and saved layouts.
Decide how alerts and signals should be created and maintained
Pick TradingView if alerts must be derived from custom indicator or strategy conditions written in Pine Script. Pick TrendSpider if the main goal is faster chart setup through automated trendline detection that feeds real-time analytics and alert conditions.
Ensure portfolio reporting matches the actions that drive returns
Choose Sharesight when dividends and corporate actions must be reflected in performance reports with income history and total return calculations. Choose Morningstar Direct when attribution and holdings-level performance decomposition are required for investment teams building repeatable screens and research outputs.
Pick a tool that aligns with how transactions and returns are tracked
Select Portfolio Performance when performance depends on importing transactions and modeling time-weighted and money-weighted returns with cash-flow awareness plus configurable benchmarks. Choose Seeking Alpha when the investment process is anchored to curated stock ideas from published research streams and catalyst-focused watchlists tied to earnings coverage.
Who Needs Investor Software?
Investor software fits distinct workflows, so each audience should map its daily tasks to the tool that already supports those tasks.
Chart-first investors who need alerts and custom indicators
TradingView fits investors who monitor multiple symbols using chart-first workflows, Pine Script custom indicators, and automated alert conditions tied to price and indicator rules. TrendSpider fits active investors who want automated trendline detection and real-time alerting without manually drawing and maintaining trendlines.
Investors running automated strategies on a desktop terminal
MetaTrader 4 fits investors who run rule-based expert advisors and want the Strategy Tester with strategy replay and tick-level backtesting for execution logic. MetaTrader 5 fits quant-minded investors who want a more advanced execution model plus strategy optimization in the Strategy Tester using genetic algorithm optimization.
Active equity and ETF traders who rely on technical screening
TC2000 fits traders who use Advanced Stock Scans to apply customizable criteria and jump directly into analysis charts with configurable studies. This scan-to-chart flow matches day trading and swing analysis workflows that center on equities and ETFs.
Cross-asset analysts and research teams building multi-market views
Koyfin fits analysts who need cross-asset interactive dashboards that combine macro, equities, FX, and rates with peer and segment comparisons. Morningstar Direct fits investment research teams that require fund and portfolio attribution with holdings-level drilldowns plus attribution-focused reporting and screens.
Investors tracking dividends and corporate actions for total returns
Sharesight fits investors and advisors who need dividend and corporate-action aware performance calculations, income history, and total return reporting across multiple accounts. Portfolio Performance fits investors who require detailed performance reporting that incorporates cash-flow handling using time-weighted and money-weighted return methods.
Investors who build portfolios from published research and catalysts
Seeking Alpha fits investors who screen ideas through analyst-style articles and maintain annotated watchlists tied to earnings catalysts. Portfolio tracking in Seeking Alpha supports following positions by linking holdings to relevant coverage and research streams.
Common Mistakes to Avoid
Common selection errors come from buying the wrong primary workflow and then forcing it to behave like a portfolio accounting system or a coding environment it was not built for.
Choosing charting first and expecting full accounting and tax-ready workflows
TradingView delivers chart-first portfolio-style insights but portfolio functionality is limited compared with full accounting and tax workflows. Portfolio Performance and Sharesight focus on transaction-aware performance and dividend-aware reporting that better matches accounting-style needs.
Assuming backtest results will always match live execution without model validation
TradingView strategy backtests rely on assumptions that can diverge from live execution if modeling is simplified. MetaTrader 4 and MetaTrader 5 both support backtesting, but backtest results can diverge from live trading without careful modeling and validation.
Underestimating setup complexity when automation and scanners have a learning curve
TrendSpider’s strategy setup can feel complex for beginners even though automated trendlines and alerting reduce manual effort. TC2000’s advanced scanners and layouts can take time to master, which can slow down users focused only on simple signals.
Mixing unstructured research feeds with portfolio reports that require clean, synchronized position data
Seeking Alpha’s research value depends on curating sources and themes across authors, which can create inconsistent signal extraction. Sharesight requires holdings and action data to be maintained in a structured way so dividend and corporate-action performance calculations stay accurate.
How We Selected and Ranked These Tools
we evaluated every tool on three sub-dimensions. Features carry weight 0.40, ease of use carries weight 0.30, and value carries weight 0.30. The overall rating is a weighted average calculated as overall = 0.40 × features + 0.30 × ease of use + 0.30 × value. TradingView separated itself from lower-ranked chart tools by scoring highly on features for Pine Script that enables custom indicators, strategies, and automated alert conditions across symbols.
Frequently Asked Questions About Investor Software
Which investor software best supports chart-first research with custom signals?
What’s the fastest way to set up automated rule-based trading and backtests on a desktop terminal?
Which platform is better for algorithm development that needs optimization and broader market features?
Which tool helps equity and ETF traders scan for setups and jump straight into analysis charts?
How do investors automate technical pattern detection without manually drawing indicators each time?
Which software is best for cross-asset dashboards and relative valuation workflows?
Where can investors tie research articles and catalysts directly to tickers and earnings context?
Which option is designed for portfolio analytics that emphasize attribution and holdings-level drilldowns?
What investor software handles performance reporting with cash flows and both time-weighted and money-weighted returns?
Which tool is built for dividend and corporate-action aware reporting across accounts and holdings?
Tools reviewed
Primary sources checked during evaluation.
Referenced in the comparison table and product reviews above.
Keep exploring
Comparing two specific tools?
Software Alternatives
See head-to-head software comparisons with feature breakdowns, pricing, and our recommendation for each use case.
Explore software alternatives→In this category
Finance Financial Services alternatives
See side-by-side comparisons of finance financial services tools and pick the right one for your stack.
Compare finance financial services tools→FOR SOFTWARE VENDORS
Not on this list? Let’s fix that.
Our best-of pages are how many teams discover and compare tools in this space. If you think your product belongs in this lineup, we’d like to hear from you—we’ll walk you through fit and what an editorial entry looks like.
Apply for a ListingWHAT THIS INCLUDES
Where buyers compare
Readers come to these pages to shortlist software—your product shows up in that moment, not in a random sidebar.
Editorial write-up
We describe your product in our own words and check the facts before anything goes live.
On-page brand presence
You appear in the roundup the same way as other tools we cover: name, positioning, and a clear next step for readers who want to learn more.
Kept up to date
We refresh lists on a regular rhythm so the category page stays useful as products and pricing change.