GITNUXSOFTWARE ADVICE
Finance Financial ServicesTop 9 Best Stock Watching Software of 2026
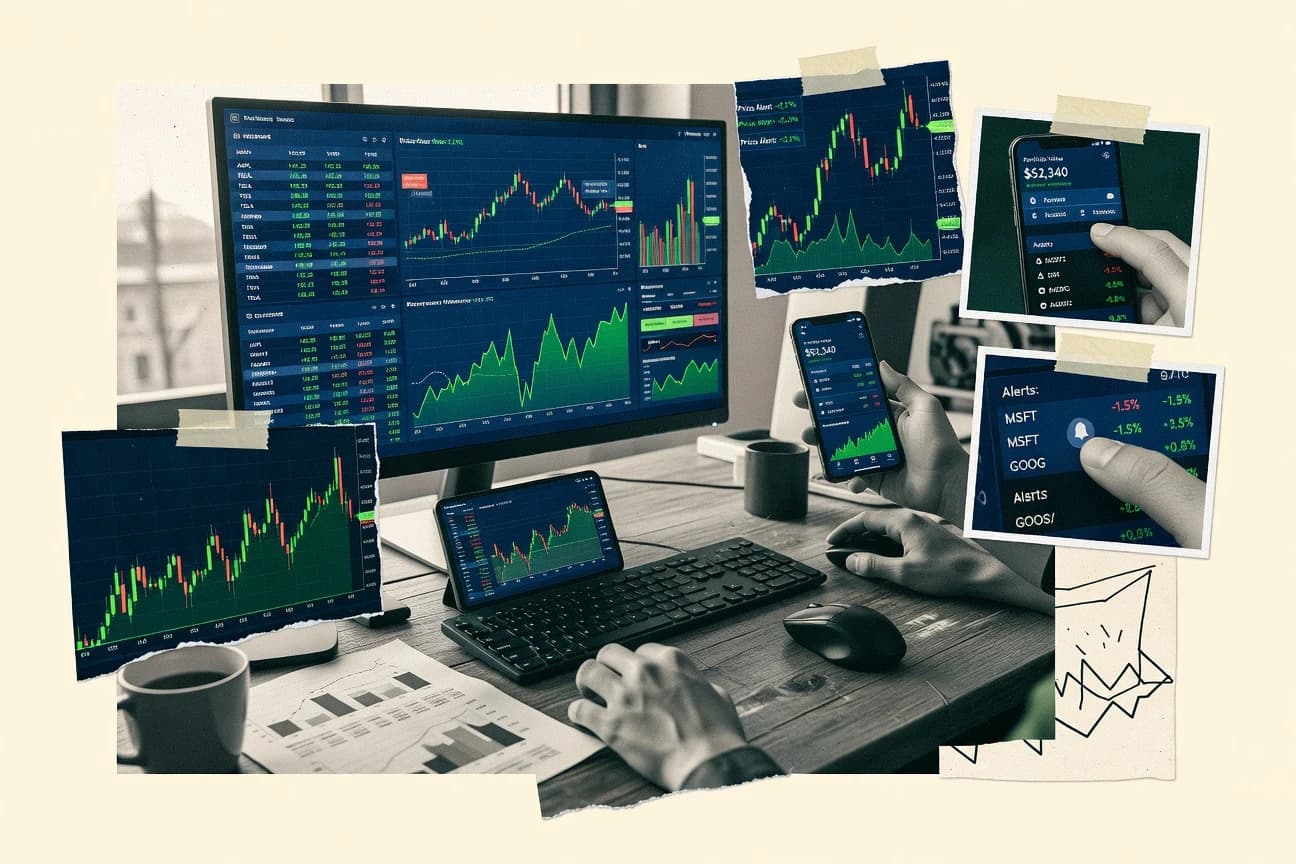
Find the top 10 best stock watching software to track market trends. Read our guide to discover the best tools for investors—click now

How we ranked these tools
Core product claims cross-referenced against official documentation, changelogs, and independent technical reviews.
Analyzed video reviews and hundreds of written evaluations to capture real-world user experiences with each tool.
AI persona simulations modeled how different user types would experience each tool across common use cases and workflows.
Final rankings reviewed and approved by our editorial team with authority to override AI-generated scores based on domain expertise.
Score: Features 40% · Ease 30% · Value 30%
Gitnux may earn a commission through links on this page — this does not influence rankings. Editorial policy
Editor’s top 3 picks
Three quick recommendations before you dive into the full comparison below — each one leads on a different dimension.
TradingView
Condition-based alerts tied to indicator states on TradingView charts
Built for active traders monitoring many stocks with chart alerts and indicator-based workflows.
Finviz
Editor pickInteractive stock screener with heatmap visualization and filterable fundamental metrics
Built for traders needing quick visual screening and simple persistent watchlists.
Investing.com
Editor pickStock page layout that combines interactive charts, live headlines, and technical indicators
Built for traders needing integrated news, charts, and watchlists for active stock monitoring.
Related reading
Comparison Table
This comparison table evaluates stock watching software used to track market trends, monitor watchlists, and scan for trading or investing opportunities. It benchmarks tools such as TradingView, Finviz, Investing.com, MarketWatch, and Koyfin across core capabilities so readers can spot the best fit for their research workflow.
TradingView
charting-and-alertsProvides interactive charting, watchlists, screener tools, alerts, and real-time market data for stocks and other assets.
Condition-based alerts tied to indicator states on TradingView charts
TradingView stands out for visual charting plus collaborative social signals around watchlists and ideas. It supports multi-asset watchlists, advanced chart indicators, and alerting for price and study conditions.
The platform also enables scanning-style discovery using built-in screeners and saved criteria, which helps convert watchlists into actionable trade monitoring. Real-time updates and customizable layouts make it a strong stock watching workspace for frequent monitoring.
- +Highly customizable watchlists tied directly to responsive interactive charts
- +Alerting supports price and indicator conditions for proactive monitoring
- +Large library of indicators and charting tools speeds up analysis setup
- +Saved layouts and watchlist workflows reduce repeat configuration effort
- +Community ideas provide contextual review for symbols on watchlists
- –Screening and scanning depth varies by data sources and region
- –Chart-centric workflows can feel heavy for users needing pure tabular watchlists
- –Alert management becomes complex with many instruments and conditions
Best for: Active traders monitoring many stocks with chart alerts and indicator-based workflows
More related reading
Finviz
screener-and-heatmapsDelivers fast stock screeners, heatmaps, quote pages, and customizable watchlists with configurable filters.
Interactive stock screener with heatmap visualization and filterable fundamental metrics
Finviz stands out with fast, visual screening using stock heatmaps and dense fundamentals tables. It delivers core stock watching capabilities through customizable screeners, watchlists, and alerting tied to filter criteria.
The platform also supports interactive charting and sortable metrics like valuation, performance, and technical indicators. Limited workflow depth and fewer automation controls constrain advanced monitoring compared with heavier trading workstations.
- +Heatmap and table-based screener make market scans visually fast
- +Watchlists persist across sessions with practical add-remove workflows
- +Screen results are filterable and sortable across fundamentals and price
- –Alerting is less flexible than full event-condition automation
- –Watchlist management lacks advanced grouping and rule-driven organization
- –Technical indicator depth is limited versus trading-focused platforms
Best for: Traders needing quick visual screening and simple persistent watchlists
Investing.com
market-news-and-watchlistsOffers stock watchlists, technical charts, market news, and alert tools for monitoring equities and sectors.
Stock page layout that combines interactive charts, live headlines, and technical indicators
Investing.com stands out with broad market coverage and stock pages that combine price, technical signals, news, and fundamentals in one place. The platform supports watchlists for stock tracking, price and volatility context, and alerting tied to market moves. It also layers research content like analyst sentiment and historical charts into the stock monitoring workflow.
- +Rich stock pages merge charts, news, and fundamentals for quick scanning
- +Watchlists support practical day-to-day monitoring across multiple exchanges
- +Technical indicators and market data reduce the need for extra tools
- –Alert setup feels less streamlined than dedicated watchlist tools
- –Information density can slow decision-making during fast market moves
- –Watchlist workflows lack advanced portfolio analytics found in specialists
Best for: Traders needing integrated news, charts, and watchlists for active stock monitoring
MarketWatch
quote-and-watchlistsProvides stock quote pages, watchlists, portfolio views, and market commentary to support ongoing monitoring.
MarketWatch editorial news streams linked directly to individual ticker pages
MarketWatch stands out for combining stock quotes with news and market coverage in a single watch-style experience. It supports price tracking, watchlist-style monitoring, and detailed company pages with financial and performance context.
Strong editorial coverage can support event-driven stock watching, but it relies on web-first browsing patterns rather than advanced automation. Built-in tools are best for following catalysts and reacting quickly instead of building complex alert logic.
- +Tightly integrated stock quotes with continuous market and company news
- +Rich company pages with fundamentals, key statistics, and performance views
- +Clear watchlist-style organization that helps track multiple tickers
- –Limited advanced alert rules for condition-heavy stock screening
- –Watch experience is more browsing-led than automation-led
- –Information density can slow quick scanning during fast markets
Best for: Investors tracking stocks using news-driven context and simple watchlists
Koyfin
multi-asset-dashboardsCombines watchlists with multi-asset dashboards, research views, and charting for tracking market trends.
Koyfin Dashboard panels for multi-asset watchlists with live chart composition
Koyfin stands out for combining portfolio-style research with real-time market data into interactive dashboards for watching stocks. It supports watchlists, multi-factor screening, and charting across equities, ETFs, and macro themes.
The platform also includes connected valuation, fundamentals, and analyst-style views that help compare companies and regions quickly. Its strength is visual workflows for monitoring trends rather than transaction-level trade execution.
- +Interactive dashboards make stock and macro monitoring visually fast
- +Flexible screening supports targeted watchlist building by fundamentals and themes
- +Comparative charts speed up peer and region-level analysis
- –Interface complexity slows new users building effective watch workflows
- –Watchlist management can feel less streamlined than dedicated screeners
- –Some deeper workflows require more setup than a simple watch tool
Best for: Investors who monitor stocks with visual dashboards and comparative fundamental views
Seeking Alpha
research-and-watchlistsEnables stock watchlists with research coverage, earnings data, and charting to monitor equities and catalysts.
Ticker pages that unify analyst articles, earnings coverage, and market news in one place
Seeking Alpha stands out by combining stock watching with a large library of analyst-written articles and earnings-driven commentary tied to specific tickers. Watchlists can be built and monitored through the site’s news and author content streams.
Screening is available through built-in research tools, with market, sector, and company overviews that help filter what to watch. Coverage quality varies by author, which affects signal consistency for stock watching workflows.
- +Ticker-linked news and article feeds support fast watchlist monitoring
- +Deep article archive improves research continuity for long-term tracking
- +Topic and sector coverage helps broaden watchlist discovery beyond screens
- –Signal quality depends on author coverage depth and timeliness
- –Screening and alerts feel less systematic than dedicated watchlist platforms
- –Content volume can make it harder to spot only the most actionable events
Best for: Investors tracking tickers through news and analysis articles
TrendSpider
technical-alerts-automationTracks stocks using automated technical indicators, alerts, and watchlist workflows with chart-based automation.
AutoDraw automated trendlines and pattern detection tied to alertable signals
TrendSpider’s distinct edge is its automated, rules-driven charting with pattern detection that turns visual market observations into alertable strategies. The platform supports multi-timeframe technical analysis, including backtesting and strategy testing workflows built around chart signals.
It also offers watchlist-style monitoring with customizable alerts tied to technical conditions and indicators, reducing manual chart checking. Automated scanning and signal interpretation are strong for technical traders who want faster reactions to changing setups.
- +Automated trendline and pattern detection reduces manual chart annotation time
- +Watchlist monitoring supports alerts tied to technical indicator conditions
- +Backtesting and strategy testing support evidence-based signal evaluation
- +Multi-timeframe charting helps validate setups across time horizons
- +Built-in scan workflows streamline finding symbols with matching technical criteria
- –Setup of complex custom conditions can feel technical for new users
- –Alert logic can become hard to troubleshoot when multiple conditions interact
- –Focus on technical signals can under-serve fundamental-focused stock watchers
- –Chart-first workflow may feel slower than spreadsheet-style tracking for some users
- –Scanning performance depends on symbol universe size and selected indicators
Best for: Active technical traders monitoring charts with automated scans and signal alerts
Alpaca Markets
API-and-broker-integrationProvides market data APIs and brokerage integrations that can drive programmatic watchlists and alert systems.
Unified market data and trading API for end-to-end monitoring and execution
Alpaca Markets stands out for connecting stock and options data to trade and order workflows through the Alpaca trading API. It provides watchlist-style monitoring via market data endpoints, plus programmable filters for events like price, volume, and corporate actions.
The platform suits teams that want automation around stock alerts and analytics rather than a purely visual screener. Strong API coverage supports building custom stock watching dashboards and alert logic.
- +Comprehensive market data endpoints for building custom watch logic
- +API supports automation for alerts, scans, and execution workflows
- +Options and equities data enables richer watch criteria than stocks only
- –Core stock watching requires API integration rather than turnkey UI
- –Alerting and screening workflows need custom development effort
- –Less suited for purely visual watchlists without coding
Best for: Developers and quant teams building automated stock monitoring workflows
Finnhub
real-time-data-apiOffers market data APIs and websocket streams that support building stock tracking dashboards and alerts.
Real-time streaming quotes API for ticker-level updates
Finnhub stands out for turning market news, company fundamentals, and real-time price data into an API-first watch workflow. It supports watchlist-style tracking through streaming quotes and event-driven updates alongside company profiles and financial statement endpoints.
The platform also adds social and news feeds for sentiment signals that can complement price-based monitoring. For stock watchers, the strongest fit comes from building automated alerts, screening logic, and dashboards on top of its data model.
- +API access for streaming quotes supports near real-time watchlist updates
- +News and social sentiment endpoints help monitor catalysts tied to tickers
- +Company profiles and fundamentals endpoints support watchlist enrichment
- –Limited built-in watchlist UI reduces effectiveness for non-developers
- –Complex alert logic requires engineering effort outside simple rules
- –Data breadth can feel harder to navigate than single-purpose screeners
Best for: Developers building automated stock watchlists and alerting workflows with real-time data
Conclusion
After evaluating 9 finance financial services, TradingView stands out as our overall top pick — it scored highest across our combined criteria of features, ease of use, and value, which is why it sits at #1 in the rankings above.
Use the comparison table and detailed reviews above to validate the fit against your own requirements before committing to a tool.
How to Choose the Right Stock Watching Software
This buyer’s guide explains how to pick stock watching software by mapping watchlists, alerts, scanning, and data delivery to real monitoring workflows. It covers TradingView, Finviz, Investing.com, MarketWatch, Koyfin, Seeking Alpha, TrendSpider, Alpaca Markets, and Finnhub. The guide also highlights automation-first options like TrendSpider and API-first platforms like Alpaca Markets and Finnhub.
What Is Stock Watching Software?
Stock watching software tracks selected tickers and market signals so monitoring can happen continuously without manual chart checks. It typically combines watchlists, screening or discovery filters, and alerts that trigger on price moves or indicator conditions. Tools like TradingView focus on chart-linked watchlists and condition-based alerts, while Finviz focuses on fast heatmap screening and filterable metrics for building watchlists quickly.
Key Features to Look For
The best stock watchers win because they turn watchlist selection into repeatable workflows and they alert on the exact signals a user cares about.
Condition-based alerts tied to charts and indicator states
TradingView supports alerting based on price and indicator conditions, which enables proactive monitoring tied to technical states. TrendSpider extends this idea with alertable signals tied to automated technical pattern detection and indicator rules.
Interactive heatmaps and filterable fundamentals for fast screening
Finviz delivers an interactive stock screener with heatmap visualization and sortable, filterable fundamental metrics. This combination helps convert a broad universe into a focused watchlist without switching to a separate research workflow.
Integrated watchlist pages that combine charts, news, and technical context
Investing.com uses stock page layouts that combine interactive charts, live headlines, and technical indicators in one place. MarketWatch links editorial news streams directly to individual ticker pages so monitoring can stay catalyst-driven.
Multi-asset dashboards for comparative monitoring across equities, ETFs, and themes
Koyfin provides dashboard panels for multi-asset watchlists with live chart composition and comparative views across companies and regions. This fits monitoring tasks where the goal is to track market trends and peers rather than just individual tickers.
Research and earnings coverage unified by ticker for catalyst tracking
Seeking Alpha brings ticker pages together with analyst articles, earnings coverage, and market news so the watchlist stays connected to narrative drivers. This supports watchlist maintenance through topic and sector discovery tied to ongoing coverage.
Automated technical scans with annotation and pattern detection
TrendSpider stands out with AutoDraw automated trendlines and pattern detection that can be tied to alertable signals. It also supports automated scan workflows that help find symbols matching technical criteria faster than manual chart inspection.
How to Choose the Right Stock Watching Software
Choosing the right tool starts with matching the monitoring signals and workflow style to the platform’s alerting, scanning, and data delivery model.
Match alerts to the signals that actually drive decisions
If monitoring depends on price plus indicator conditions, TradingView is a strong fit because alerts can be tied to indicator states on its charting workspace. If monitoring depends on automated chart patterns and rule-based technical signals, TrendSpider fits because it combines pattern detection with alertable conditions and automated scanning.
Select a discovery workflow that matches how watchlists get built
For fast visual screening and quick watchlist creation, Finviz delivers heatmap-driven screening with filterable fundamental metrics. For integrated discovery and context, Investing.com and MarketWatch combine charts and live headlines on stock pages, which reduces tool switching during active monitoring.
Pick the right interface style for ongoing monitoring speed
Chart-centric workflows work well when monitoring is built around interactive charts and saved layouts, which is how TradingView supports watchlist workflows. Spreadsheet-style or strictly tabular tracking can feel slower in chart-first tools, so Finviz is often easier for dense sortable tables and heatmap scans.
Decide whether the platform should be news-driven or signal-driven
News-driven monitoring is supported by MarketWatch editorial news streams linked to ticker pages and by Investing.com stock pages that combine live headlines with charts and technical indicators. Signal-driven monitoring is supported by TrendSpider’s automated technical pattern detection and TradingView’s condition-based alerts tied to indicator conditions.
Choose automation and API support only when that matches the team’s workflow
For technical traders who want automated scans and backtesting alongside alertable setups, TrendSpider provides both scan workflows and strategy testing support around chart signals. For developers and quant teams building custom watchlists and alerts, Alpaca Markets and Finnhub provide programmatic access with real-time streaming data, and they require engineering effort instead of relying on a turnkey watchlist UI.
Who Needs Stock Watching Software?
Stock watching software benefits investors and traders who need continuous monitoring, repeatable watchlist creation, and alerting that matches their decision signals.
Active traders who monitor many stocks using chart alerts and indicator conditions
TradingView is the closest match because it supports condition-based alerts tied to indicator states and it keeps watchlists tightly linked to responsive interactive charts. TrendSpider also fits when automated pattern detection and rules-driven chart signals are the monitoring focus.
Traders who want fast visual discovery and simple persistent watchlists
Finviz fits because its heatmap and dense fundamentals table make scanning and watchlist filtering fast. Finviz supports customizable watchlists with add-remove workflows that work well for repeated daily monitoring.
Investors who want ticker-linked news and analysis to drive watchlist actions
Seeking Alpha fits because ticker pages unify analyst articles, earnings coverage, and market news in one place. MarketWatch fits when editorial news streams linked to ticker pages matter for event-driven monitoring.
Developers and quant teams building automated watchlists, alert systems, and dashboards
Alpaca Markets fits because it combines market data endpoints with a trading API that supports programmable filters and automation around stock and options data. Finnhub fits because it offers real-time streaming quotes plus fundamentals and company profile endpoints that support engineering alerts and dashboards.
Common Mistakes to Avoid
Several recurring pitfalls come from choosing a tool whose monitoring model does not match the workflow, especially around alerting complexity, scanning depth, and UI fit.
Building alert logic that becomes unmanageable across many symbols
Alert management can become complex when many instruments and conditions are involved in TradingView watch workflows. TrendSpider also needs careful condition design because multiple interacting conditions can be harder to troubleshoot.
Choosing a chart-first platform when the workflow needs fast tabular scanning
TradingView excels at interactive chart workflows but it can feel heavy for users who primarily want pure tabular watchlists. Finviz avoids this by emphasizing sortable metrics tables and heatmap screening instead of chart-centric monitoring.
Over-relying on integrated pages when the monitoring needs advanced portfolio analytics
Investing.com and MarketWatch focus on integrated stock pages and editorial context, which can slow down purely systematic portfolio analysis. Koyfin is a better match when monitoring requires comparative dashboards for multi-asset themes and peer analysis.
Using an API platform without planning for engineering effort
Alpaca Markets and Finnhub require API integration to create watchlist monitoring and alert logic, so they are not turnkey for non-developers. Finnhub also limits effectiveness for users who expect strong built-in watchlist UI because the core strength is real-time streaming data and programmable workflows.
How We Selected and Ranked These Tools
We evaluated every tool on three sub-dimensions with features weighted at 0.4, ease of use weighted at 0.3, and value weighted at 0.3. The overall rating is computed as overall = 0.40 × features + 0.30 × ease of use + 0.30 × value. TradingView separated itself from lower-ranked tools by scoring highly on features because it combines condition-based alerts tied to indicator states with highly customizable chart-linked watchlists and saved layouts. That same combination supported a faster end-to-end monitoring workflow, which improved both practical usability and perceived value for active monitoring.
Frequently Asked Questions About Stock Watching Software
Which stock watching software is best for condition-based alerts tied to chart indicators?
What tool works best for fast visual screening across many stocks?
Which platform combines stock watchlists with news and technical context on the same page?
Which software fits investors who want dashboard-style monitoring rather than chart-by-chart checking?
Which option is best for technical traders who want automated detection of trends and patterns?
Which stock watching tool is strongest for integrating real-time market data into custom dashboards?
Which platform supports automation for stock watching around events and corporate actions?
What tool best fits stock watchers who rely on analyst-written coverage and earnings commentary?
Why might a stock watcher struggle with alert accuracy or missed signals across tools?
What is the most practical workflow to start monitoring tickers and turning watchlists into actionable checks?
Tools reviewed
Primary sources checked during evaluation.
Referenced in the comparison table and product reviews above.
Keep exploring
Comparing two specific tools?
Software Alternatives
See head-to-head software comparisons with feature breakdowns, pricing, and our recommendation for each use case.
Explore software alternatives→In this category
Finance Financial Services alternatives
See side-by-side comparisons of finance financial services tools and pick the right one for your stack.
Compare finance financial services tools→FOR SOFTWARE VENDORS
Not on this list? Let’s fix that.
Our best-of pages are how many teams discover and compare tools in this space. If you think your product belongs in this lineup, we’d like to hear from you—we’ll walk you through fit and what an editorial entry looks like.
Apply for a ListingWHAT THIS INCLUDES
Where buyers compare
Readers come to these pages to shortlist software—your product shows up in that moment, not in a random sidebar.
Editorial write-up
We describe your product in our own words and check the facts before anything goes live.
On-page brand presence
You appear in the roundup the same way as other tools we cover: name, positioning, and a clear next step for readers who want to learn more.
Kept up to date
We refresh lists on a regular rhythm so the category page stays useful as products and pricing change.