GITNUXSOFTWARE ADVICE
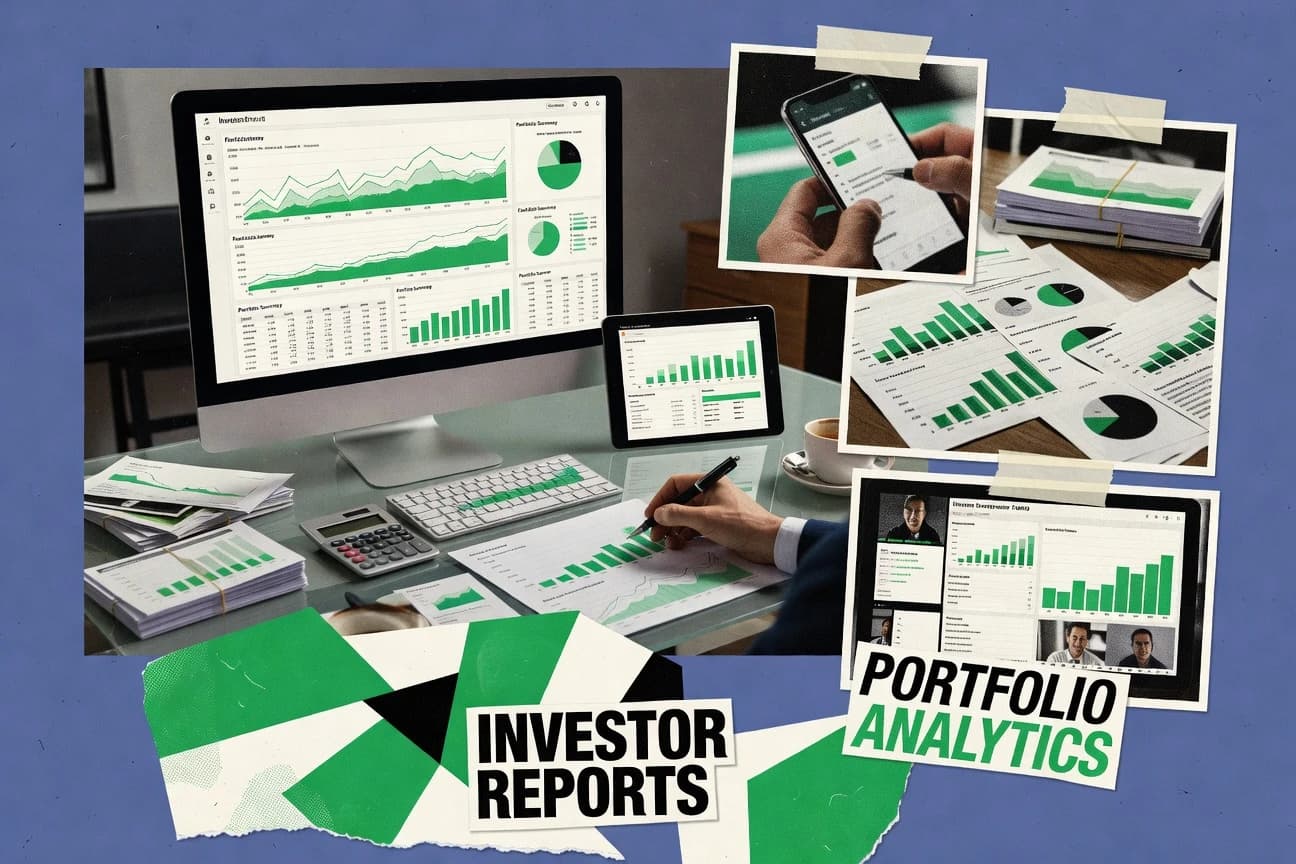
Finance Financial ServicesTop 8 Best Investor Reporting Software of 2026
Discover top 10 investor reporting software tools—simplify financial communication, boost trust. Explore rankings now.

How we ranked these tools
Core product claims cross-referenced against official documentation, changelogs, and independent technical reviews.
Analyzed video reviews and hundreds of written evaluations to capture real-world user experiences with each tool.
AI persona simulations modeled how different user types would experience each tool across common use cases and workflows.
Final rankings reviewed and approved by our editorial team with authority to override AI-generated scores based on domain expertise.
Score: Features 40% · Ease 30% · Value 30%
Gitnux may earn a commission through links on this page — this does not influence rankings. Editorial policy
Editor’s top 3 picks
Three quick recommendations before you dive into the full comparison below — each one leads on a different dimension.
Airtable
Scripting and Automations that generate report outputs from relational, permissioned data
Built for investment teams building recurring investor KPI reports from structured data.
Microsoft Power BI
Editor pickPaginated reports for print-ready investor statements and regulatory-style layouts.
Built for asset managers needing secure investor dashboards with complex metric modeling and scheduled refresh.
SS&C Advent
Editor pickAdvent Reporting and output generation tied to investor and fund accounting calculations
Built for organizations needing governed investor reporting and multi-entity accounting consolidation.
Related reading
- Finance Financial ServicesTop 10 Best Investment Reporting Software of 2026
- Real Estate PropertyTop 10 Best Cre Investor Reporting Software of 2026
- Finance Financial ServicesTop 10 Best Private Equity Investor Software of 2026
- Business FinanceTop 10 Best Cloud Based Financial Reporting Software of 2026
Comparison Table
This comparison table evaluates investor reporting software used to consolidate portfolio data, generate investor-ready reporting, and manage audit-friendly outputs across common workflows. You will compare tools including Airtable, Microsoft Power BI, SS&C Advent, eFront, and Trullion on their reporting capabilities, data integrations, and deployment fit. Use the results to shortlist options that match your reporting cadence, data sources, and compliance requirements.
Airtable
custom reportingBuilds investor reporting databases and dashboards with relational records, automated views, and exportable report outputs.
Scripting and Automations that generate report outputs from relational, permissioned data
Airtable stands out for turning investor reporting workflows into configurable base views with relational data modeling. It supports dashboards, scheduled reports, and collaboration across live linked datasets so investor figures stay consistent.
You can automate approvals and publication using built-in automations and role-based permissions. The main limitation for investor reporting is that complex financial logic and heavy formatting often require external tools or careful scripting.
- +Relational tables keep KPIs consistent across investor decks and updates
- +Dashboard views support charts, filters, and board-style reporting workflows
- +Automations reduce manual refreshes and enforce approval sequences
- –Advanced financial modeling needs external tools or custom scripts
- –Highly branded investor deck layouts require workarounds
- –Large datasets can slow performance in heavily filtered dashboard views
Best for: Investment teams building recurring investor KPI reports from structured data
More related reading
Microsoft Power BI
analytics dashboardsCreates interactive investor dashboards and scheduled report exports from connected data sources.
Paginated reports for print-ready investor statements and regulatory-style layouts.
Microsoft Power BI stands out for its deep Microsoft ecosystem integration with Excel, Azure, and Microsoft Purview labeling and governance. It provides investor reporting workflows through interactive dashboards, paginated reports, and dataset refresh from common data sources like SQL, Excel, and cloud databases.
It supports strong modeling with DAX measures, scheduled refresh, and row-level security for isolating portfolios, funds, or counterparties. Publishing and collaboration are handled through Power BI Service with app workspaces and monitored dataset performance.
- +Rich dashboard visuals for investor-ready performance and KPI narratives
- +Dataset modeling with DAX supports complex financial metrics and variance logic
- +Row-level security enables fund and account segregation for investor permissions
- +Paginated reports support pixel-precise statements and regulatory style layouts
- +Scheduled refresh and incremental refresh keep reporting current with less manual work
- –DAX complexity slows iterative financial modeling compared with simpler BI tools
- –Advanced governance features can require additional setup and licensing
- –Building paginated layouts takes more time than standard dashboard visuals
- –Live connectivity and refresh behaviors can be harder to troubleshoot at scale
Best for: Asset managers needing secure investor dashboards with complex metric modeling and scheduled refresh
SS&C Advent
alternative investment reportingSupports investment operations with portfolio data aggregation and reporting designed for alternative investment managers.
Advent Reporting and output generation tied to investor and fund accounting calculations
SS&C Advent stands out for integrating fund and investor accounting with reporting workflows built for buy-side and structured finance operations. It supports standardized reporting packs, configurable calculations, and multi-entity consolidation needed for investor statements and regulatory-style disclosures.
The product emphasizes controlled data lineage from portfolio and valuation inputs through published reports. Its depth for complex organizations comes with implementation and administration requirements that can outweigh simple investor updates.
- +Strong end-to-end investor and fund reporting built on accounting workflows
- +Configurable report logic supports multi-entity statements and consolidated outputs
- +Solid controls for calculation governance across valuations and reporting outputs
- –Implementation effort is high for teams with lightweight investor reporting needs
- –User experience can feel complex without dedicated reporting administrators
- –Change requests may require vendor or consultant involvement for quick iteration
Best for: Organizations needing governed investor reporting and multi-entity accounting consolidation
eFront
private marketsEnables fund administration reporting workflows with data management for private markets investor communications.
Investor report workflow with automated calculations and versioned, audit-ready outputs
eFront focuses on investor reporting for private markets with an end-to-end workflow that connects fund data, performance calculations, and report distribution. It supports configurable report templates and multi-level investor views so teams can produce statements for different investor classes and structures.
The platform emphasizes auditability through managed data lineage and versioned reporting outputs tied to the calculation process. It is strongest for firms that need repeatable reporting at scale across multiple funds and reporting periods.
- +Configurable investor reporting templates support complex fund structures
- +Performance and valuation workflows reduce manual spreadsheet consolidation
- +Versioned reporting outputs improve audit readiness for investor deliverables
- –Setup and data mapping require specialist effort for first deployments
- –Export and presentation customization can feel constrained versus custom BI
- –Costs can be high for smaller teams that produce few reports
Best for: Alternative asset managers needing scalable, auditable investor reporting automation
Trullion
investor operationsAutomates investor relations reporting by standardizing fund documents, workflows, and investor data operations.
Investor report automation that assembles standardized quarterly updates from portfolio metrics
Trullion focuses investor reporting automation with templated updates tied to portfolio data. It supports periodic report generation, document assembly, and investor-ready distribution workflows.
The platform is geared toward teams that need consistent metrics across funds rather than ad hoc spreadsheets. Reporting output is structured around investor performance narratives and standardized KPI sets.
- +Investor report generation built around reusable templates and standard KPIs
- +Workflow supports repeatable quarterly updates for consistent investor communications
- +Structured data feeds make reporting less dependent on manual spreadsheet edits
- –Setup effort can be high when mapping portfolio data to reporting structures
- –Customization depth may lag teams needing fully bespoke investor report formats
- –Advanced automation likely requires more admin oversight than simple tools
Best for: VC and PE teams automating recurring investor reports across multiple funds
Carta
equity managementProduces equity investor reporting and cap table related reporting through centralized investor data and communications workflows.
Equity event history powering investor reporting with traceable, audit-ready ownership changes
Carta is distinct for combining equity management and cap table governance with investor-ready reporting in one system. It supports cap table maintenance, option and equity plan tracking, and audit-friendly change history.
Investor reporting workflows let teams generate structured updates for rounds, valuations, and ownership changes tied to equity events. It works best for organizations that already run equity administration inside Carta rather than exporting raw data to spreadsheets.
- +Cap table and equity administration feed investor reports from a single source of truth
- +Event-based audit trail ties reporting outputs to specific equity changes
- +Supports valuations and corporate actions needed for investor updates
- –Investor reporting setup can require careful configuration of equity data and templates
- –Advanced workflows feel heavier than simple spreadsheet reporting for small teams
Best for: Startups managing equity in Carta and producing investor updates from it
Databook
financial dashboardsGenerates investor and management reporting dashboards from structured company and portfolio data with interactive visuals.
Interactive investor report publishing with governed metrics and scheduled updates
Databook stands out for investor reporting built around interactive analytics and governed storytelling workflows. It connects to data sources to produce board-ready dashboards, updates, and scheduled report outputs.
It supports collaborative publishing so multiple stakeholders can review and share the same reporting assets. It also emphasizes reusable visuals and metrics definitions to keep quarterly reporting consistent across cycles.
- +Interactive dashboards help investors explore KPIs instead of reading static PDFs
- +Workflow publishing supports repeatable quarterly reporting with shared assets
- +Data connections and governed metrics reduce inconsistency across report cycles
- –Setup for reliable metric governance can take time and analytics effort
- –Reporting customization often depends on how the underlying dashboards are modeled
- –Collaboration features can feel limited compared with dedicated IR platforms
Best for: Analytics-driven investor reporting for startups needing consistent, interactive KPI updates
Google Looker
BI and modelingCreates investor-ready dashboards and reports from a governed semantic layer over your financial and investor data.
LookML semantic layer for reusable, governed metrics and dimensions
Google Looker stands out with Looker’s semantic modeling layer that standardizes metrics across dashboards and reports. It supports investor-ready reporting through scheduled reports, interactive dashboards, and drill-down exploration from connected data sources in Google Cloud and beyond.
The platform also integrates workflow controls via role-based access and document sharing so stakeholders view governed datasets. For investor reporting, it emphasizes reusable definitions, traceable query logic, and scalable performance over one-off spreadsheet outputs.
- +Semantic modeling enforces consistent KPIs across investor dashboards
- +Governed data access with role-based permissions and controlled sharing
- +Scheduled deliveries support recurring investor reporting workflows
- +Native integrations with BigQuery and Google Cloud data services
- +Exploration features enable drill-down analysis for investor questions
- –Modeling work and governance setup require specialized expertise
- –Advanced customization often depends on Looker developers
- –Cost can rise with usage and scaling across many datasets
Best for: Teams standardizing investor KPIs using governed dashboards over multiple data sources
Conclusion
After evaluating 8 finance financial services, Airtable stands out as our overall top pick — it scored highest across our combined criteria of features, ease of use, and value, which is why it sits at #1 in the rankings above.
Use the comparison table and detailed reviews above to validate the fit against your own requirements before committing to a tool.
How to Choose the Right Investor Reporting Software
This buyer’s guide helps you pick the right Investor Reporting Software by mapping reporting requirements to concrete capabilities in Airtable, Microsoft Power BI, SS&C Advent, eFront, Trullion, Carta, Databook, and Google Looker. It also explains how specialized equity and alternative-asset reporting platforms like Carta, eFront, and SS&C Advent differ from general reporting and dashboard tools like Airtable and Power BI.
What Is Investor Reporting Software?
Investor Reporting Software builds and publishes investor-ready reporting outputs from underlying portfolio, accounting, or equity data. It reduces manual spreadsheet work by centralizing metrics, enforcing permissions, and automating report generation and distribution. Teams use it to produce recurring investor updates, board-ready dashboards, and audit-friendly statements. Airtable supports investor reporting workflows from relational data and automated report outputs, while Microsoft Power BI adds governed dashboards, paginated statements, and scheduled refresh for investor delivery.
Key Features to Look For
The right feature set depends on whether your investor deliverables need standardized metrics, print-ready layouts, or governed calculations tied to accounting or equity events.
Automated report generation from permissioned, relational data
Airtable automates investor reporting outputs using scripting and Automations over relational, permissioned records. This is a strong fit when you want consistent KPIs across repeated investor decks while limiting manual refresh steps.
Print-ready paginated statements and regulatory-style layouts
Microsoft Power BI includes paginated reports designed for pixel-precise, print-ready investor statements. This matters when your investor pack needs tightly controlled layouts rather than only interactive dashboards.
Row-level security and portfolio segregation
Microsoft Power BI supports row-level security so investor reporting can isolate portfolios, funds, or counterparties by permission. This helps avoid cross-visibility when different investor groups need different views of the same reporting model.
Governed semantic metrics and reusable definitions
Google Looker standardizes metrics through a semantic modeling layer using LookML so teams reuse governed metrics and dimensions across dashboards and reports. This is the right direction when you want investor KPIs to stay consistent even as new dashboards and investor questions appear.
Investor reporting workflow tied to fund and investor accounting calculations
SS&C Advent generates reporting packs using report logic connected to investment operations and accounting workflows. This is a strong fit for governed multi-entity consolidation where investor deliverables must trace back to valuation and accounting inputs.
Versioned, audit-ready outputs from repeatable reporting templates
eFront focuses on investor reporting workflows that connect fund data, performance calculations, and report distribution with versioned outputs. This helps teams deliver consistent statements across multiple funds and reporting periods with auditability through controlled data lineage.
How to Choose the Right Investor Reporting Software
Pick a tool by first matching your data source of truth and governance needs to the platform’s reporting workflow and output types.
Start with your reporting source of truth
If your investors care about equity events and ownership changes, Carta ties investor reporting to equity administration inside the same system using an event-based audit trail. If your investor reporting is driven by portfolio metrics for recurring updates, Trullion assembles standardized quarterly updates from structured portfolio data using reusable templates.
Match output format requirements to the platform
If you need both interactive dashboards and print-style statements, Microsoft Power BI combines interactive visuals with paginated reports for print-ready investor deliverables. If your deliverables are board-ready narratives with interactive exploration, Databook publishes investor reporting as interactive dashboards with governed metrics definitions.
Define the governance model for metrics and permissions
For governed KPI definitions and controlled sharing across many dashboards, Google Looker uses a LookML semantic layer to enforce reusable metrics and dimensions. For operational governance and portfolio segregation inside a dashboard stack, Microsoft Power BI uses row-level security and scheduled dataset refresh.
Assess how deeply the tool connects calculations to reporting
If investor statements must follow accounting-calculation lineage and support multi-entity consolidation, SS&C Advent ties output generation to investor and fund accounting calculations. If you need private markets reporting workflows with automated calculations and versioned, audit-ready outputs, eFront connects fund data, performance calculations, and report delivery into a repeatable template-driven process.
Plan for implementation complexity versus customization depth
Airtable supports fast configuration for recurring KPI reporting from relational records using automations and dashboard views, but advanced financial modeling and highly branded deck layouts often require additional work. Power BI and Looker can deliver strong governance, but DAX complexity in Power BI or LookML semantic modeling in Looker requires specialized setup to maintain consistent metrics.
Who Needs Investor Reporting Software?
Investor Reporting Software benefits teams that must standardize recurring investor deliverables, control access to investor data, and reduce manual spreadsheet reporting.
Investment teams building recurring investor KPI reporting from structured data
Airtable is built for this audience because it turns investor reporting workflows into configurable base views with relational records and automated report outputs. Trullion also fits this segment when you need standardized quarterly investor updates assembled from templated portfolio metrics.
Asset managers that require secure investor dashboards and complex metric modeling
Microsoft Power BI matches this need with row-level security for isolating funds or counterparties and scheduled dataset refresh for keeping investor dashboards current. Power BI’s paginated reports also support print-ready, regulatory-style investor statements for structured disclosures.
Alternative asset managers running governed multi-entity investor statements
SS&C Advent fits organizations that need end-to-end investor and fund reporting tied to accounting workflows with configurable calculations and consolidation. eFront supports private markets teams that want automated performance and valuation workflows with versioned, audit-ready reporting outputs.
Startups and growth teams that want consistent interactive investor KPI updates
Databook is tailored for analytics-driven investor reporting because it publishes interactive dashboards and repeatable quarterly reporting using governed metrics and reusable visuals. Google Looker is a strong fit when teams want governed KPI standardization across multiple data sources using a LookML semantic layer.
Common Mistakes to Avoid
Investor reporting projects fail most often when teams select a tool that cannot match their governance model, output formats, or calculation-to-report lineage needs.
Choosing a dashboard-only tool for print-heavy investor statements
Microsoft Power BI avoids this mistake with paginated reports designed for print-ready, pixel-precise investor statements. Databook and Google Looker focus on interactive exploration, so they need a clear plan for statement layout if your deliverables require strict printed formatting.
Building metric logic in a way that produces inconsistent KPIs across cycles
Google Looker avoids KPI drift by enforcing reusable metrics and dimensions through LookML semantic modeling. Airtable helps when you maintain relational KPI definitions in one reporting database, but heavy financial logic and highly branded layouts often require external tools or careful scripting.
Treating equity event history as a separate dataset that cannot trace to reports
Carta avoids this mistake by powering investor reporting from equity event history with an event-based audit trail tied to ownership changes. Teams that export cap table data into separate pipelines often lose the direct traceability Carta provides for investor updates.
Ignoring governance and calculation lineage for multi-entity investor packs
SS&C Advent provides output generation tied to investor and fund accounting calculations with controlled data lineage for multi-entity statements. eFront also targets audit readiness with managed data lineage and versioned reporting outputs tied to its calculation workflow.
How We Selected and Ranked These Tools
We evaluated each investor reporting product on overall capability for investor-ready reporting workflows, feature depth for automation and output types, ease of use for building repeatable reporting processes, and value for teams that run recurring investor deliveries. We prioritized tools that connect reporting outputs to governed metrics and repeatable workflows rather than relying on one-off spreadsheet generation. Airtable separated itself for structured-data-driven investor KPI reporting because it combines relational data modeling with automations and scripting to generate report outputs from permissioned records. Microsoft Power BI stood out for organizations needing both interactive dashboards and print-style investor statements through paginated reports, while Google Looker emphasized governance through its LookML semantic layer.
Frequently Asked Questions About Investor Reporting Software
Which investor reporting tool is best for structured, relational reporting workflows that keep numbers consistent across teams?
How do Power BI and Looker differ for standardizing investor KPIs across multiple dashboards and reports?
Which solution fits investor reporting when you need print-ready statements with regulatory-style layouts?
When should a team choose SS&C Advent over tools that focus more on dashboarding or document assembly?
Which platform is most suitable for private markets teams that need repeatable investor statements across funds and reporting periods?
Which tool works best for automating standardized quarterly updates for VC and PE portfolio companies?
How does Carta support investor reporting that depends on equity events and ownership changes?
Which tool is best for analytics-driven investor reporting that emphasizes governed storytelling and collaborative review?
What is a common integration and workflow approach across these tools for pulling data from SQL, cloud systems, and spreadsheets?
What technical capability should you check first if investor reporting must be auditable down to the calculation inputs?
Tools reviewed
Primary sources checked during evaluation.
Referenced in the comparison table and product reviews above.
Keep exploring
Comparing two specific tools?
Software Alternatives
See head-to-head software comparisons with feature breakdowns, pricing, and our recommendation for each use case.
Explore software alternatives→In this category
Finance Financial Services alternatives
See side-by-side comparisons of finance financial services tools and pick the right one for your stack.
Compare finance financial services tools→FOR SOFTWARE VENDORS
Not on this list? Let’s fix that.
Our best-of pages are how many teams discover and compare tools in this space. If you think your product belongs in this lineup, we’d like to hear from you—we’ll walk you through fit and what an editorial entry looks like.
Apply for a ListingWHAT THIS INCLUDES
Where buyers compare
Readers come to these pages to shortlist software—your product shows up in that moment, not in a random sidebar.
Editorial write-up
We describe your product in our own words and check the facts before anything goes live.
On-page brand presence
You appear in the roundup the same way as other tools we cover: name, positioning, and a clear next step for readers who want to learn more.
Kept up to date
We refresh lists on a regular rhythm so the category page stays useful as products and pricing change.