GITNUXSOFTWARE ADVICE
Marketing AdvertisingTop 8 Best Heatmap Software of 2026
Explore top 10 heatmap tools for user behavior analysis. Learn features, pricing, and find the best fit.

How we ranked these tools
Core product claims cross-referenced against official documentation, changelogs, and independent technical reviews.
Analyzed video reviews and hundreds of written evaluations to capture real-world user experiences with each tool.
AI persona simulations modeled how different user types would experience each tool across common use cases and workflows.
Final rankings reviewed and approved by our editorial team with authority to override AI-generated scores based on domain expertise.
Score: Features 40% · Ease 30% · Value 30%
Gitnux may earn a commission through links on this page — this does not influence rankings. Editorial policy
Editor picks
Three quick recommendations before you dive into the full comparison below — each one leads on a different dimension.
Hotjar
Heatmaps with element-level click and scroll visualization tied to session recordings
Built for product and growth teams visualizing UX friction and conversion leaks without engineering.
Mouseflow
Runner UpSession replays synchronized with heatmap hotspots via event and interaction context
Built for product and UX teams analyzing usability bottlenecks using heatmaps and replays.
Lucky Orange
Also GreatSession replay with event tagging to trace heatmap hotspots to individual user journeys
Built for teams seeking heatmaps plus session replay and feedback loops without engineering.
Related reading
Comparison Table
This comparison table reviews popular heatmap and session recording tools, including Hotjar, Mouseflow, Lucky Orange, Crazy Egg, and Inspectlet, alongside similar alternatives. It highlights how each platform captures user behavior, such as click and scroll heatmaps and replay timelines, then summarizes differences in targeting, analytics depth, and implementation requirements so readers can shortlist the best fit.
Hotjar
behavior analyticsCreates website heatmaps plus session recordings and surveys to diagnose visitor behavior across marketing pages.
Heatmaps with element-level click and scroll visualization tied to session recordings
Hotjar stands out for combining behavioral heatmaps with session recordings and conversion-focused surveys in one workflow. The tool generates click, scroll, and move maps to visualize engagement and friction on specific pages. It also supports funnels, form analysis, and goal tracking so teams can connect observed behavior to measurable outcomes.
- +Click and scroll heatmaps make high-friction pages immediately visible
- +Session recordings provide context for heatmap patterns and misclicks
- +Form analytics pinpoints field-level drop-off and input friction
- +Conversion funnels connect observed behavior to defined goals
- +Segmentation lets teams compare behavior by source and device
- –Dense pages can produce cluttered heatmaps that require careful filtering
- –Advanced analysis depends on multiple tools and configuration steps
- –Recorded sessions can miss critical context when event instrumentation is incomplete
Best for: Product and growth teams visualizing UX friction and conversion leaks without engineering
More related reading
Mouseflow
session analyticsDelivers website and app heatmaps with session recordings to analyze how users interact with landing pages.
Session replays synchronized with heatmap hotspots via event and interaction context
Mouseflow stands out for combining session replay with heatmaps that show where visitors click, scroll, and hesitate. It supports event tagging so teams can track specific interactions and funnel steps, then correlate heatmap patterns with full replays.
The platform also provides conversion-focused overlays that connect user behavior on key pages to form and checkout usability issues. Overall, it is built for behavioral analysis across web pages where teams need both aggregated views and exact session context.
- +Heatmaps show click, scroll, and attention patterns with clear visual density
- +Session replay ties aggregate heatmap hotspots to exact user journeys
- +Event tracking enables targeted behavioral analysis beyond default page metrics
- –Setup for advanced event tagging takes time to design correctly
- –Replay review can become noisy on high-traffic sites without strong filters
- –Heatmap customization options feel limited for very complex interaction layouts
Best for: Product and UX teams analyzing usability bottlenecks using heatmaps and replays
Lucky Orange
conversion analyticsProvides click, move, and scroll heatmaps with visitor recordings and form analytics for marketing optimization.
Session replay with event tagging to trace heatmap hotspots to individual user journeys
Lucky Orange stands out for combining session replay with heatmaps and conversion-focused feedback in one workflow. Heatmaps cover mouse clicks, taps, movement, and scrolling across tracked pages to reveal where users hesitate.
Session replay replays user journeys and supports tagging so teams can correlate friction with specific journeys. Built-in surveys and chat widgets help connect observed behavior with direct user context.
- +Heatmaps include clicks, moves, and scroll depth on the same pages
- +Session replay plus tagging speeds root-cause analysis for UX issues
- +On-site surveys and chat add qualitative context to behavioral data
- –Segmentation depth and query flexibility can feel limited for complex analytics
- –Replay review becomes slower with heavy traffic and many sessions
- –Setup requires careful tracking and event configuration to avoid noise
Best for: Teams seeking heatmaps plus session replay and feedback loops without engineering
Crazy Egg
A/B heatmapsShows click and scroll heatmaps with A/B testing tools to improve conversion-focused landing pages.
Click and scroll heatmaps overlaid on page screenshots
Crazy Egg stands out with its visual UX suite that pairs heatmaps with recordings and scroll analysis in one place. Heatmaps show click, scroll, and attention patterns directly on page screenshots, and session recordings make it easier to confirm what users actually did. The tool also supports A B testing workflows to compare changes against observed engagement.
- +Click and scroll heatmaps map engagement directly onto page visuals
- +Session recordings clarify heatmap spikes with real user behavior context
- +A B testing tools help validate changes against measured engagement
- +Scroll depth insights reveal where users lose attention across long pages
- +Dashboard filters support faster review of traffic sources and device types
- –Heatmaps rely on capturing meaningful events which can miss edge-case interactions
- –Complex funnels often require extra setup compared with funnel-first analytics tools
- –Granular reporting across very large pages can feel slower to navigate
Best for: Teams improving landing pages using heatmaps, recordings, and A B tests
Inspectlet
visual session replayGenerates click and scroll heatmaps with session replays to visualize friction on high-traffic pages.
Visual session replay tied to click and scroll heatmaps
Inspectlet stands out with session replay plus heatmaps delivered in one workflow, letting teams connect mouse behavior to user paths. The platform captures clicks, scroll depth, and on-page engagement with heatmap overlays that highlight where users interact.
Session replays add context for each segment of heatmap activity, including behavior filters that narrow analysis to specific audiences. It also supports funnels and form analytics so visual feedback ties back to conversion points.
- +Heatmaps and session replay share consistent selectors and context
- +Scroll depth and click heatmaps reveal both engagement and intent
- +Session filters help isolate behavior for specific cohorts
- +Form analytics highlights friction areas tied to user sessions
- –Heatmap interpretation requires manual triangulation with replay sessions
- –Advanced analysis workflows can feel heavy for non-technical teams
- –Segmentation granularity depends on tracking setup quality
- –Large traffic volumes can make investigation slower
Best for: Product teams using session replay with heatmaps to debug conversion issues
Contentsquare
enterprise experienceUses AI-driven digital experience analytics to deliver heatmaps and journey insights for marketing and UX teams.
AI-powered Impact and Opportunity scoring that prioritizes experience fixes
Contentsquare stands out with AI-powered experience analytics that connect heatmaps and session behavior to conversion and revenue impact. It provides click, scroll, and attention heatmaps plus journey and funnel analysis to diagnose where users stall or drop off.
Strong segmentation supports comparing behavior across devices, geographies, and user attributes, which helps prioritize fixes. Deployments often focus on product, marketing, and UX teams that need actionable insights across complex journeys.
- +AI-driven insights link on-page behavior to business outcomes
- +Click and scroll heatmaps reveal engagement and friction patterns quickly
- +Segmentation and funnels support targeted troubleshooting across journeys
- +Session replay context helps validate what users actually did
- –Setup and ongoing instrumentation for reliable tracking can be time intensive
- –Interpretation requires analytics discipline beyond basic heatmap viewing
- –UI complexity can slow down teams that want simple visual answers
Best for: Product and UX teams diagnosing conversion friction with advanced analytics
Smartlook
product analyticsProvides web and product heatmaps alongside session recordings and funnels for behavioral analytics.
Event segmentation for heatmaps combined with session replay correlation
Smartlook combines session replay with heatmaps to show where users click, scroll, and spend time. Its analytics workflow includes event tracking so teams can segment heatmaps by user actions.
The platform also supports funnel-style investigation by correlating visual behavior with recorded journeys. Smartlook’s strength is turning passive browsing into debuggable interaction patterns across key pages.
- +Click and scroll heatmaps help pinpoint interaction friction quickly
- +Session replay ties heatmap hotspots to exact user journeys
- +Event-based targeting enables behavior-focused heatmap segmentation
- +Recording filters reduce noise when investigating specific flows
- –Setup and event configuration can feel heavier than simpler heatmap tools
- –Heatmap insights require careful interpretation alongside replays
- –Advanced analysis workflows can take time to master
Best for: Product teams debugging UX behavior using heatmaps plus session replay
Yandex Metrica
analytics heatmapsTracks marketing site behavior with heatmaps and session replays to optimize pages for conversions.
Click Heatmap that aggregates engagement across campaigns and landing pages
Yandex Metrica stands out for combining session analytics with visual heatmaps inside one measurement workflow. Heatmaps cover clicks, scroll depth, and user behavior patterns so teams can spot friction and dead ends on key pages. Built-in session replay and funnels help connect visual findings to user journeys across traffic sources.
- +Click and scroll heatmaps reveal interaction hotspots without manual tagging
- +Session replay links heatmap anomalies to exact user journeys
- +Funnel and cohort style analysis supports root-cause checks beyond visuals
- +Works well for teams tracking Russian-language audiences and local traffic patterns
- –Advanced segmentation for heatmaps can feel limiting versus top-tier competitors
- –UI density makes it harder to find the right heatmap view quickly
- –Export and sharing workflows are weaker for large multi-team organizations
Best for: Marketing teams needing click and scroll heatmaps plus session replay
Conclusion
After evaluating 8 marketing advertising, Hotjar stands out as our overall top pick — it scored highest across our combined criteria of features, ease of use, and value, which is why it sits at #1 in the rankings above.
Use the comparison table and detailed reviews above to validate the fit against your own requirements before committing to a tool.
How to Choose the Right Heatmap Software
This buyer’s guide explains how to select Heatmap Software that matches the behavior analysis workflow needed for web and product UX. It covers Hotjar, Mouseflow, Lucky Orange, Crazy Egg, Inspectlet, Contentsquare, Smartlook, and Yandex Metrica using concrete feature needs drawn from how these tools operate. The guide also highlights common buying mistakes such as under-scoped event tracking and misread heatmaps without replay context.
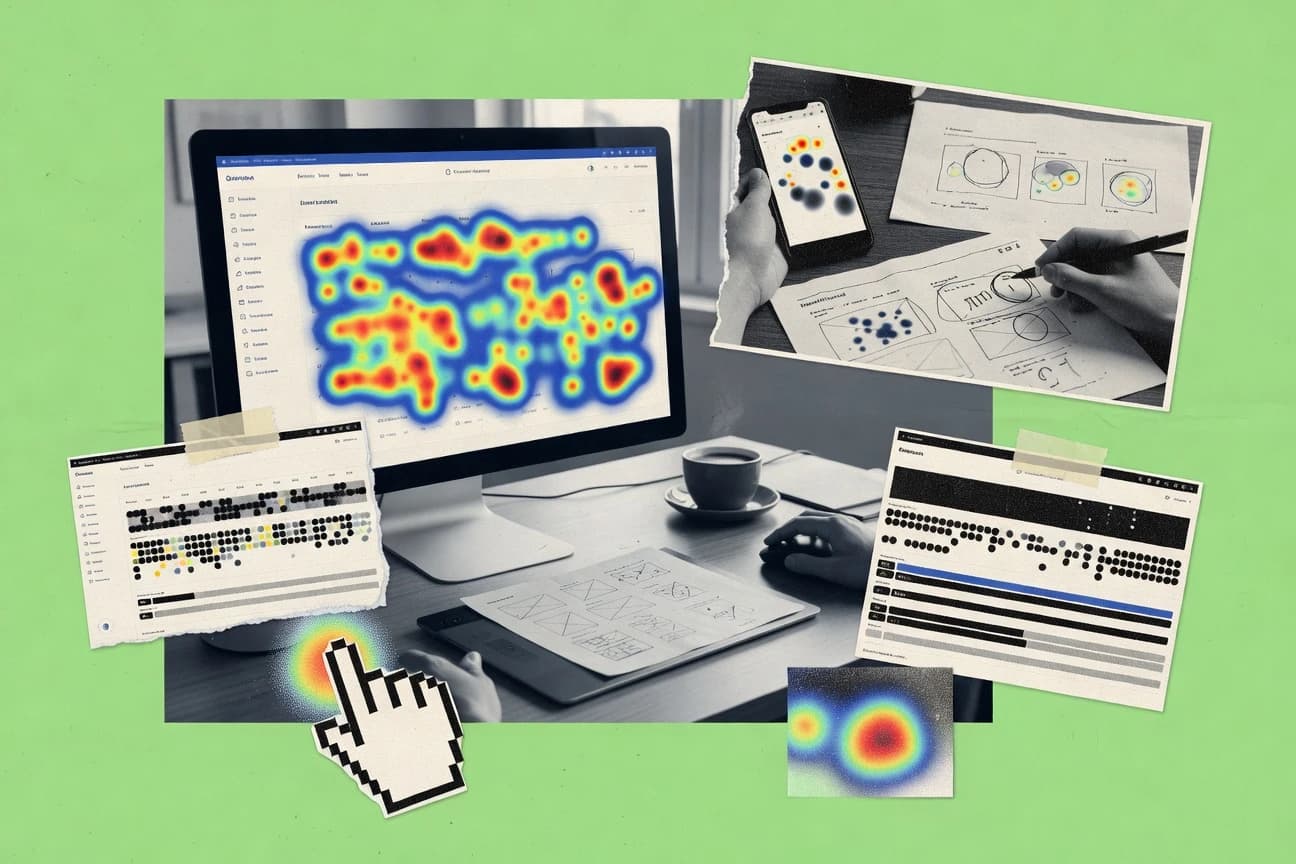
What Is Heatmap Software?
Heatmap Software overlays engagement signals like clicks and scroll on top of website pages or app screens so teams can see where users focus and where friction forms. Most solutions also add session recordings so teams can watch real user journeys that correspond to heatmap hotspots. Heatmap Software solves problems in landing page optimization, UX debugging, and conversion troubleshooting where aggregated metrics alone do not reveal interaction-level causes. Tools like Hotjar and Crazy Egg show what this category looks like in practice by combining click and scroll heatmaps with recordings and workflows aimed at improving conversion outcomes.
Key Features to Look For
Heatmap selection should map directly to how teams will investigate friction and connect visual behavior to measurable outcomes.
Element-level click, scroll, and attention heatmaps tied to interaction context
Look for heatmaps that visualize clicks and scrolling at the element level so teams can pinpoint high-friction areas on real page layouts. Hotjar delivers element-level click and scroll visualization tied to session recordings, and Crazy Egg overlays click and scroll heatmaps on page screenshots for immediate visual grounding.
Session recordings synchronized to heatmap hotspots
Heatmaps become actionable when recordings line up with the same interaction hotspots teams see in aggregated views. Mouseflow synchronizes session replays with heatmap hotspots using event and interaction context, and Inspectlet provides visual session replay tied to click and scroll heatmaps.
Event tagging and event-based heatmap segmentation
Event tagging enables heatmaps to answer questions about specific interactions like button clicks, form submits, or funnel step behavior rather than only default page-level activity. Lucky Orange uses tagging to trace friction to specific journeys, and Smartlook uses event-based targeting to segment heatmaps by user actions.
Funnels and goal tracking that connect behavior to conversion outcomes
Funnel views help teams translate where users struggle into where they drop off across steps in a conversion path. Hotjar includes conversion funnels and goal tracking, and Inspectlet supports funnels and form analytics that tie visual findings back to conversion points.
Form analytics and input friction detection
Form analytics reduces guesswork by identifying field-level drop-off and input friction instead of only showing that users clicked away. Hotjar provides form analytics that pinpoints field-level drop-off, and Inspectlet pairs heatmap overlays with form analytics tied to sessions.
Prioritization and scoring for experience fixes using AI
Advanced teams benefit when the tool not only shows where users stall but also helps prioritize fixes. Contentsquare provides AI-powered Impact and Opportunity scoring that prioritizes experience fixes, while still using click and scroll and session replay context to validate actual behavior.
How to Choose the Right Heatmap Software
A practical selection process starts by matching heatmap and replay capabilities to the investigation type teams need, then validating segmentation depth and workflow fit.
Pick the heatmap view that matches the work item
Choose click and scroll heatmaps for landing pages and UX screens where friction often appears as misclicks or lost attention. Crazy Egg emphasizes click and scroll heatmaps overlaid on page screenshots to support rapid landing page iteration, while Hotjar adds element-level click and scroll visualization tied to recordings for teams that need exact interaction-level evidence.
Ensure recordings connect to the exact hotspots being investigated
Require synchronized session replay so teams can verify why a hotspot appears rather than only guessing from aggregate density. Mouseflow aligns session replays with heatmap hotspots via event and interaction context, and Inspectlet keeps heatmap activity tied to visual replay so investigation stays in one workflow.
Decide how teams will segment and tag users
Select tools that support event tagging and action-based segmentation when the questions are about specific behaviors like checkout steps or interaction patterns. Smartlook uses event-based targeting to segment heatmaps by user actions, and Lucky Orange uses tagging to connect friction to specific journeys for faster root-cause analysis.
Match the conversion workflow depth to the team’s measurement goals
If conversion diagnosis matters, prioritize funnels and goal tracking that tie behavior to outcomes. Hotjar includes conversion funnels and goal tracking, while Yandex Metrica pairs funnels and session replay with click and scroll heatmaps across traffic sources for marketing-focused root-cause checks.
Choose AI prioritization when teams need faster fix decisions
If multiple experience issues compete for attention, prioritize tools that provide automated impact scoring and prioritized recommendations. Contentsquare uses AI-powered Impact and Opportunity scoring to prioritize experience fixes, while still presenting click and scroll plus journey and funnel analysis to support disciplined troubleshooting.
Who Needs Heatmap Software?
Heatmap Software benefits teams that must understand interaction-level friction and connect it to conversion behavior or user journey outcomes.
Product and growth teams diagnosing UX friction and conversion leaks without building complex analytics
Hotjar is built for product and growth teams visualizing UX friction and conversion leaks without engineering because it combines click and scroll heatmaps with session recordings, surveys, funnels, and form analytics. Inspectlet also suits product teams using session replay plus heatmaps to debug conversion issues with filters and form analytics tied to sessions.
Product and UX teams analyzing usability bottlenecks using aggregated hotspots plus exact user journeys
Mouseflow fits product and UX teams analyzing usability bottlenecks because it delivers heatmaps with session replay synchronized to event and interaction context. Smartlook also targets product teams debugging UX behavior by combining click and scroll heatmaps with session replay and event-based segmentation.
Teams improving landing pages and validating changes with A/B testing workflows
Crazy Egg suits teams improving landing pages using heatmaps and session recordings with A/B testing tools. Hotjar can also support this style of work by tying heatmaps to conversion funnels and goal tracking when page changes aim to improve measurable outcomes.
Marketing teams optimizing pages for conversions across campaigns and traffic sources
Yandex Metrica matches marketing teams needing click and scroll heatmaps plus session replay because it includes funnels and cohort-style analysis across traffic sources. Crazy Egg also supports marketing-style landing page optimization by mapping engagement directly onto page visuals with click and scroll heatmaps.
Common Mistakes to Avoid
Common failure patterns across heatmap tools come from weak instrumentation, unclear investigation workflows, or expecting heatmaps alone to prove root cause.
Under-instrumenting events so heatmaps miss the interactions that matter
Hotjar and Mouseflow both depend on capturing meaningful interaction context, and missing instrumentation can cause recorded sessions to miss critical context for observed patterns. Lucky Orange and Crazy Egg also rely on careful tracking and event configuration so edge-case interactions do not disappear from the heatmap view.
Reading heatmap hotspots without validating with session recordings
Inspectlet and Mouseflow both exist to connect replay context to heatmap activity, because heatmap interpretation alone requires manual triangulation with replay sessions. Contentsquare adds AI prioritization, but teams still need replay validation and disciplined interpretation to connect observed friction to real experience impact.
Choosing a segmentation workflow that does not match the questions teams ask
Mouseflow event tagging takes time to design correctly, and weak tagging leads to noisy or less targeted analysis. Smartlook and Hotjar both support segmentation, but teams with complex analytics needs can run into setup and configuration effort when segmentation depth must be broad and highly specific.
Using heatmaps on dense or complex pages without filtering discipline
Hotjar can produce cluttered heatmaps on dense pages, and filtering is required to keep click and scroll signals readable. Crazy Egg and Inspectlet also require thoughtful navigation of report filters when large pages produce many interactions and dense heatmap patterns.
How We Selected and Ranked These Tools
we evaluated every tool on three sub-dimensions. Features carried a weight of 0.4. Ease of use carried a weight of 0.3. Value carried a weight of 0.3, and the overall rating used the weighted average overall = 0.40 × features + 0.30 × ease of use + 0.30 × value. Hotjar separated itself from lower-ranked tools with a concrete example on the features dimension by combining element-level click and scroll heatmaps tied to session recordings with conversion funnels and form analytics in one workflow.
Frequently Asked Questions About Heatmap Software
How do Hotjar and Mouseflow differ for teams that need both heatmaps and session replay?
Which tools are strongest for debugging form and checkout friction using heatmaps?
What’s the best fit for landing-page optimization that needs heatmaps over screenshots and comparison tests?
How do Contentsquare and other tools prioritize which UX fixes matter most?
Which platform best supports funnel analysis across journeys using heatmaps?
Which heatmap products help teams narrow analysis to specific audiences or segments?
What’s the difference between scroll and attention heatmaps across Contentsquare and Crazy Egg?
Which tools include user feedback mechanisms tied to the behavior shown in heatmaps?
What common setup steps do teams usually handle differently when deploying heatmaps and session replay?
Tools reviewed
Primary sources checked during evaluation.
Referenced in the comparison table and product reviews above.
Keep exploring
Comparing two specific tools?
Software Alternatives
See head-to-head software comparisons with feature breakdowns, pricing, and our recommendation for each use case.
Explore software alternatives→In this category
Marketing Advertising alternatives
See side-by-side comparisons of marketing advertising tools and pick the right one for your stack.
Compare marketing advertising tools→FOR SOFTWARE VENDORS
Not on this list? Let’s fix that.
Our best-of pages are how many teams discover and compare tools in this space. If you think your product belongs in this lineup, we’d like to hear from you—we’ll walk you through fit and what an editorial entry looks like.
Apply for a ListingWHAT THIS INCLUDES
Where buyers compare
Readers come to these pages to shortlist software—your product shows up in that moment, not in a random sidebar.
Editorial write-up
We describe your product in our own words and check the facts before anything goes live.
On-page brand presence
You appear in the roundup the same way as other tools we cover: name, positioning, and a clear next step for readers who want to learn more.
Kept up to date
We refresh lists on a regular rhythm so the category page stays useful as products and pricing change.