GITNUXSOFTWARE ADVICE
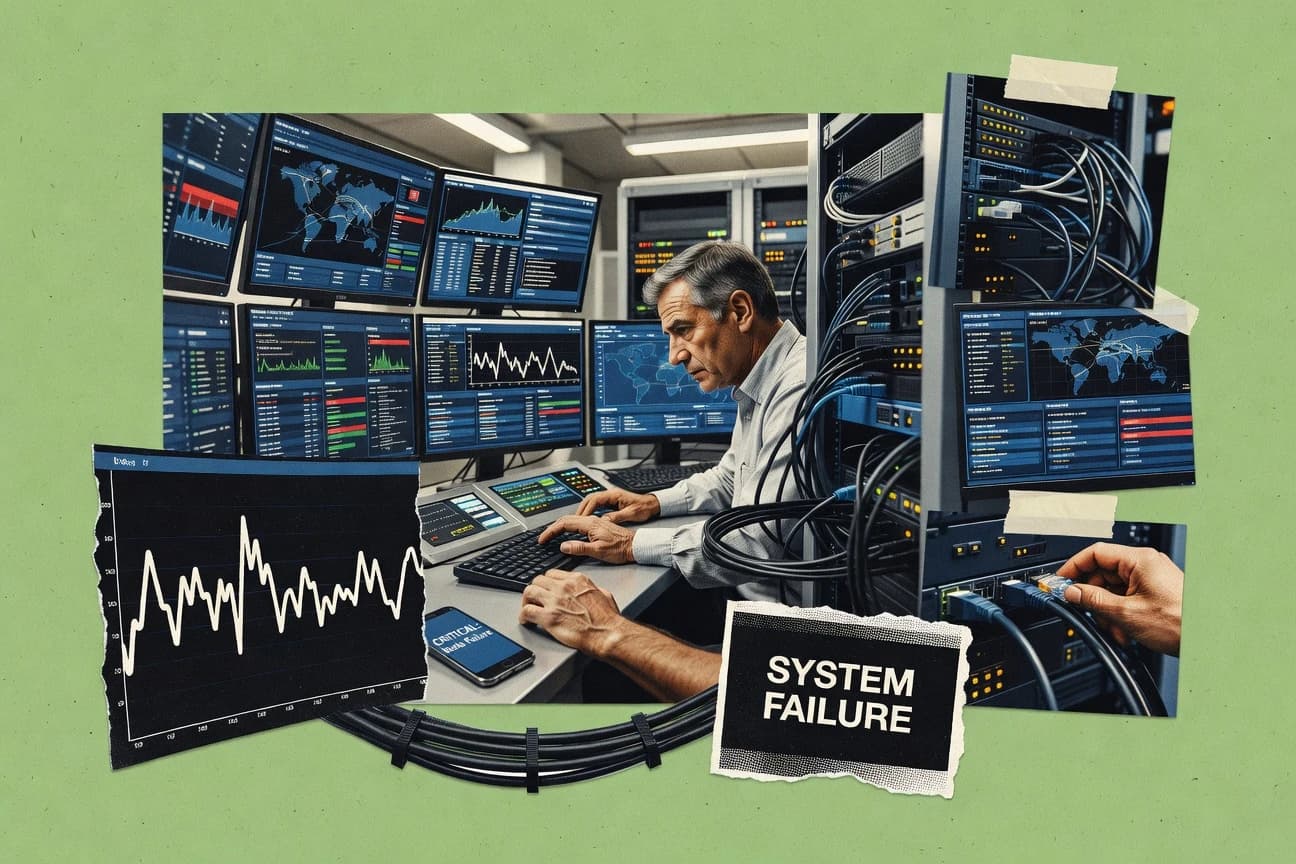
Technology Digital MediaTop 10 Best Enterprise Monitoring Software of 2026
Explore the top 10 enterprise monitoring software solutions. Compare features and find the best fit today.

How we ranked these tools
Core product claims cross-referenced against official documentation, changelogs, and independent technical reviews.
Analyzed video reviews and hundreds of written evaluations to capture real-world user experiences with each tool.
AI persona simulations modeled how different user types would experience each tool across common use cases and workflows.
Final rankings reviewed and approved by our editorial team with authority to override AI-generated scores based on domain expertise.
Score: Features 40% · Ease 30% · Value 30%
Gitnux may earn a commission through links on this page — this does not influence rankings. Editorial policy
Editor picks
Three quick recommendations before you dive into the full comparison below — each one leads on a different dimension.
Dynatrace
Davis AI for automated problem detection and root-cause analysis
Built for enterprises needing AI root-cause observability across hybrid apps and infrastructure.
Datadog
Runner UpLive Tail streaming for interactive log and trace investigation during incidents.
Built for large enterprises needing unified observability and actionable alerting.
New Relic
Also GreatDistributed tracing with service maps that links transactions to underlying dependencies
Built for enterprises needing full-stack observability, tracing, and anomaly-driven alerting at scale.
Related reading
- Technology Digital MediaTop 10 Best Enterprise It Management Software of 2026
- Technology Digital MediaTop 10 Best Data Center Monitoring Software of 2026
- Technology Digital MediaTop 10 Best Event Log Monitoring Software of 2026
- Technology Digital MediaTop 10 Best Enterprise File Transfer Software of 2026
Comparison Table
This comparison table benchmarks enterprise monitoring platforms such as Dynatrace, Datadog, New Relic, Splunk Observability Cloud, and Prometheus side by side. You’ll see how each option supports key capabilities like metrics and logs, distributed tracing, alerting, dashboards, deployment models, and integration coverage so you can map tool features to your observability requirements.
Dynatrace
AI observabilityProvides AI-driven full-stack observability with distributed tracing, infrastructure monitoring, and real-time anomaly detection for enterprise applications.
Davis AI for automated problem detection and root-cause analysis
Dynatrace stands out for AI-driven observability that pinpoints root causes across applications, infrastructure, and cloud services. It provides unified end-to-end monitoring with distributed tracing, real user monitoring, and infrastructure metrics in a single workflow. The platform automatically detects issues, correlates signals, and supports automated remediation via integrations and alerting rules.
- +AI cause analysis correlates traces, logs, and infrastructure metrics
- +Full-stack monitoring covers apps, containers, and cloud services
- +Real user monitoring shows end-user impact with session insights
- +Automated anomaly detection reduces manual triage workload
- +Broad integrations for ticketing, alert routing, and incident workflows
- –Advanced setup and tuning take time for large enterprise estates
- –Deep functionality requires governance to avoid signal sprawl
- –Pricing can be expensive for organizations with heavy telemetry volumes
Best for: Enterprises needing AI root-cause observability across hybrid apps and infrastructure
More related reading
Datadog
unified monitoringDelivers unified application, infrastructure, logs, and network monitoring with dashboards, alerting, and scalable agent-based collection.
Live Tail streaming for interactive log and trace investigation during incidents.
Datadog stands out for unifying metrics, logs, traces, and synthetic tests in one operational view across hybrid cloud and SaaS. Its real-time alerting ties signals to dashboards and automated incident workflows using rule-based monitors and status pages.
Enterprise monitoring teams also benefit from infrastructure visibility via host and container telemetry, plus APM for request-level performance and distributed tracing. Datadog’s governance features help large organizations manage access, data retention, and deployment via integrations and APIs.
- +Strong unified observability across metrics, logs, and distributed tracing
- +High-fidelity infrastructure and container telemetry with fast real-time dashboards
- +Flexible alerting with monitor templates and automated routing
- +Broad integrations for cloud services, databases, and common application stacks
- +Accurate APM with traces that connect to logs and infrastructure signals
- –Cost grows quickly with high ingest volumes and extensive trace sampling
- –Advanced setups require careful tuning to avoid noisy or overlapping alerts
- –Enterprise configuration and governance settings can be complex to manage
Best for: Large enterprises needing unified observability and actionable alerting
New Relic
APM platformOffers application performance monitoring, distributed tracing, infrastructure monitoring, and workflow analytics to detect and diagnose production issues.
Distributed tracing with service maps that links transactions to underlying dependencies
New Relic stands out with a unified observability approach that connects application performance, infrastructure telemetry, and logs in one workflow. It provides distributed tracing, end-to-end service maps, and rich APM analytics for pinpointing latency and error sources.
Enterprise monitoring is strengthened by alerting with anomaly detection and dashboards built from cross-product signals. Deep integrations support custom instrumentation and data enrichment across cloud platforms and container environments.
- +Strong distributed tracing and service dependency mapping across microservices
- +Anomaly detection and actionable alerting reduce noisy incident triage
- +Flexible integrations for APM, infrastructure, and logs in one workflow
- –High telemetry volume can drive steep enterprise costs
- –Setup and tuning across multiple data sources takes specialist effort
- –Deep dashboards require time to design effective executive views
Best for: Enterprises needing full-stack observability, tracing, and anomaly-driven alerting at scale
Splunk Observability Cloud
observability cloudProvides enterprise observability for metrics, traces, and logs with anomaly detection and operational analytics for cloud and hybrid systems.
Service maps with impact analysis across dependencies to pinpoint affected users and components
Splunk Observability Cloud stands out with end-to-end visibility across metrics, logs, traces, and service maps built for distributed systems. It provides SLO management, anomaly detection, and incident-focused alerting tied to service dependencies. The platform supports automatic instrumentation and deep troubleshooting workflows using correlation across telemetry types.
- +Strong correlation across metrics, logs, and traces for faster root cause analysis
- +Service maps and dependency views clarify impact paths across microservices
- +SLO and alerting workflows support reliability management tied to real services
- +Advanced anomaly detection reduces manual tuning for baseline drift
- –Setup and data modeling can be complex for large telemetry volumes
- –Dashboards and workflows may require Splunk experience to optimize effectively
- –Costs can rise quickly as high-cardinality telemetry increases
Best for: Enterprises standardizing full-stack observability with SLOs and service dependency analysis
Prometheus
metrics open-sourceCollects time-series metrics with PromQL for alerting and long-term monitoring of services at scale in enterprise environments.
PromQL plus recording rules for durable, reusable time-series computations
Prometheus stands out for its pull-based metrics collection model and plain-text PromQL query language. It excels at recording time-series metrics from Kubernetes, VMs, and services using exporters and service discovery. It also pairs well with Alertmanager for alert routing and with Grafana for enterprise dashboards and drilldowns.
- +PromQL enables powerful time-series queries with recording rules and alert expressions
- +Native Kubernetes service discovery reduces manual target configuration
- +Alertmanager supports flexible notification routing and grouping
- +Large ecosystem of exporters covers infrastructure and common services
- +Time-series storage and downsampling support long retention strategies
- –Self-managed operations require careful capacity planning and retention tuning
- –High-cardinality metrics can quickly increase storage and query costs
- –Distributed setups add complexity for federation, sharding, and upgrades
- –Logs and traces are not native, requiring external systems for observability coverage
Best for: Enterprises running Kubernetes or microservices needing metrics-first monitoring at scale
Grafana
dashboard and alertsTurns telemetry into enterprise dashboards and alerts and integrates with common metrics, logs, and tracing backends.
Grafana alerting and notification routing driven directly from dashboard queries
Grafana stands out with its open, plugin-driven dashboards that turn metrics, logs, and traces into one shareable observability view. It supports alerting, data source integrations, and enterprise governance features that fit large deployments with role-based access and audit-friendly controls.
Grafana also scales visualization workloads through built-in caching, query options, and a mature data source ecosystem. It is strongest when paired with a metrics backend and standardized dashboards across teams.
- +Unified dashboards for metrics, logs, and traces in one UI
- +Extensive plugin and data source ecosystem for fast integration
- +RBAC and enterprise controls support multi-team governance
- +Flexible alerting tied to queries with notification routing
- –Visual customization can require dashboard and query expertise
- –Alert correctness depends on upstream data quality and query design
- –Complex setups can be operationally heavy without clear standards
Best for: Enterprises standardizing observability dashboards across many teams and data sources
Zabbix
enterprise monitoringDelivers agent and agentless monitoring with real-time metrics, alerting, discovery, and extensive integrations for infrastructure.
Proxy-based distributed polling with trigger-based event correlation
Zabbix stands out for deep on-prem monitoring with a single server coordinating agents, SNMP devices, and cloud service checks. It provides metric collection, alerting, and long-term reporting for infrastructure, applications, and network services with flexible event correlation.
Enterprises can scale monitoring using distributed components like proxy servers and tuned data retention. Zabbix also includes automation hooks through scripts and webhooks, and it supports role-based access for multi-team operations.
- +Strong distributed architecture using Zabbix proxies to scale data collection
- +Advanced alerting with event correlation and trigger dependencies
- +Flexible dashboards and reporting for infrastructure and service views
- +Extensible monitoring with custom scripts and programmable actions
- +Great coverage across agents, SNMP, and network/service checks
- –Complex configuration and tuning for large environments
- –UI can feel dense when managing triggers, items, and discovery rules
- –Upgrades and customizations can require careful change management
- –Advanced analytics often require more build-out than turnkey tools
- –High-volume monitoring needs disciplined thresholds and retention planning
Best for: Large enterprises needing scalable on-prem monitoring with flexible alert logic
IBM Instana
auto-discovery observabilityProvides AI-based application and infrastructure monitoring with automatic service discovery and distributed tracing.
Automated dependency mapping with real-time service context and root-cause guidance
IBM Instana stands out with automated service discovery and dependency mapping that links application performance to underlying infrastructure. It combines real-time APM, infrastructure monitoring, and distributed tracing so you can trace requests across services and correlate them with host and network behavior.
Instana also supports anomaly detection and root cause insights for microservices and cloud-native workloads across on-prem and major public clouds. Its strength is fast contextual triage rather than only customizable dashboards.
- +Auto service discovery builds dependency maps without manual instrumentation
- +Real-time distributed tracing links slow requests to specific downstream services
- +Anomaly detection highlights unusual behavior and speeds incident triage
- +Unified views connect application metrics with host, container, and network signals
- –Deep configuration and agent rollout take significant planning at scale
- –Advanced workflows can feel less flexible than DIY observability stacks
- –Alert tuning requires iterative work to reduce noise in complex environments
Best for: Enterprises needing automated APM and dependency mapping for microservices
CA Technologies (Broadcom) App Synthetic Monitoring
synthetic monitoringRuns synthetic checks to validate end-user experiences and application availability across enterprise websites and services.
Scripted synthetic transaction monitoring with step-level performance and availability measurement
CA Technologies App Synthetic Monitoring distinguishes itself by combining scripted synthetic transaction testing with enterprise-grade monitoring workflows under the broader CA suite. It runs repeatable checks from configured locations, tracks end-to-end user journeys, and measures availability and performance using real browser or protocol-based steps.
It supports alerting and reporting tied to application events, which helps correlate synthetic failures with broader infrastructure signals. The experience targets organizations that want centralized governance and integration inside an enterprise monitoring ecosystem rather than a standalone lightweight synthetic tool.
- +Scripted synthetic transactions for realistic user journey coverage
- +Integration into the broader CA enterprise monitoring workflow
- +Multiple probe locations for better regional detection accuracy
- +Performance metrics captured across each synthetic step
- –Setup and scripting can be heavy for teams without monitoring experience
- –UI navigation feels complex compared with modern synthetic-first tools
- –Licensing and deployment complexity often limit small-budget rollouts
- –Less streamlined compared with purpose-built synthetic SaaS experiences
Best for: Large enterprises integrating synthetic checks into CA monitoring governance
Nagios XI
network monitoringProvides enterprise network and server monitoring with alerting, reporting, and a plugin-based architecture.
Web-based administration for alerts, escalations, and monitoring configuration.
Nagios XI stands out for bundling Nagios Core-style monitoring with a web UI and enterprise-oriented management features. It provides host, service, and network checks with alerting, escalation, and configurable notification paths.
The platform supports custom checks, plugins, and recurring monitoring schedules, which makes it flexible for heterogeneous infrastructure. Nagios XI also includes reporting and role-based access features that support shared operations workflows across teams.
- +Enterprise web interface for Nagios-style checks and alert workflows
- +Strong plugin and custom check support for diverse infrastructure
- +Configurable notifications with escalation rules for critical events
- +Built-in reporting to track uptime, trends, and alert history
- –Setup and tuning can be complex for large, fast-changing environments
- –Graphing and dashboards are functional but not as polished as newer tools
- –Operational overhead increases when managing many custom checks
Best for: Enterprises standardizing on Nagios-style monitoring for custom, plugin-driven checks
Conclusion
After evaluating 10 technology digital media, Dynatrace stands out as our overall top pick — it scored highest across our combined criteria of features, ease of use, and value, which is why it sits at #1 in the rankings above.
Use the comparison table and detailed reviews above to validate the fit against your own requirements before committing to a tool.
How to Choose the Right Enterprise Monitoring Software
This buyer's guide explains how to evaluate enterprise monitoring platforms using concrete capabilities from Dynatrace, Datadog, New Relic, Splunk Observability Cloud, Prometheus, Grafana, Zabbix, IBM Instana, CA Technologies (Broadcom) App Synthetic Monitoring, and Nagios XI. You will use it to map your reliability goals and telemetry sources to the monitoring workflows each product enables. You will also use it to avoid common deployment pitfalls tied to governance, alert noise, and operational overhead.
What Is Enterprise Monitoring Software?
Enterprise monitoring software collects signals from applications, infrastructure, and networks to detect failures, measure performance, and drive incident workflows. It turns telemetry into alerting, dashboards, and dependency views so teams can identify which components are affecting users. Tools like Dynatrace and Datadog combine traces, logs, and infrastructure signals to support end-to-end troubleshooting and alerting at scale.
Key Features to Look For
The features below determine whether you can move from detection to root-cause and reliable operations across large environments.
AI-driven root-cause correlation across full-stack signals
Dynatrace uses Davis AI for automated problem detection and root-cause analysis that correlates traces, logs, and infrastructure metrics. This capability reduces manual triage by pinpointing why an issue happened across hybrid app and infrastructure boundaries.
Unified observability view across metrics, logs, traces, and synthetic
Datadog unifies application, infrastructure, logs, and network monitoring with dashboards and alerting tied to real signals. Splunk Observability Cloud provides end-to-end visibility across metrics, logs, and traces plus service maps that clarify what broke and who was impacted.
Distributed tracing with dependency and service mapping
New Relic links transactions to underlying dependencies using distributed tracing with service maps for microservices troubleshooting. IBM Instana auto-discovers services and creates dependency maps that connect request performance to downstream hosts and networks.
Impact analysis that ties incidents to affected users and components
Splunk Observability Cloud highlights impact paths using service maps that support dependency impact analysis. This helps teams focus remediation on the specific components causing user-facing problems rather than isolated infrastructure alerts.
Incident-ready alerting that reduces noisy triage
Dynatrace and New Relic both use anomaly detection to reduce manual tuning and triage workload across production telemetry. Grafana provides alerting and notification routing driven directly from dashboard queries so teams can standardize alert behavior across many data sources.
Operational scaling with metrics-first query power and distribution
Prometheus delivers PromQL plus recording rules for durable, reusable time-series computations across Kubernetes and services. Zabbix scales monitoring using proxy-based distributed polling with trigger-based event correlation for large on-prem fleets.
How to Choose the Right Enterprise Monitoring Software
Pick the tool that matches your dominant telemetry workflows and the level of automation you need to reach fast, accurate incident resolution.
Start with the failure paths you must troubleshoot
If your top priority is automated root-cause across apps, infrastructure, and cloud services, Dynatrace fits because Davis AI correlates signals across traces, logs, and infrastructure metrics. If you prioritize tracing and dependency context for microservices, New Relic and IBM Instana help because they connect transactions to underlying dependencies using service maps and automated dependency mapping.
Match your incident workflow to the tool’s investigative mechanics
For teams that need fast, interactive investigation during incidents, Datadog Live Tail streaming supports interactive log and trace investigation tied to operational alerts. For reliability programs built around SLOs and service dependency analysis, Splunk Observability Cloud provides SLO management plus incident-focused alerting tied to service dependencies.
Choose the right approach for metrics at enterprise scale
If you run Kubernetes or microservices and want metrics-first monitoring with reusable query logic, Prometheus excels using PromQL plus recording rules and alerting paired with Alertmanager. If you need on-prem, agent and agentless monitoring at scale, Zabbix provides proxy-based distributed polling plus trigger-based event correlation.
Plan governance and standardization across teams
For multi-team standardization of observability views, Grafana supports enterprise governance via role-based access and audit-friendly controls plus alerting driven directly from dashboard queries. For broader governance controls tied to access, data retention, and deployment management, Datadog provides governance features for large organizations through integrations and APIs.
Validate synthetic and infrastructure coverage requirements
If end-user experience validation is part of your core monitoring strategy, CA Technologies (Broadcom) App Synthetic Monitoring runs scripted synthetic transactions with step-level availability and performance measurement from configured probe locations. If you need a flexible, plugin-based monitoring foundation for heterogeneous systems, Nagios XI provides custom checks and web-based administration for alerting, escalations, and monitoring configuration.
Who Needs Enterprise Monitoring Software?
Enterprise monitoring tools fit different operational models based on whether you need AI root-cause automation, unified observability, dependency mapping, or metrics-first scalability.
Enterprises needing AI root-cause observability across hybrid apps and infrastructure
Dynatrace is the best match because Davis AI provides automated problem detection and root-cause analysis that correlates traces, logs, and infrastructure metrics. Dynatrace also supports distributed tracing, real user monitoring, and infrastructure monitoring in a unified workflow.
Large enterprises needing unified observability with actionable alerting across metrics, logs, and traces
Datadog is a strong fit because it unifies metrics, logs, traces, and synthetic tests with real-time alerting connected to dashboards and incident workflows. Live Tail streaming also supports interactive log and trace investigation during active incidents.
Enterprises running microservices that require distributed tracing plus anomaly-driven alerting at scale
New Relic supports this model through distributed tracing with service maps that link transactions to underlying dependencies. It also uses anomaly detection with actionable alerting and dashboards built from cross-product signals.
Enterprises standardizing full-stack reliability management with service dependency analysis and SLO workflows
Splunk Observability Cloud matches this need because it provides SLO management and incident-focused alerting tied to service dependencies. Service maps and impact analysis clarify which users and components are affected.
Common Mistakes to Avoid
These pitfalls show up repeatedly when teams deploy enterprise monitoring without aligning telemetry strategy, workflow design, and operational governance.
Overlooking alert governance and tuning effort in complex estates
Datadog and New Relic can require careful tuning of monitor rules and anomaly thresholds when telemetry volume is high. Dynatrace also needs setup and governance to avoid signal sprawl across large enterprise estates.
Assuming metrics-only tools cover traces, logs, and real-user impact
Prometheus is metrics-first and logs and traces are not native, which forces external systems for full observability coverage. Zabbix provides infrastructure and network monitoring, but it does not replace distributed tracing workflows used by New Relic, IBM Instana, or Dynatrace.
Skipping service dependency mapping for microservices incident resolution
New Relic and IBM Instana provide dependency context through service maps and automated dependency mapping, which reduces time spent guessing where the failure propagates. Without this, teams often end up with isolated alerts instead of impact-driven investigation in Splunk Observability Cloud.
Building dashboards and alerts without query standards or workflow integration
Grafana delivers alerting driven from dashboard queries, but alert correctness depends on upstream data quality and query design. Splunk Observability Cloud dashboards and workflows can require Splunk experience to optimize effectively, which creates delays if teams skip standardization.
How We Selected and Ranked These Tools
We evaluated Dynatrace, Datadog, New Relic, Splunk Observability Cloud, Prometheus, Grafana, Zabbix, IBM Instana, CA Technologies (Broadcom) App Synthetic Monitoring, and Nagios XI across overall capability, feature depth, ease of use, and value for enterprise monitoring workloads. We separated Dynatrace from lower-ranked options by scoring its Davis AI for automated problem detection and root-cause analysis higher than purely manual investigation flows. We also emphasized how distributed tracing and service mapping features support faster troubleshooting, like New Relic service maps linking transactions to dependencies and IBM Instana automated dependency mapping.
Frequently Asked Questions About Enterprise Monitoring Software
Which enterprise monitoring platform best targets AI-driven root-cause analysis across hybrid applications and infrastructure?
How do Datadog and New Relic differ in the way they correlate metrics, logs, traces, and alerting into incident workflows?
Which solution is best for SLO management and service dependency impact analysis in distributed systems?
What should an enterprise choose for Kubernetes-first metrics collection and long-term alerting with reusable queries?
When teams need a standardized observability dashboard layer across many data sources, what tends to work best?
Which enterprise option is strongest for on-prem monitoring with centralized polling and flexible event correlation?
If microservices require automated dependency mapping tied to request traces, which platform fits that workflow?
How do Dynatrace and Instana compare for investigating incidents quickly using context instead of dashboard hunting?
When enterprises want scripted synthetic checks with enterprise monitoring governance and correlation, which tool is a match?
What makes Nagios XI a practical enterprise choice for heterogeneous infrastructure monitoring with custom plugins and alert escalation?
Tools reviewed
Primary sources checked during evaluation.
Referenced in the comparison table and product reviews above.
Keep exploring
Comparing two specific tools?
Software Alternatives
See head-to-head software comparisons with feature breakdowns, pricing, and our recommendation for each use case.
Explore software alternatives→In this category
Technology Digital Media alternatives
See side-by-side comparisons of technology digital media tools and pick the right one for your stack.
Compare technology digital media tools→FOR SOFTWARE VENDORS
Not on this list? Let’s fix that.
Our best-of pages are how many teams discover and compare tools in this space. If you think your product belongs in this lineup, we’d like to hear from you—we’ll walk you through fit and what an editorial entry looks like.
Apply for a ListingWHAT THIS INCLUDES
Where buyers compare
Readers come to these pages to shortlist software—your product shows up in that moment, not in a random sidebar.
Editorial write-up
We describe your product in our own words and check the facts before anything goes live.
On-page brand presence
You appear in the roundup the same way as other tools we cover: name, positioning, and a clear next step for readers who want to learn more.
Kept up to date
We refresh lists on a regular rhythm so the category page stays useful as products and pricing change.