


In today’s fast-paced business world, companies are constantly looking for ways to evaluate and optimize their performance. While traditional metrics such as revenue and profit are essential, they often fail to provide a complete and accurate picture of an organization’s success. As a result, a growing number of forward-thinking executives are turning to value-based metrics, a more holistic approach to measuring progress and driving continuous improvement.
In this insightful blog post, we’ll explore the concept of value-based metrics, discuss their importance in facilitating sustainable growth, and offer practical tips on how to successfully implement these metrics in your organization. Get ready to embark on a journey toward more meaningful decision-making and a stronger values-based culture.
Value Based Metrics You Should Know
Value-based metrics are a set of measurements that assess an organization’s or project’s performance in terms of the value it creates for its customers, stakeholders, and its own operation. Here are some common value-based metrics with a short explanation for each:
1. Customer Lifetime Value (CLTV)
CLTV is the total revenue a business can reasonably expect to raise from a single customer account over the entire duration of their relationship.
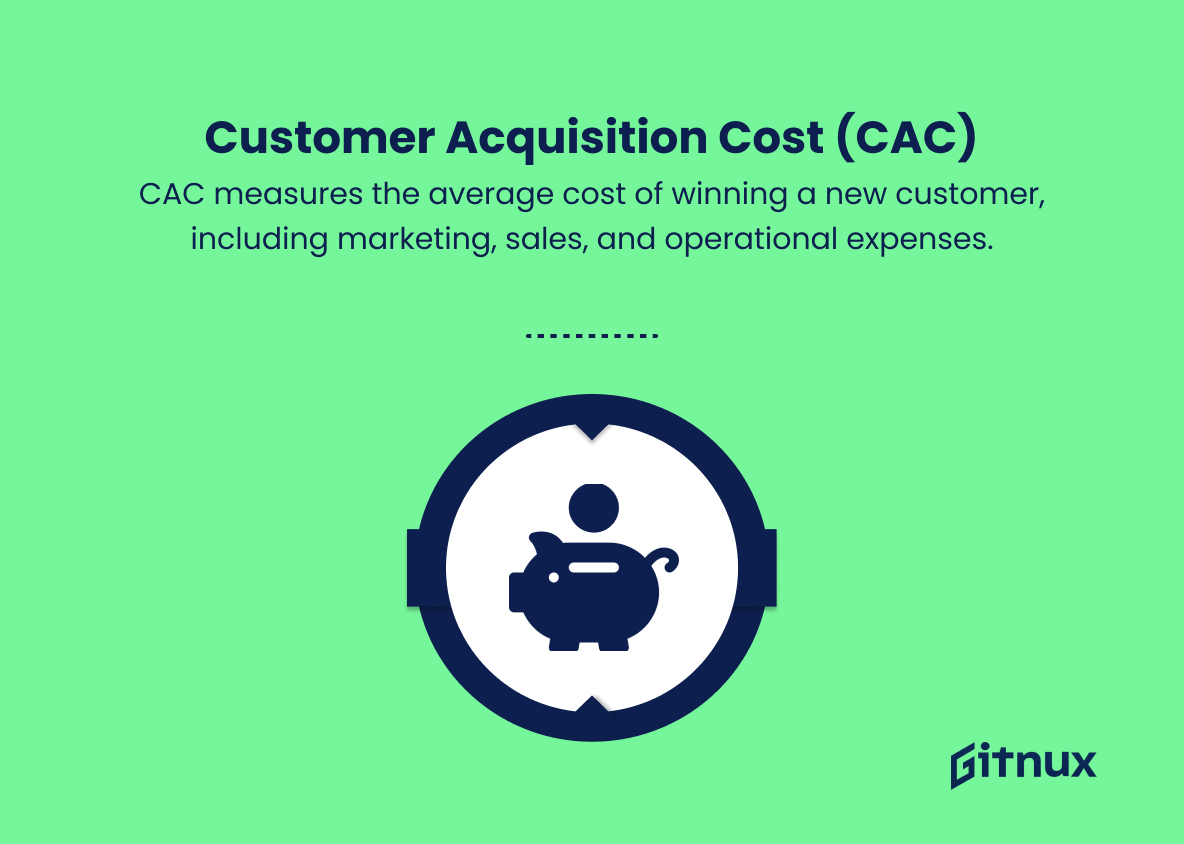
2. Customer Acquisition Cost (CAC)
CAC measures the average cost of winning a new customer, including marketing, sales, and operational expenses.
3. Net Promoter Score (NPS)
NPS is a measure of customer satisfaction, assessing the likelihood that customers will recommend a company, product, or service to others.
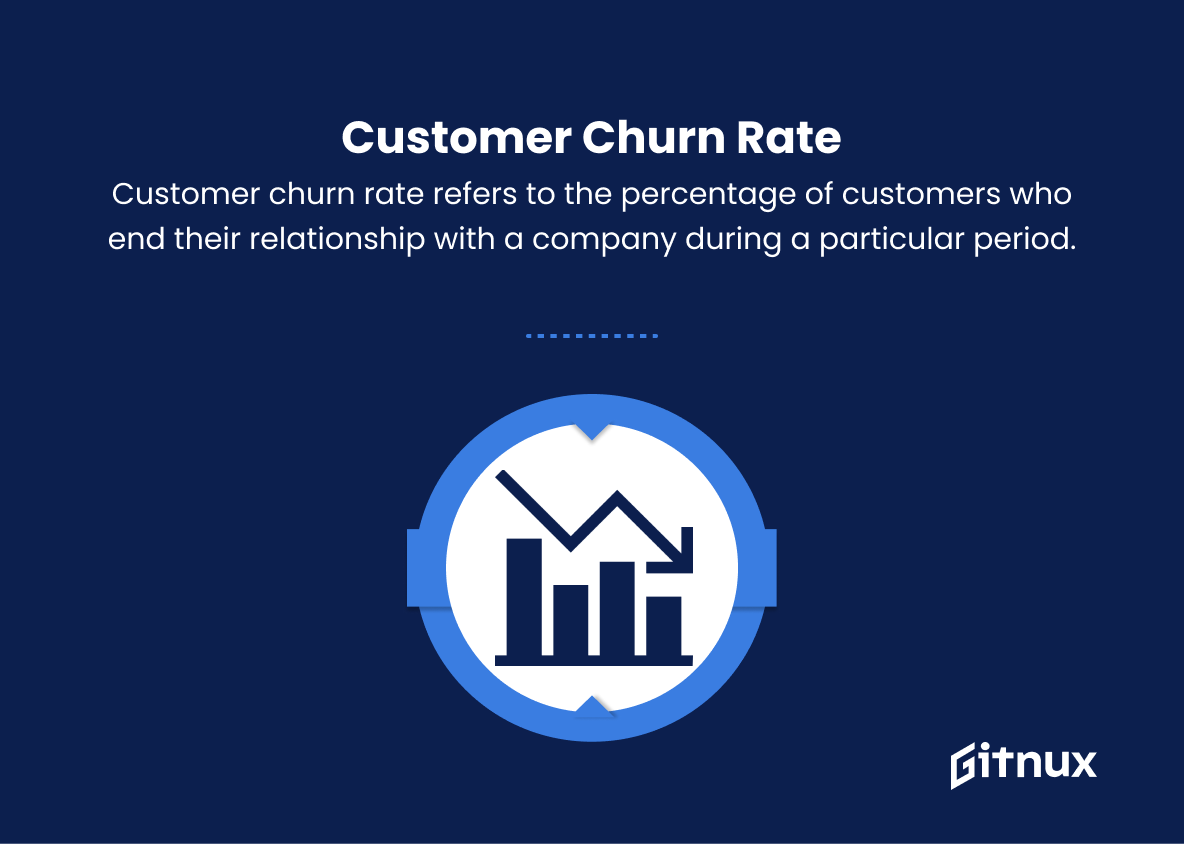
4. Customer Churn Rate
Customer churn rate refers to the percentage of customers who end their relationship with a company during a particular period.
5. Customer Retention Rate
Customer retention rate assesses the proportion of customers who remain loyal and continue to do business with a company over a given period.
6. Return on Investment (ROI)
ROI measures the efficiency and profitability of investments made by an organization or project, expressed as a percentage.
7. Gross Margin
Gross margin is the percentage of total sales revenue that a company retains after accounting for the costs associated with producing and selling the goods or services.
8. Profit Margin
Profit margin is the percentage of total revenue that a company retains after accounting for all expenses, including taxes and interest.
9. Return on Assets (ROA)
ROA is an indicator of how well a company uses its assets to generate profit, expressed as a percentage of total assets.
10. Return on Equity (ROE)
ROE is a measure of a corporation’s financial performance, calculated by dividing net income by the total shareholder’s equity.
11. Productivity Metrics
These metrics evaluate the efficiency of different aspects of a company, such as labor productivity or asset productivity.
12. Sales Growth Rate
Sales growth rate is a measure of the increase or decrease in a company’s sales over a specific period, expressed as a percentage.
13. Market Share
Market share is the percentage of an industry’s total sales allocated to a particular company or product.
14. Employee Engagement
Employee engagement measures the level of commitment, passion, and satisfaction among an organization’s employees.
15. Quality Metrics
Quality metrics evaluate how well a company’s products and processes meet customer requirements and expectations. Common quality metrics include defect rates, customer complaints, and return rates.
Overall, value-based metrics help identify areas where a company or project is performing well and areas where improvement is needed, allowing organizations to make data-driven decisions that contribute to business growth and success.
Value Based Metrics Explained
Value-based metrics are essential for assessing an organization’s performance by demonstrating the value created for customers, stakeholders, and the organization itself. These metrics, including Customer Lifetime Value, Customer Acquisition Cost, Net Promoter Score, Customer Churn Rate, Customer Retention Rate, Return on Investment, Gross Margin, Profit Margin, Return on Assets, Return on Equity, Productivity Metrics, Sales Growth Rate, Market Share, Employee Engagement, and Quality Metrics, provide valuable insights into the effectiveness of business strategies and the satisfaction of customers.
By analyzing these measurements, organizations can identify strengths and weaknesses to make informed, data-driven decisions that drive growth and success. Furthermore, value-based metrics enable companies to optimize their resources, enhance customer relationships, and improve overall operational efficiency, ultimately contributing to a sustainable and competitive advantage in the market.
Conclusion
In the dynamic world of business, it’s crucial for companies to constantly evolve and reassess their strategies. Value Based Metrics serve as a valuable tool, enabling organizations to better align their choices with their core values and stakeholder expectations.
By incorporating these metrics into decision-making processes, businesses can not only improve their financial performance, but also foster sustainability, customer satisfaction, and ethical growth. Ultimately, embracing a value-driven approach is essential for businesses that aspire to succeed in an increasingly competitive and socially conscious global landscape.
