In today’s technology-driven world, the significance of robust and reliable software cannot be overstated. As businesses, organizations, and individuals alike rely heavily on software applications to perform critical tasks, ensuring their seamless functionality becomes a top priority. This is where Software Reliability Metrics come into play. By measuring and analyzing vital aspects of software performance, engineers can actively identify potential vulnerabilities, track improvements, and optimize system efficiency.
In this comprehensive blog post, we will delve into the world of Software Reliability Metrics, discussing their importance, various types, and best practices for leveraging these crucial indicators to create high-quality, dependable software solutions. So, join us as we explore the intricacies of these powerful tools and learn how to harness their potential in improving software reliability and user satisfaction.
Software Reliability Metrics You Should Know
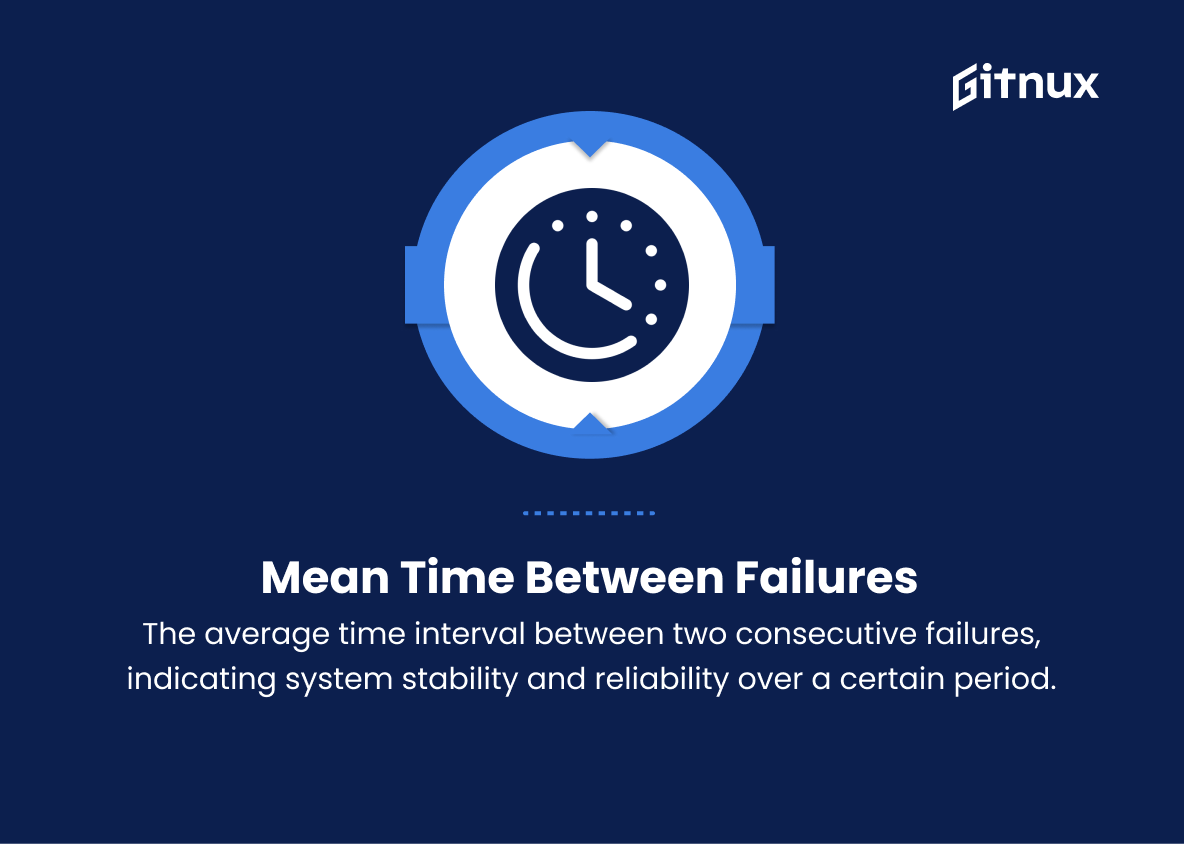
1. Mean Time Between Failures (MTBF)
The average time interval between two consecutive failures, indicating system stability and reliability over a certain period.
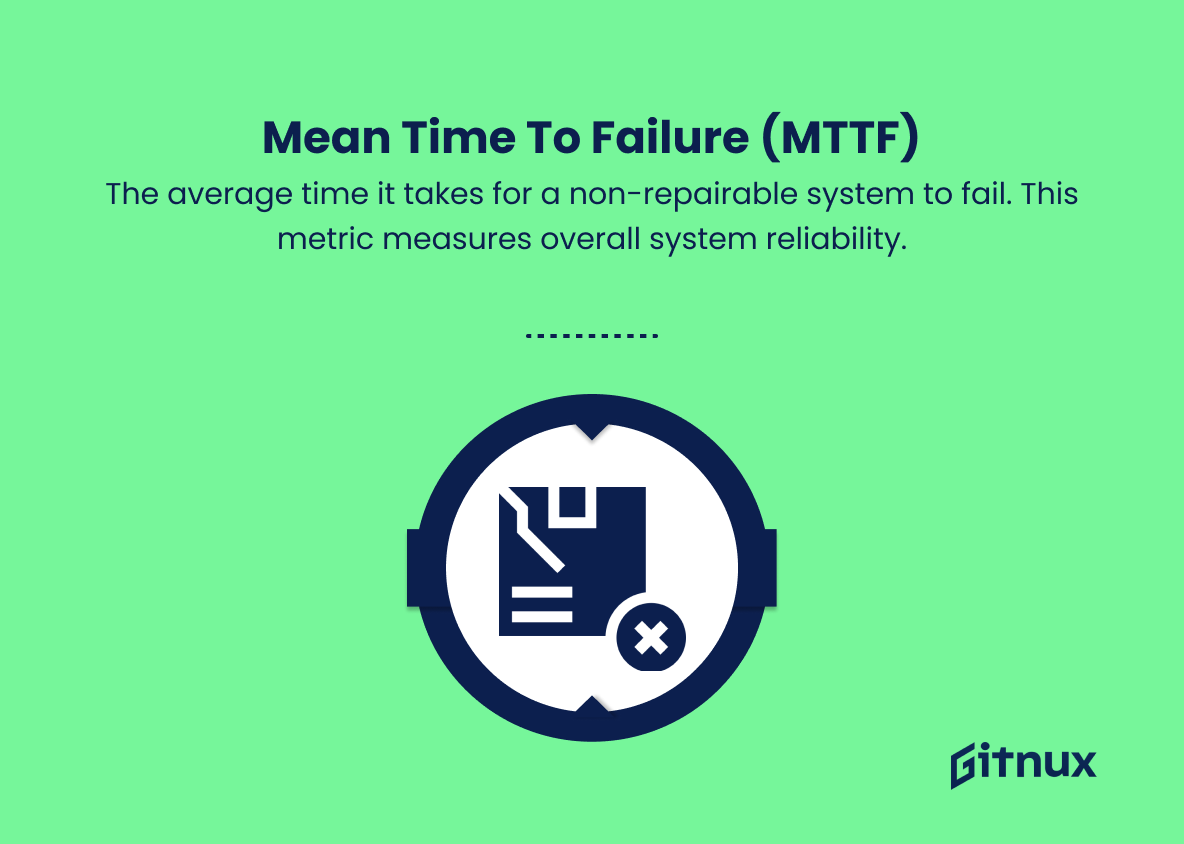
2. Mean Time To Failure (MTTF)
The average time it takes for a non-repairable system to fail. This metric measures overall system reliability.
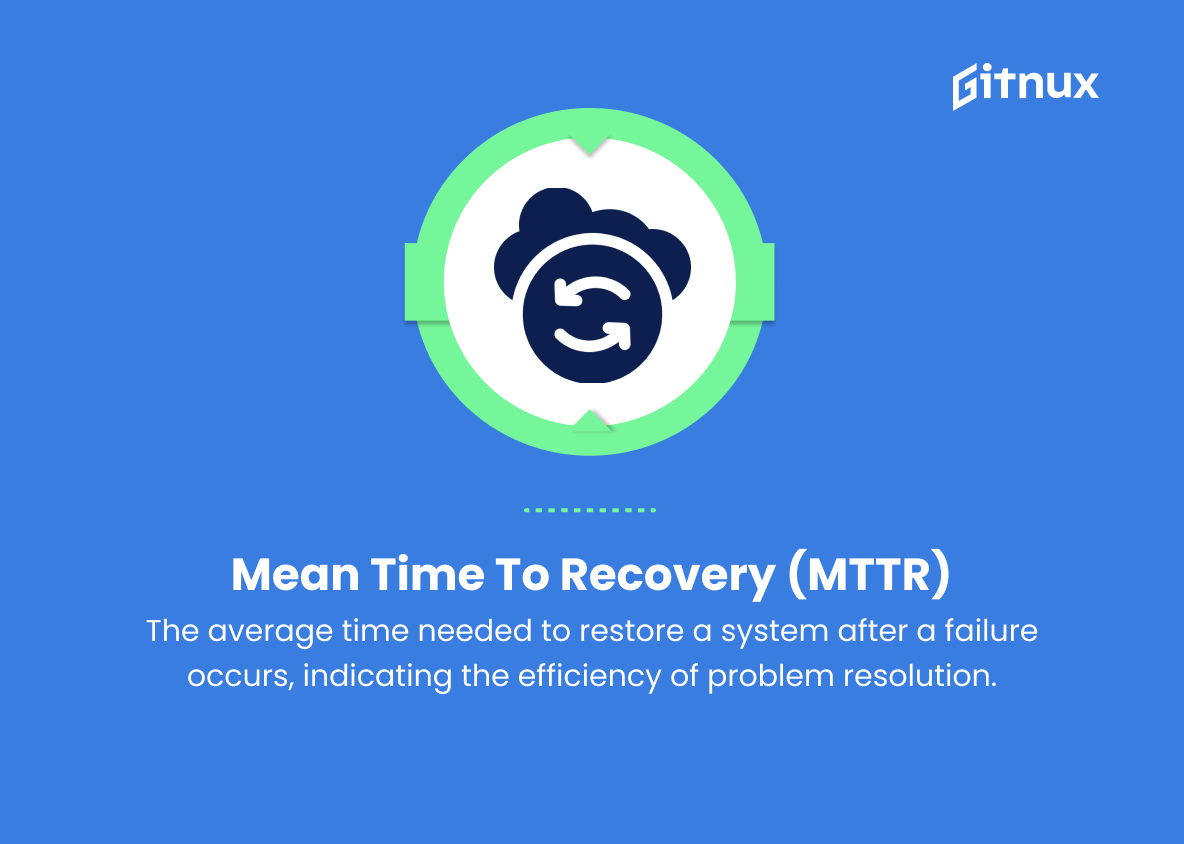
3. Mean Time To Recovery (MTTR)
The average time needed to restore a system after a failure occurs, indicating the efficiency of problem resolution.
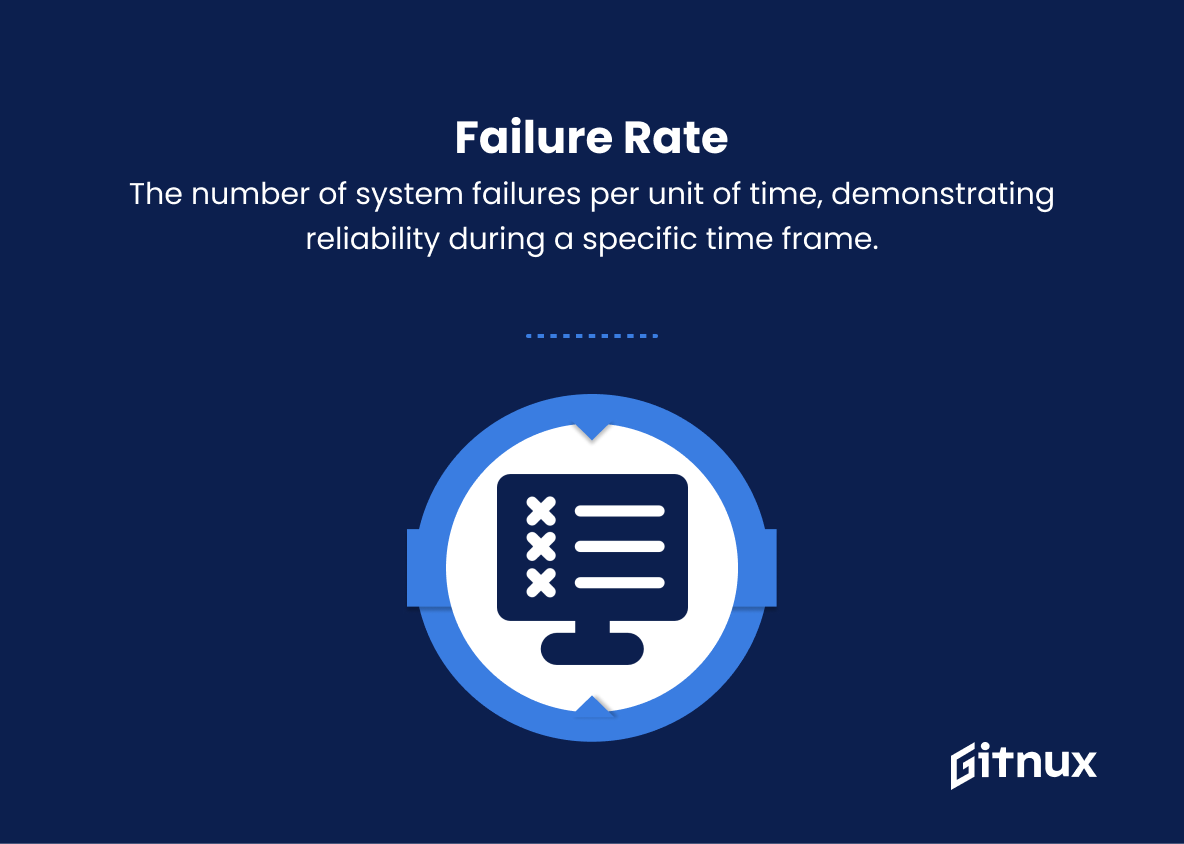
4. Failure Rate
The number of system failures per unit of time, demonstrating reliability during a specific time frame.
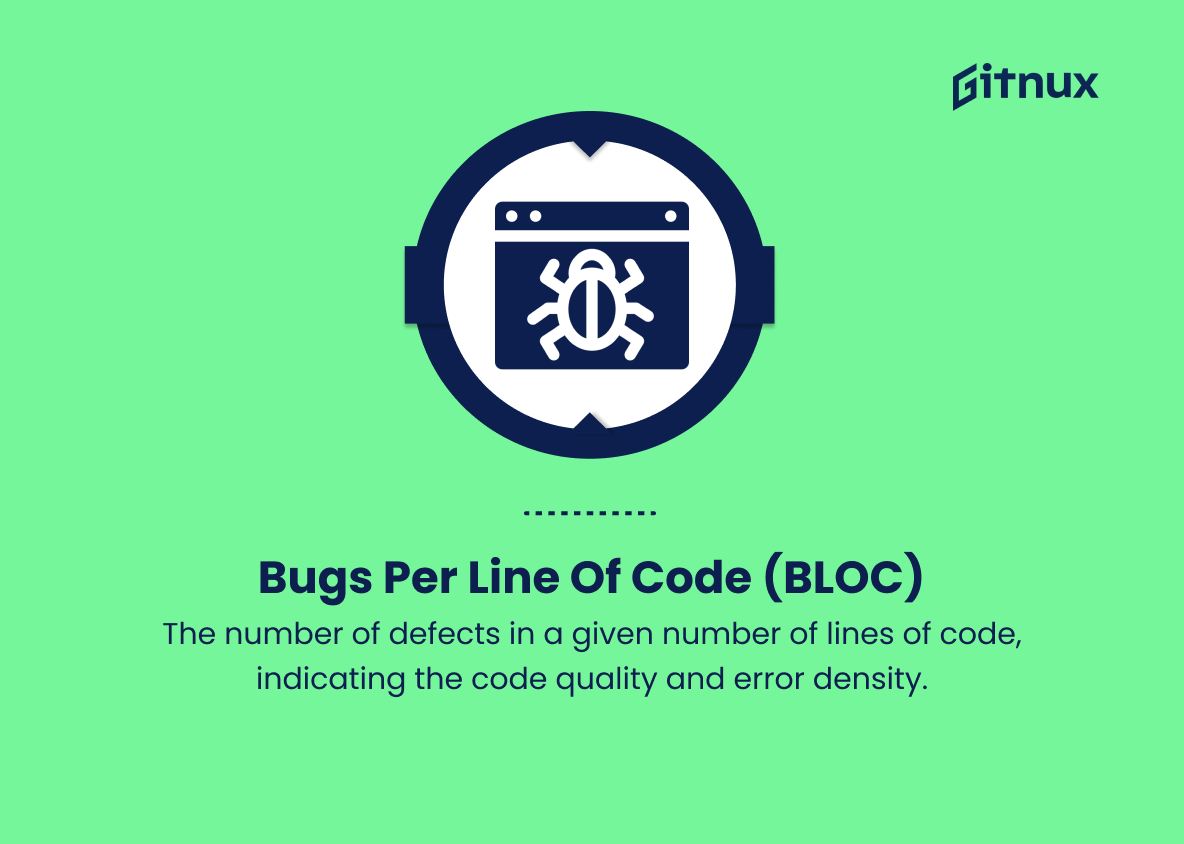
5. Bugs per Line of Code (BLOC)
The number of defects in a given number of lines of code, indicating the code quality and error density.
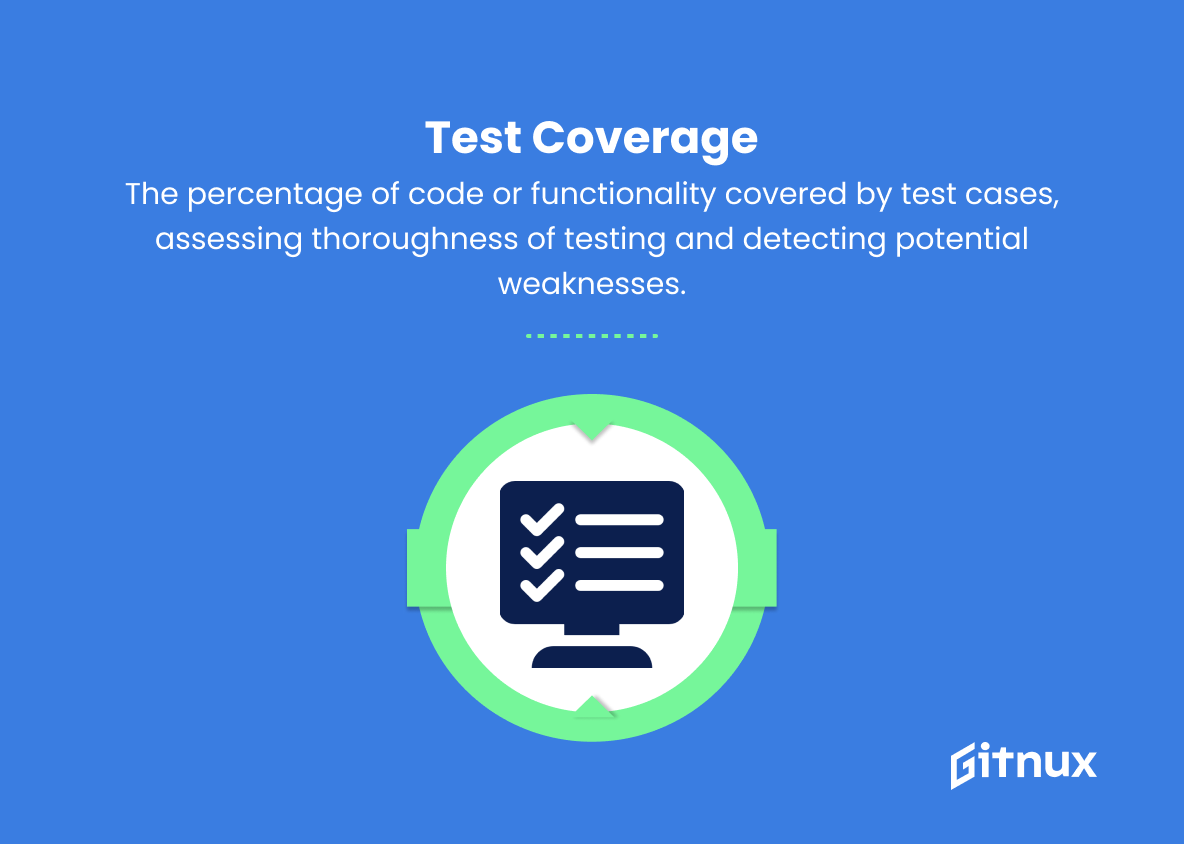
6. Test Coverage
The percentage of code or functionality covered by test cases, assessing thoroughness of testing and detecting potential weaknesses.
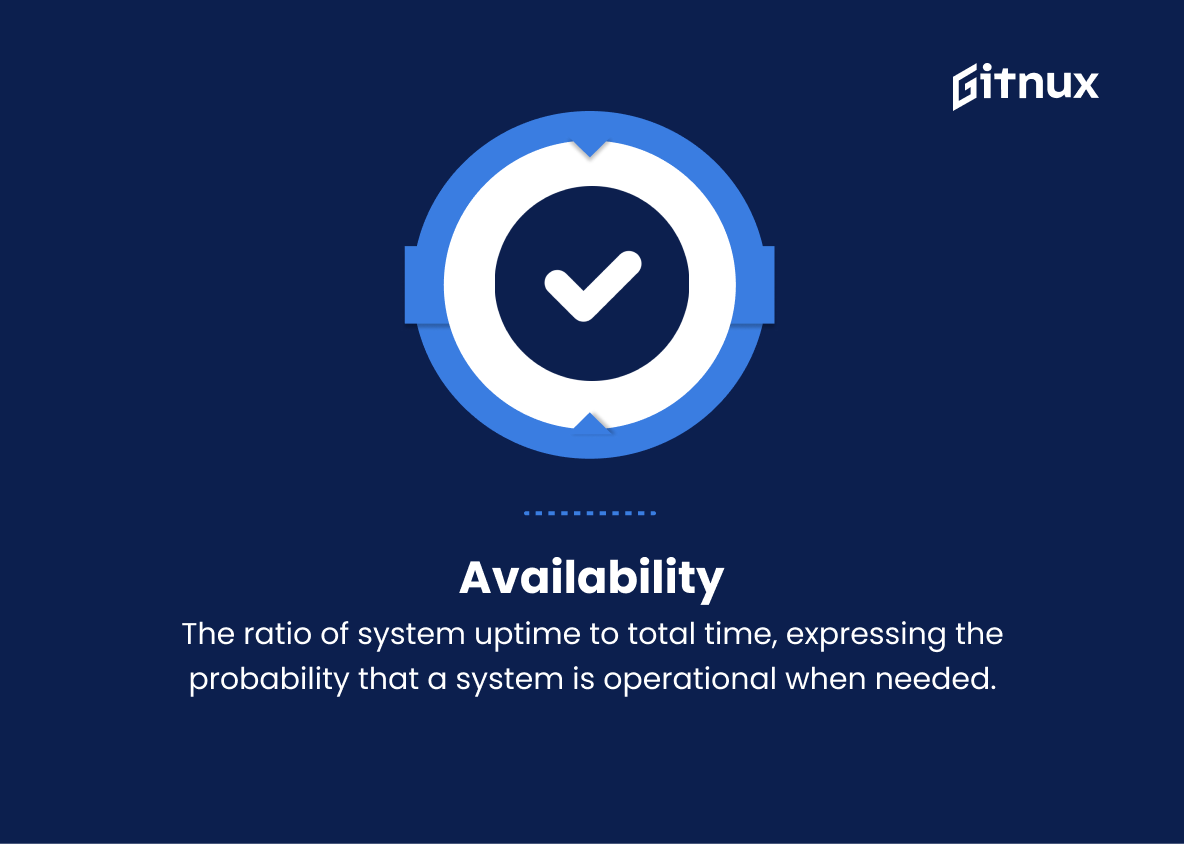
7. Availability
The ratio of system uptime to total time, expressing the probability that a system is operational when needed.
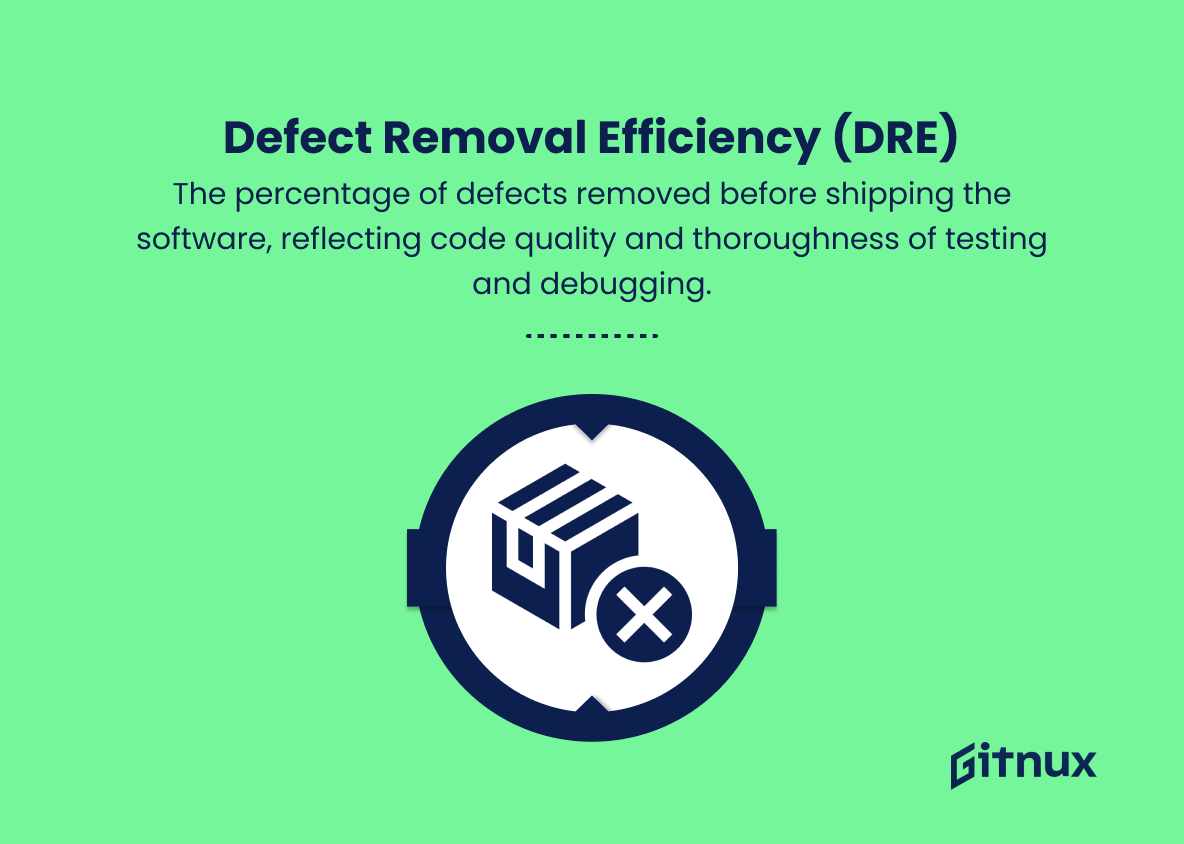
8. Defect Removal Efficiency (DRE)
The percentage of defects removed before shipping the software, reflecting code quality and thoroughness of testing and debugging.
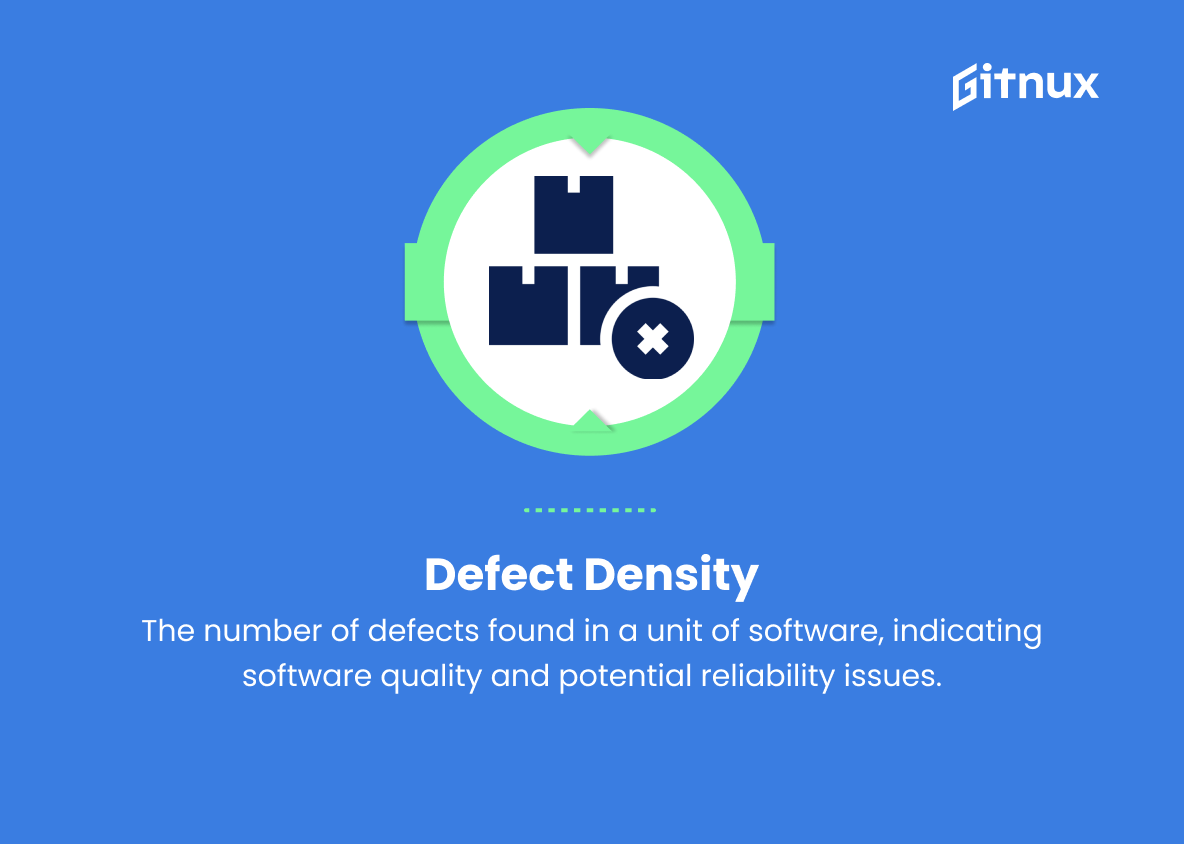
9. Defect Density
The number of defects found in a unit of software (e.g., per thousand lines of code), indicating software quality and potential reliability issues.
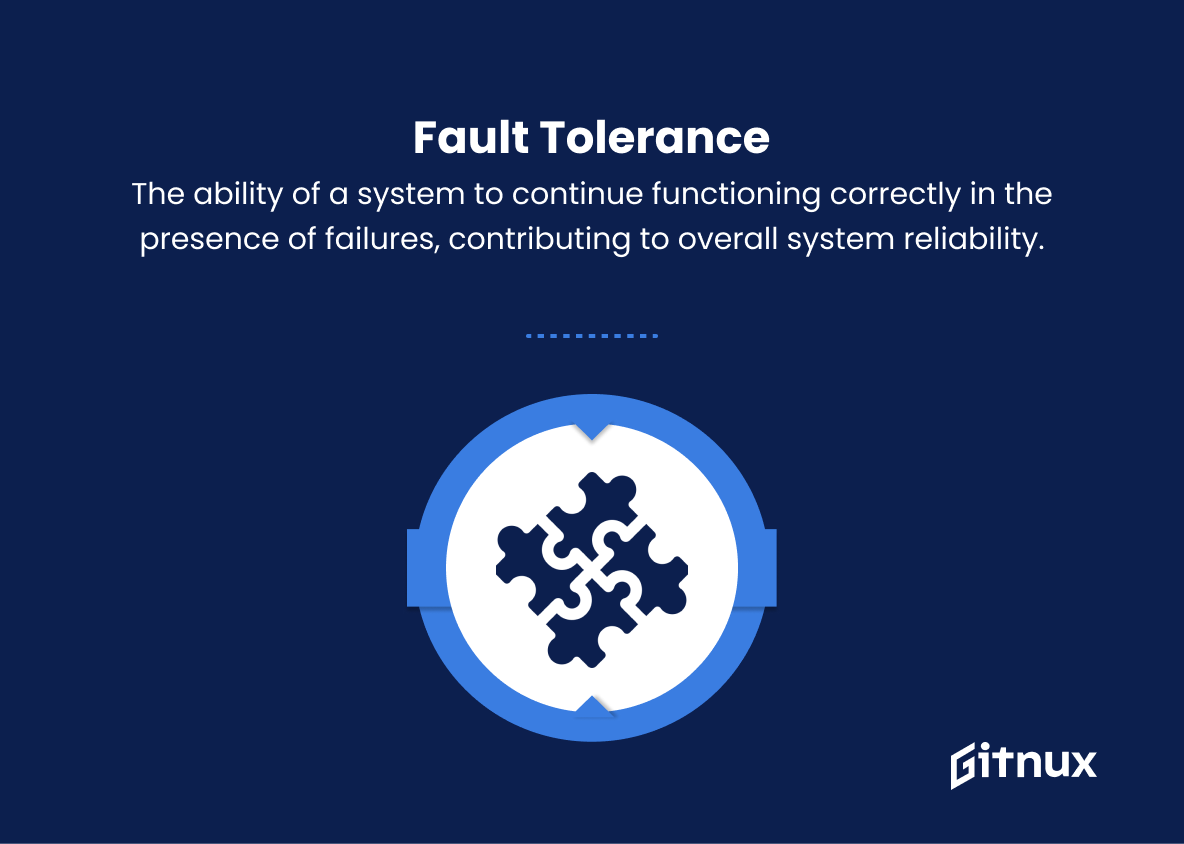
10. Fault Tolerance
The ability of a system to continue functioning correctly in the presence of failures, contributing to overall system reliability.
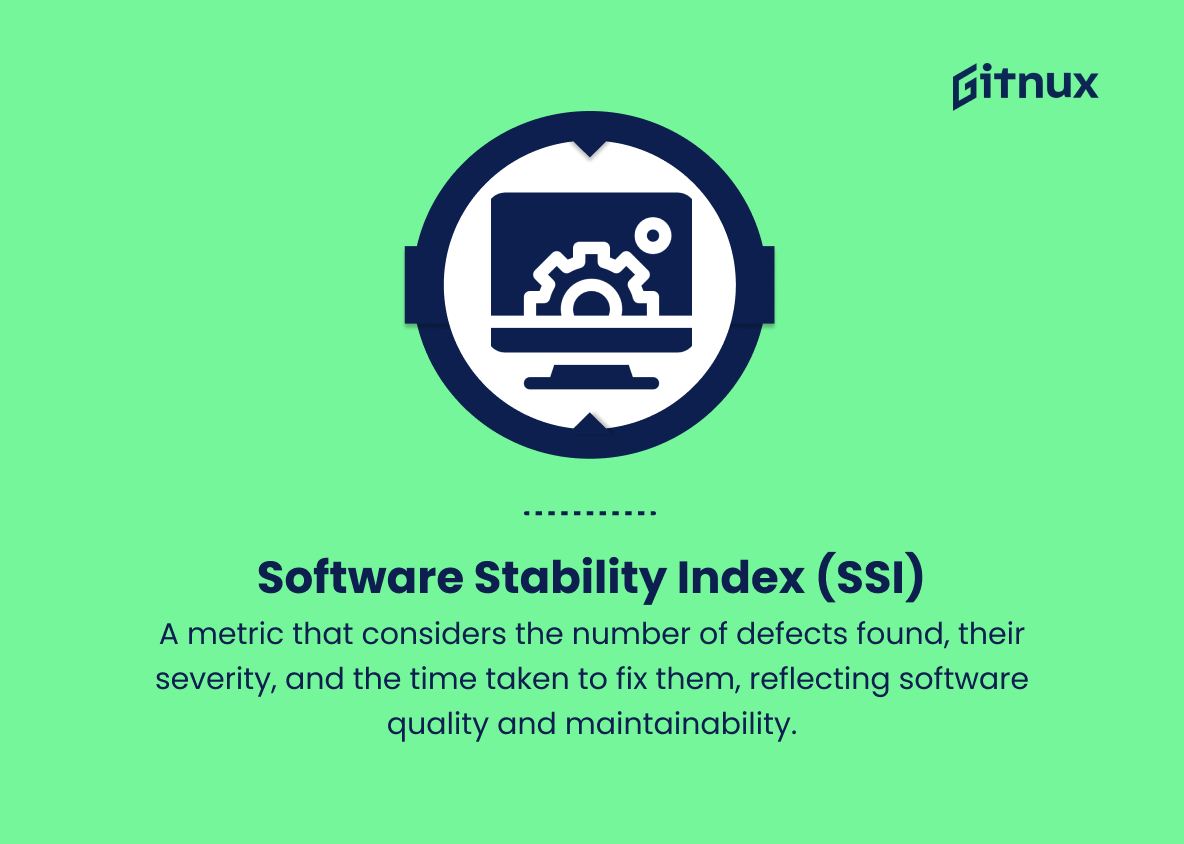
11. Software Stability Index (SSI)
A metric that considers the number of defects found, their severity, and the time taken to fix them, reflecting software quality and maintainability.
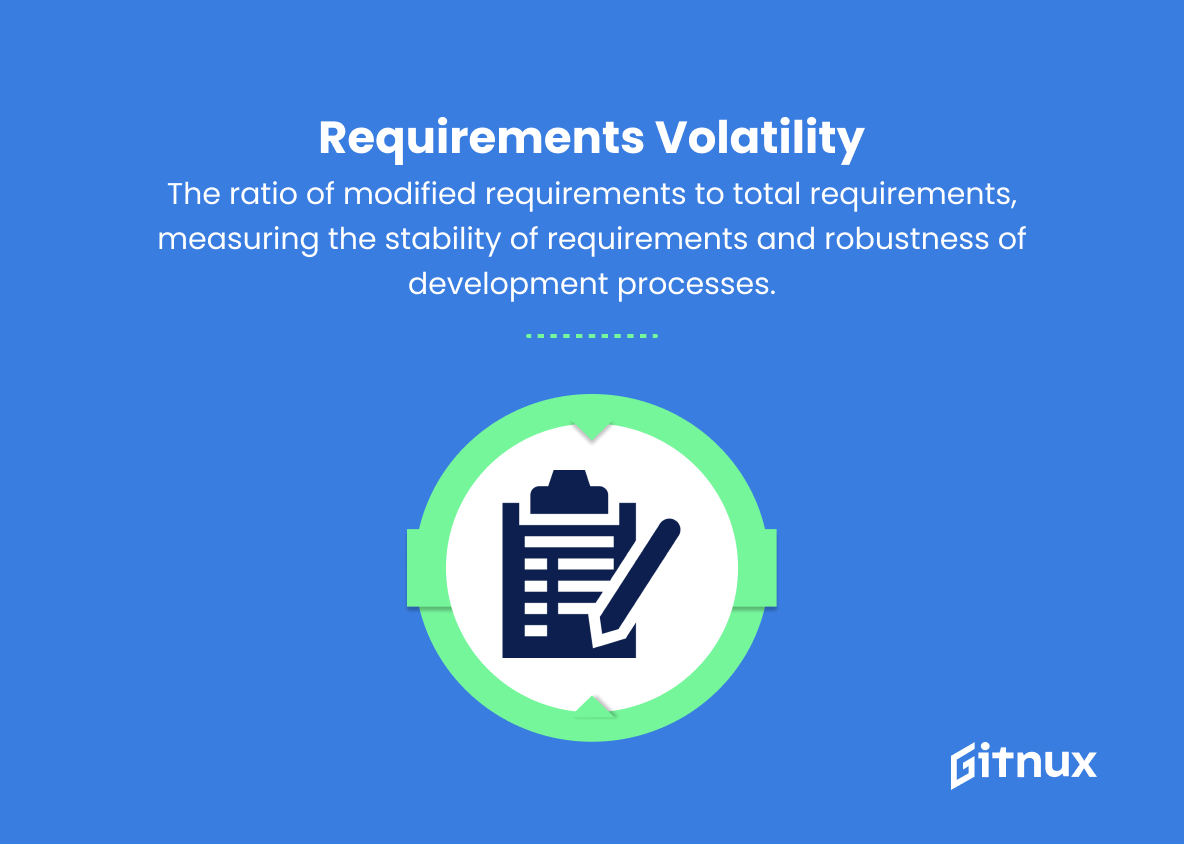
12. Requirements Volatility
The ratio of modified requirements to total requirements, measuring the stability of requirements and robustness of development processes.
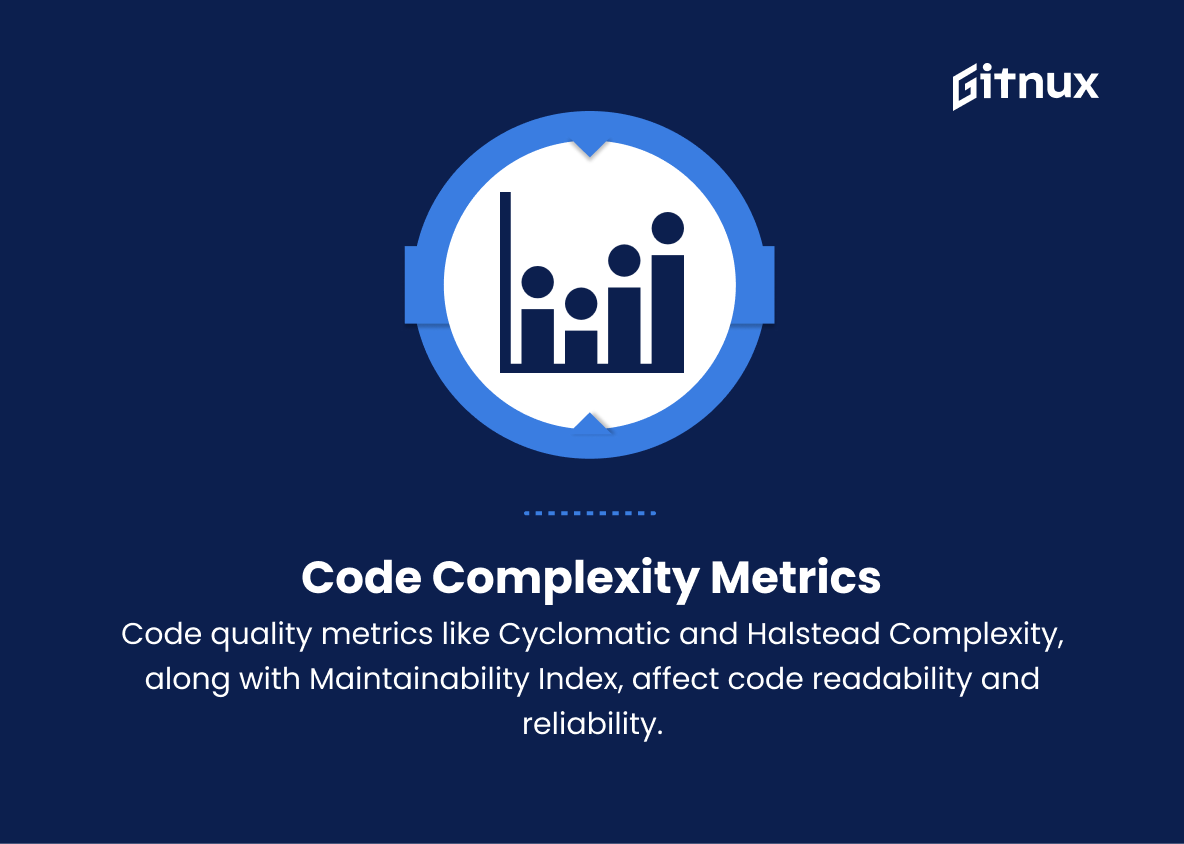
13. Code Complexity Metrics
A set of metrics such as Cyclomatic Complexity, Halstead Complexity, and Maintainability Index that assess code quality, readability, and maintainability, affecting software reliability.
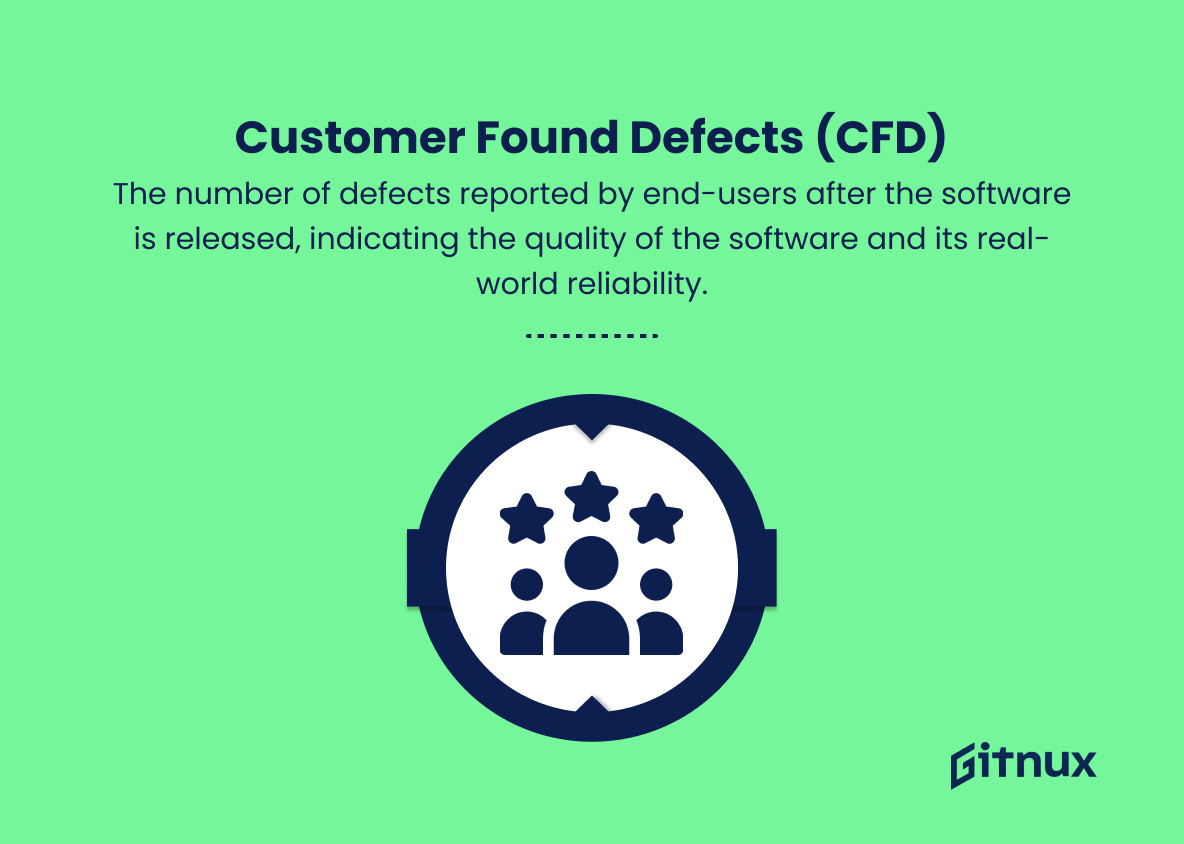
14. Customer Found Defects (CFD)
The number of defects reported by end-users after the software is released, indicating the quality of the software and its real-world reliability.
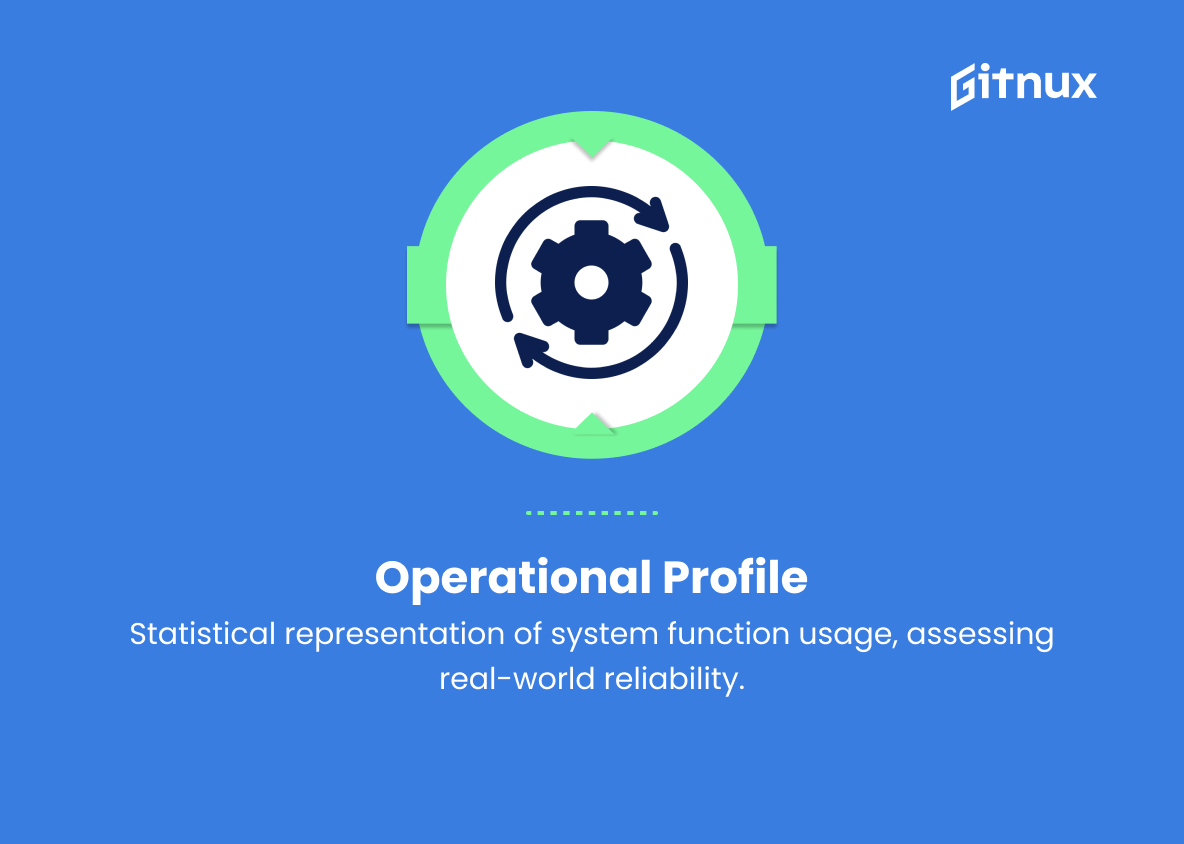
15. Operational Profile
A statistical representation of how a system is used, including usage frequencies for different functions, allowing the evaluation of system reliability under real-world conditions.
These are just a few key software reliability metrics. There are many others depending on the specific context and needs of a software development project.
Software Reliability Metrics Explained
Software reliability metrics play a crucial role in measuring and ensuring the quality, stability, and maintainability of a system. Metrics like Mean Time Between Failures (MTBF) and Mean Time to Failure (MTTF) help in assessing system reliability and stability, whereas Mean Time to Recovery (MTTR) evaluates the efficiency of problem resolution. Failure Rate and Bugs per Line of Code (BLOC) indicate the system’s reliability and code quality during specific timeframes. Metrics like Test Coverage, Availability, Defect Removal Efficiency (DRE), Defect Density, and Fault Tolerance provide insights into the code’s quality, potential reliability issues, and the system’s ability to function despite failures.
Software Stability Index (SSI), Requirements Volatility, and Code Complexity Metrics further reflect the software’s quality and maintainability, thus affecting its overall reliability. Lastly, Customer Found Defects (CFD) indicate real-world reliability, and the Operational Profile enables the evaluation of system reliability under real-world conditions. These essential software reliability metrics ensure the development of high-quality, stable, and maintainable software that meets end-user expectations and requirements.
Conclusion
In summary, software reliability metrics play a crucial role in quantifying the performance, dependability, and overall quality of software systems. By implementing these metrics, development teams can uncover potential issues, optimize functionality, and ensure a positive user experience.
Understanding how to utilize these measurements effectively not only adds value to the development process but also paves the way for more reliable and robust software solutions in the future. Ultimately, investing time and resources in measuring software reliability is indispensable as it helps organizations maintain their competitive edge and deliver cutting-edge technological advancements.
