
In today’s digital era, mobile apps have become an indispensable asset for businesses, revolutionizing how brands engage with customers and optimize their strategies for success. As the mobile app landscape continues to flourish, it necessitates the understanding and effective utilization of app engagement metrics to measure and enhance user interactions.
In this insightful blog post, we will delve into the key performance indicators and vital metrics that provide an accurate depiction of user engagement, enabling businesses to evaluate their mobile apps’ performance and curate exceptional experiences for their users. Unlock the power of mobile app engagement metrics and leverage this valuable data to propel your business towards unprecedented heights.
Mobile App Engagement Metrics You Should Know
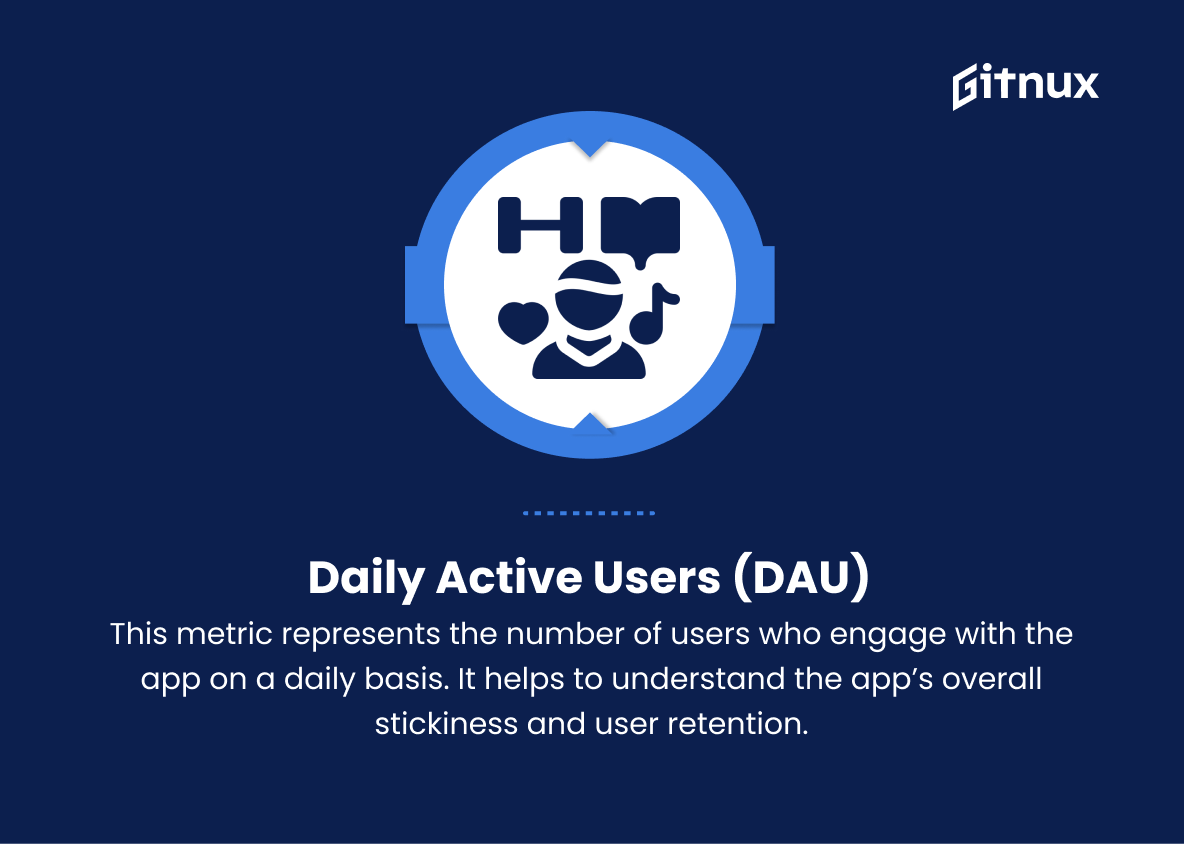
1. Daily Active Users (DAU)
This metric represents the number of users who engage with the app on a daily basis. It helps to understand the app’s overall stickiness and user retention.
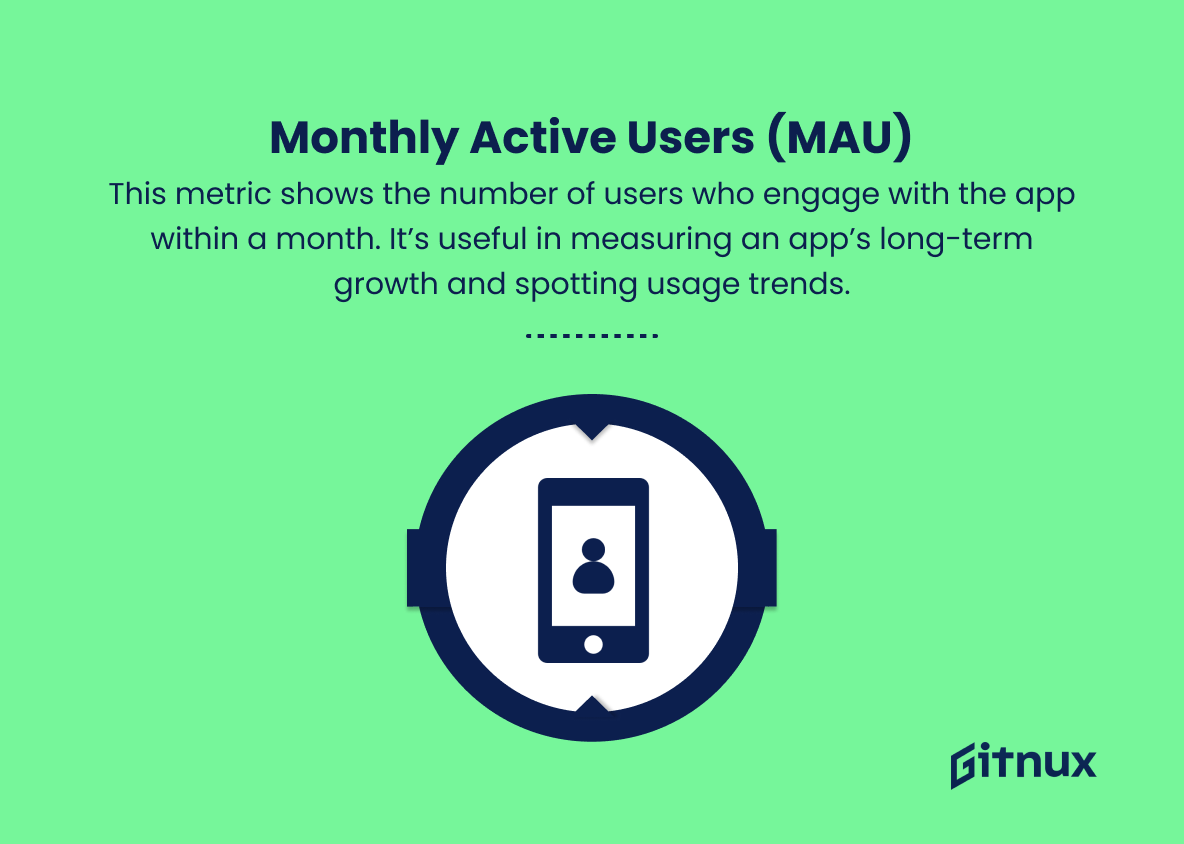
2. Monthly Active Users (MAU)
This metric shows the number of users who engage with the app within a month. It’s useful in measuring an app’s long-term growth and spotting usage trends.
3. Session Length
This refers to the duration of a user’s interaction with the app from start to finish in a single sitting. It helps to understand user engagement and optimize the app experience based on average session lengths.
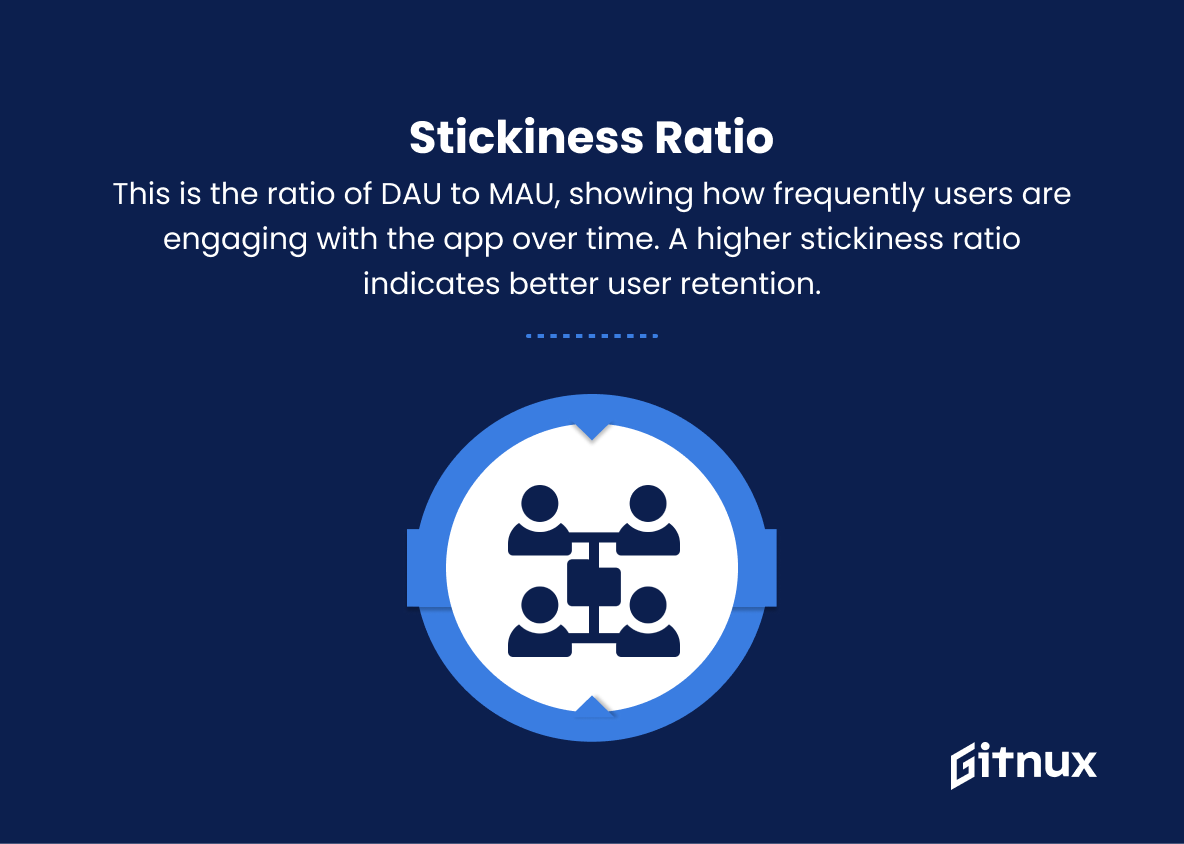
4. Stickiness Ratio
This is the ratio of DAU to MAU, showing how frequently users are engaging with the app over time. A higher stickiness ratio indicates better user retention.
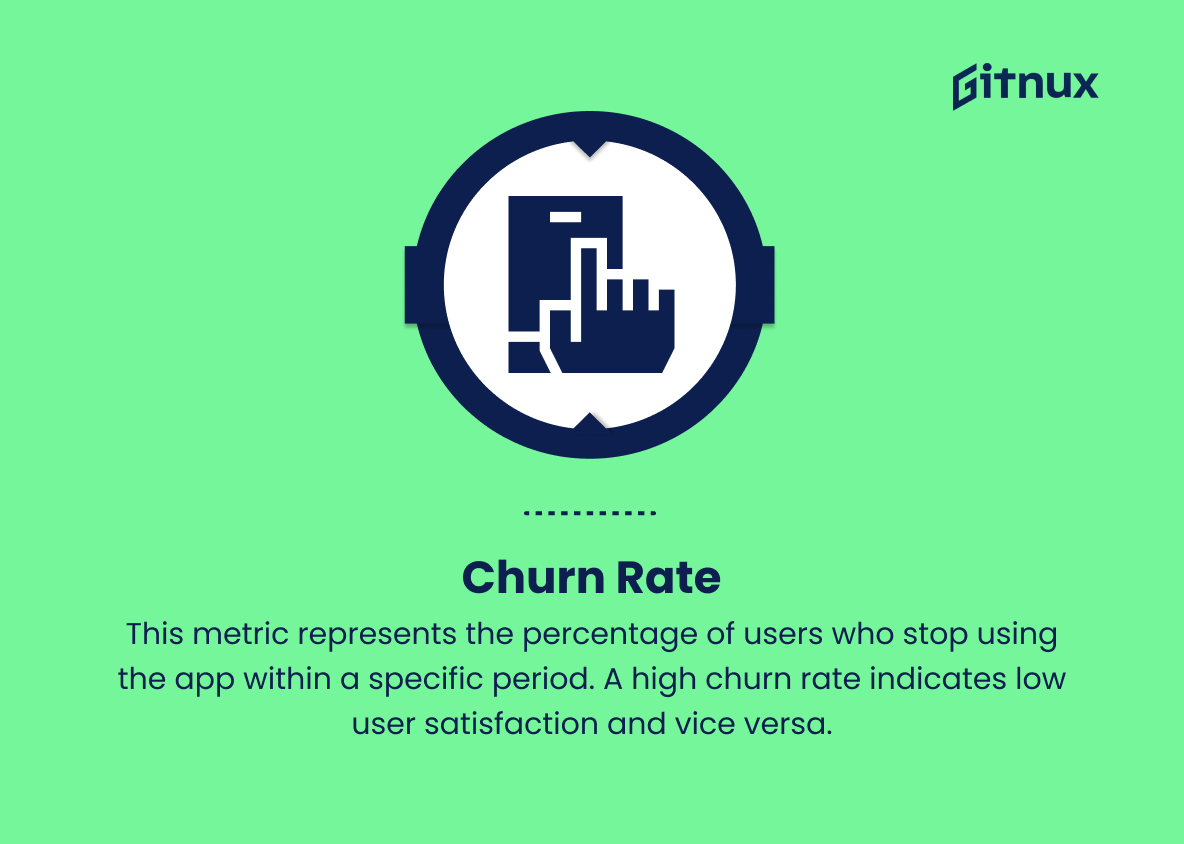
5. Churn Rate
This metric represents the percentage of users who stop using the app within a specific period. A high churn rate indicates low user satisfaction and vice versa.
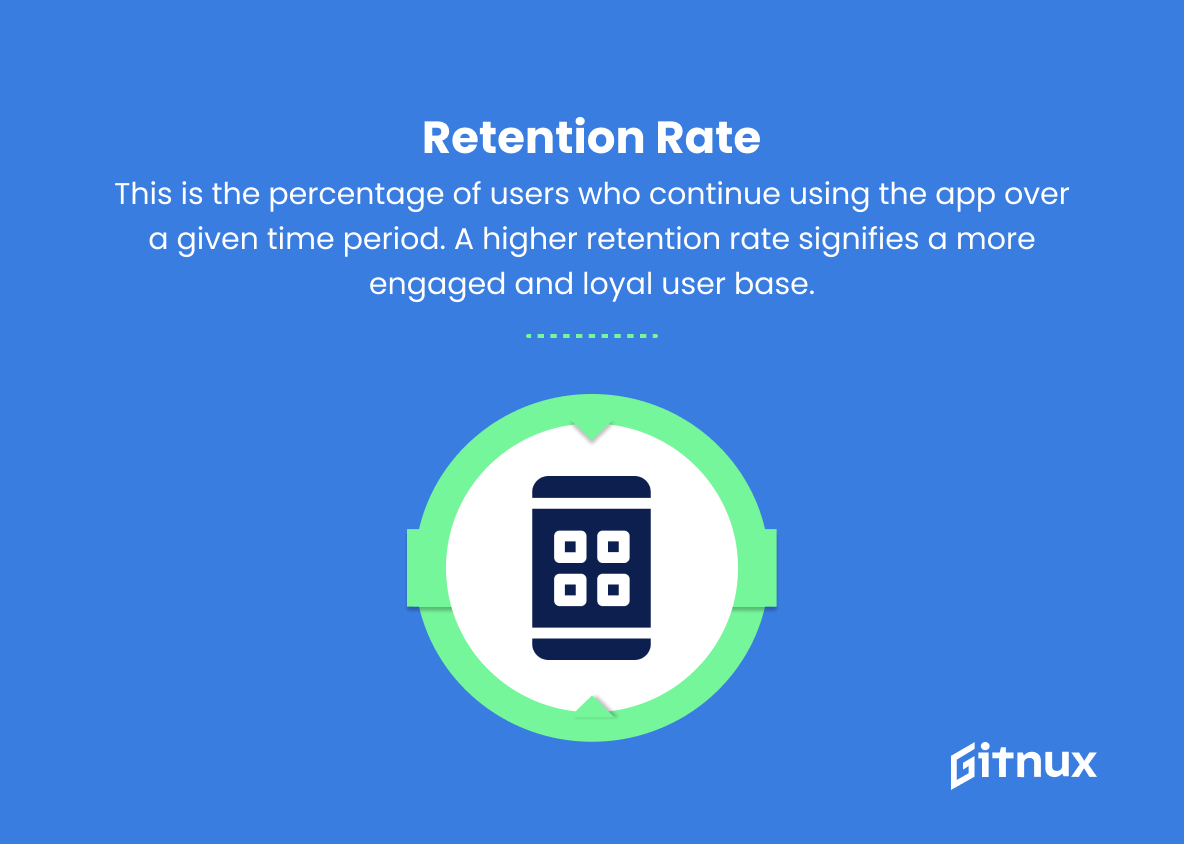
6. Retention Rate
This is the percentage of users who continue using the app over a given time period. A higher retention rate signifies a more engaged and loyal user base.
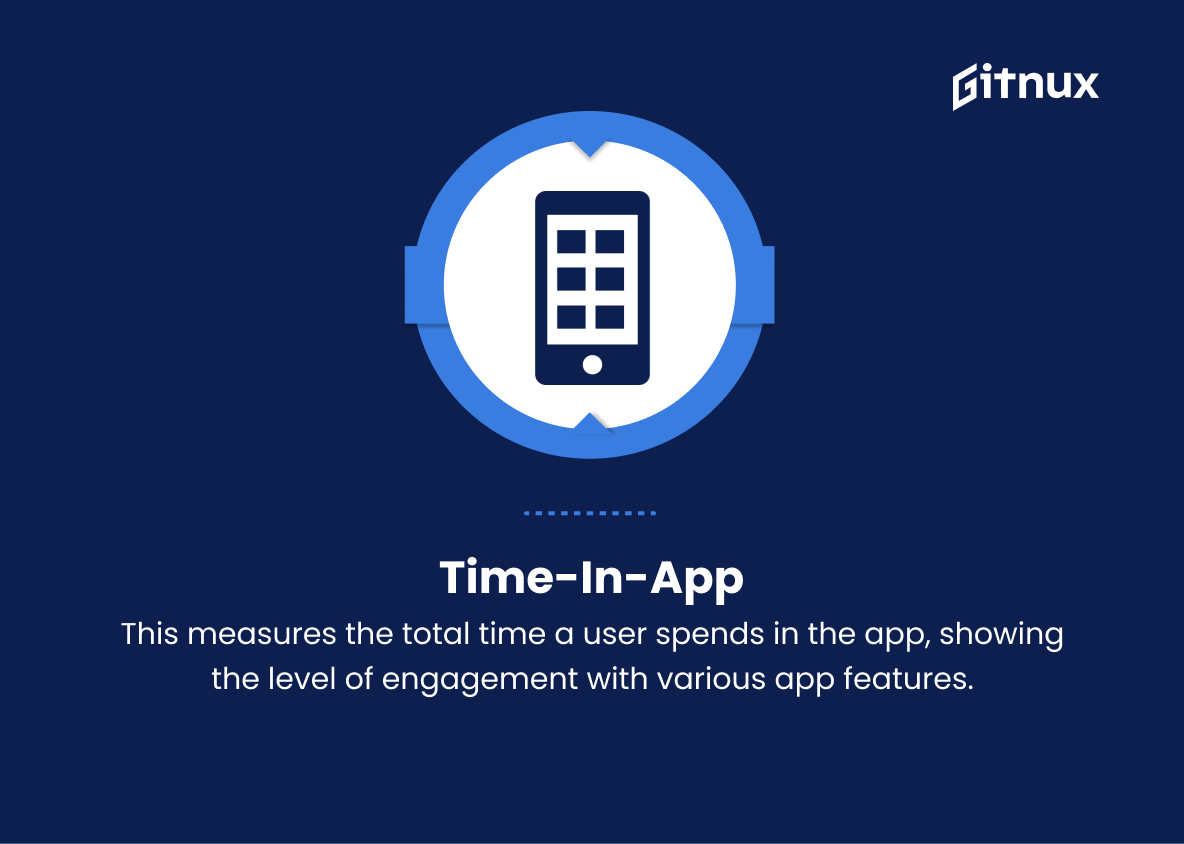
7. Time-In-App
This measures the total time a user spends in the app, showing the level of engagement with various app features.
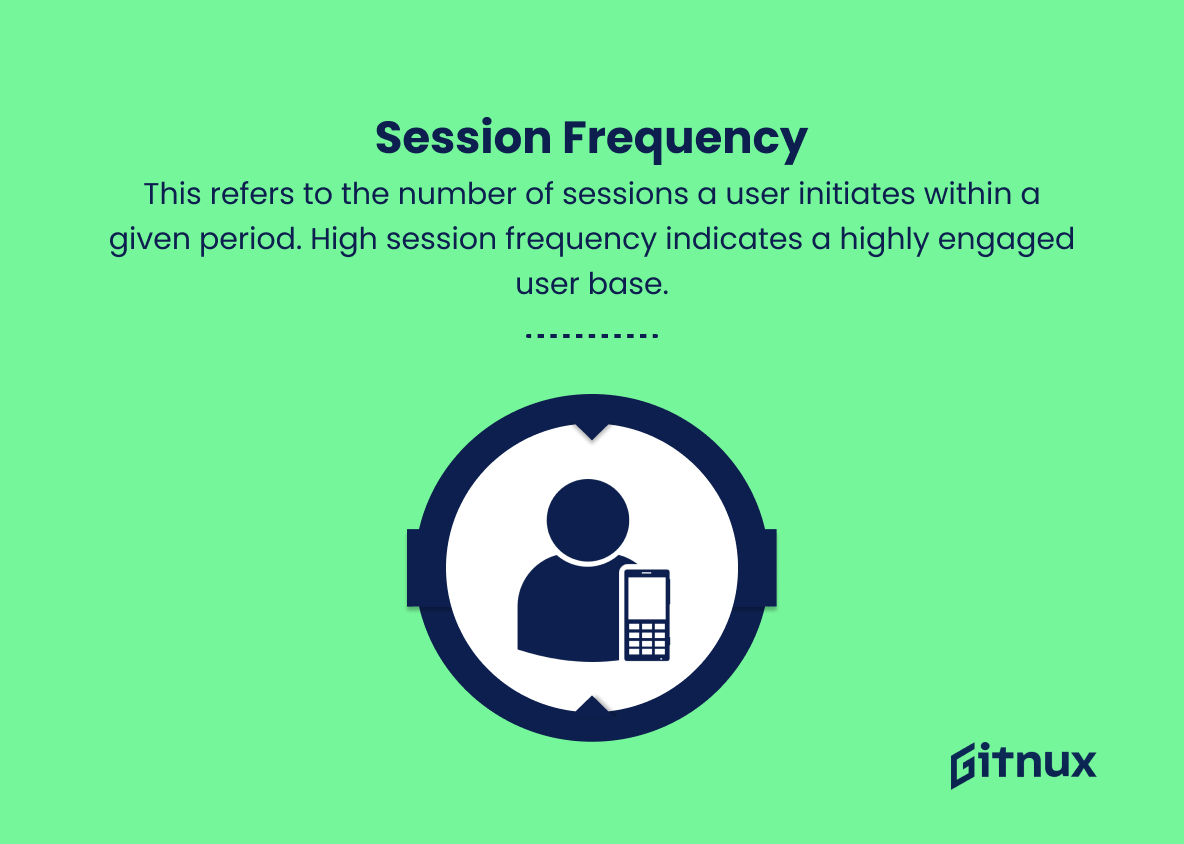
8. Session Frequency
This refers to the number of sessions a user initiates within a given period. High session frequency indicates a highly engaged user base.
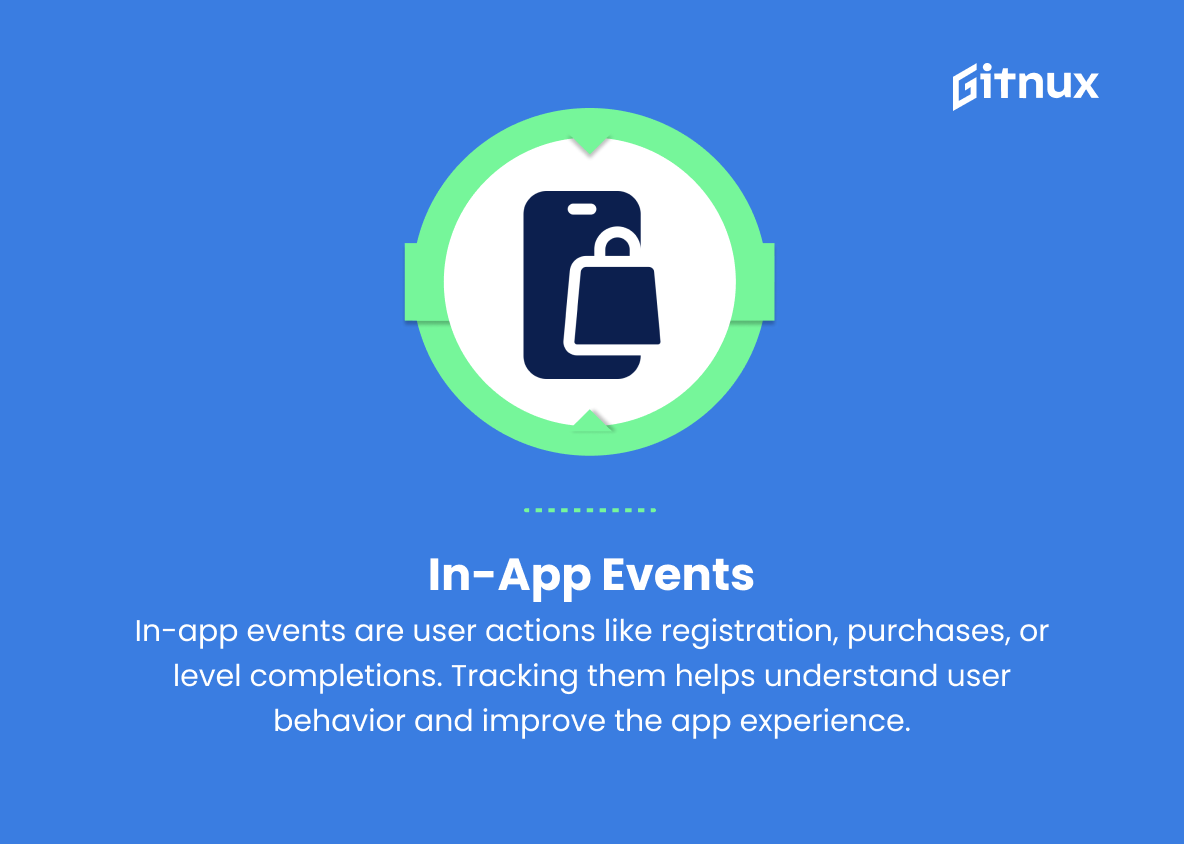
9. In-App Events
These are specific actions performed by the users within the app, such as registration, in-app purchases, or level completions in a game. Tracking these events helps in understanding user behavior and optimizing the app experience.
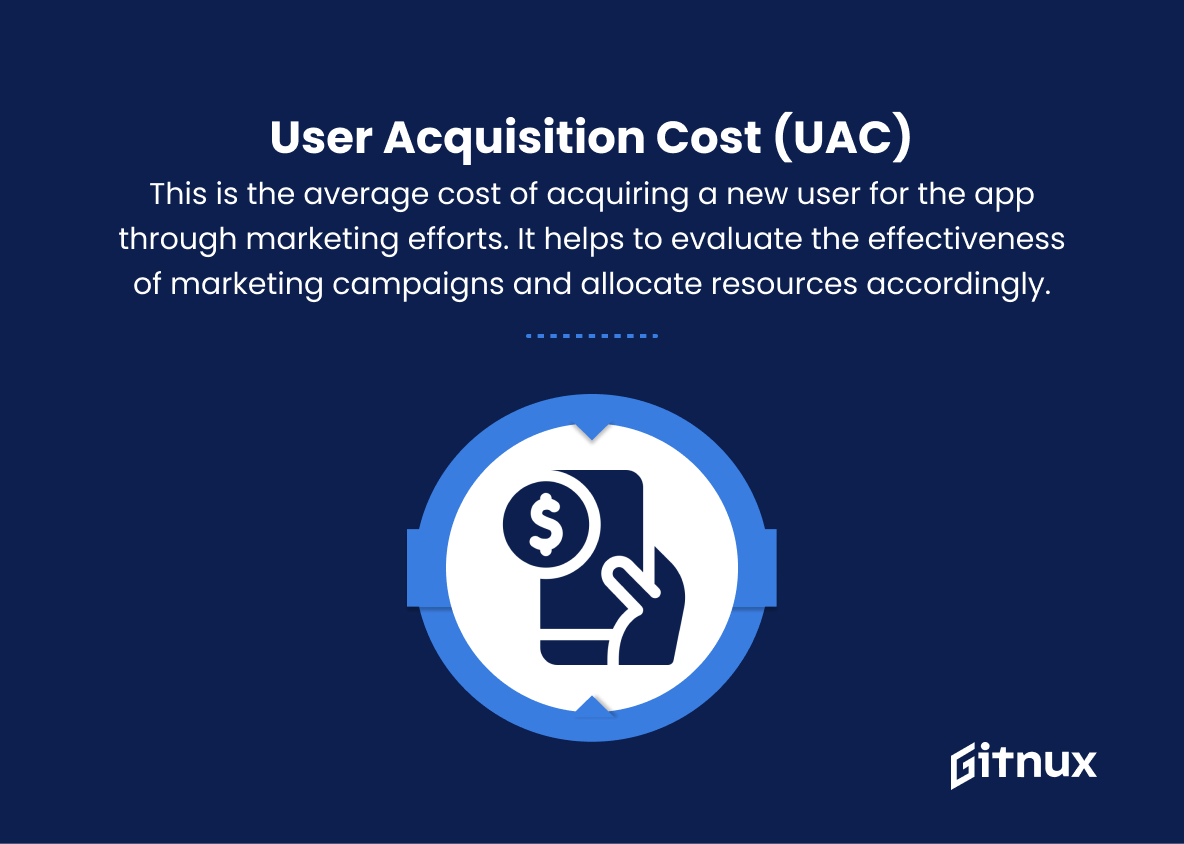
10. User Acquisition Cost (UAC)
This is the average cost of acquiring a new user for the app through marketing efforts. It helps to evaluate the effectiveness of marketing campaigns and allocate resources accordingly.
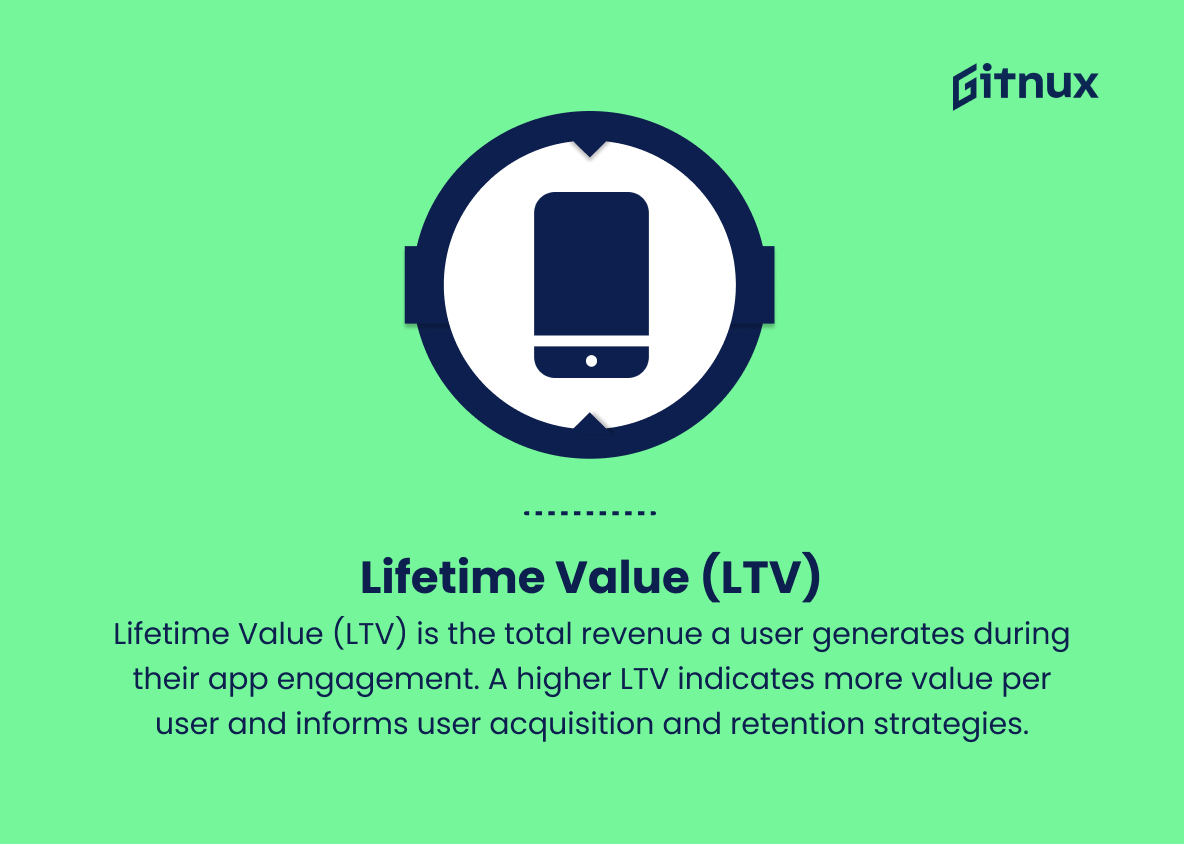
11. Lifetime Value (LTV)
This metric represents the total revenue generated from a user throughout their engagement with the app. A higher LTV signifies more value per user and enables better decision-making regarding user acquisition and retention strategies.
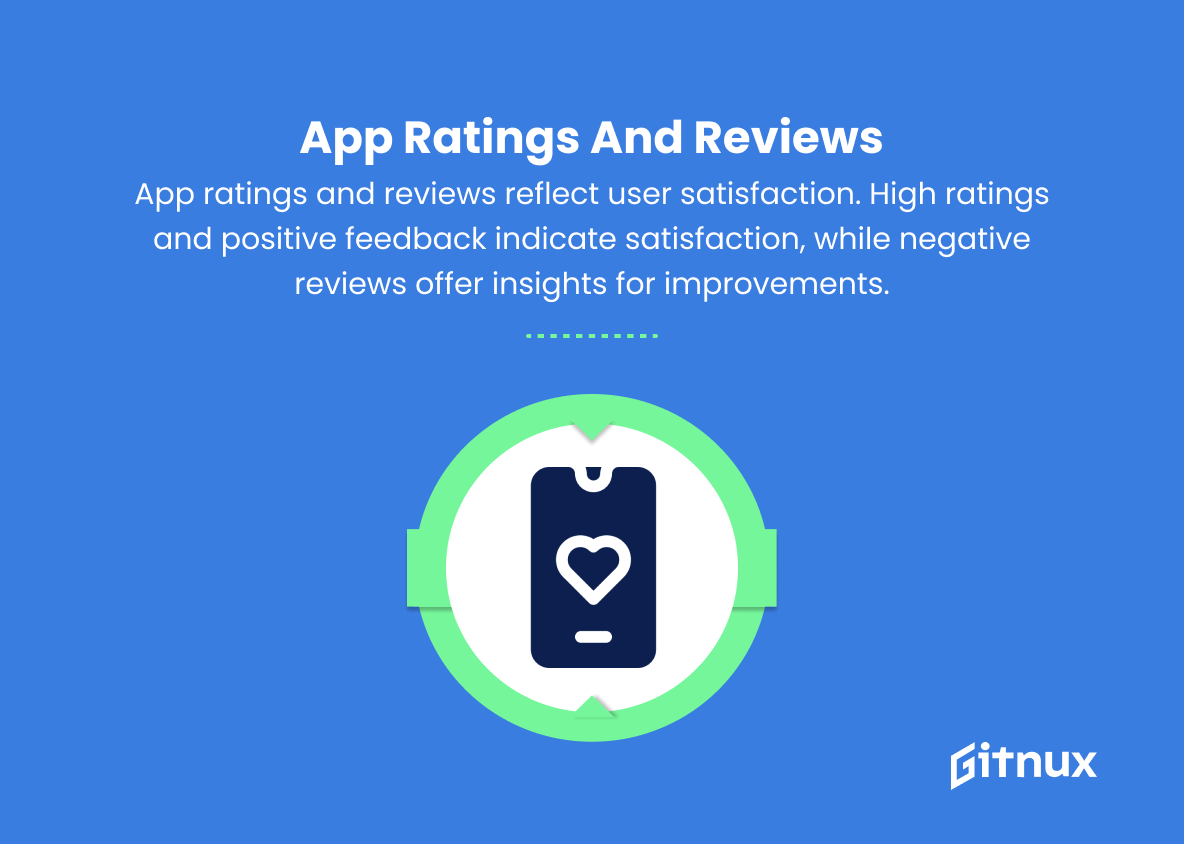
12. App Ratings and Reviews
These are the user’s feedback and rating scores for the app. High ratings and positive reviews indicate higher user satisfaction, while negative feedback can provide insights for app improvements.
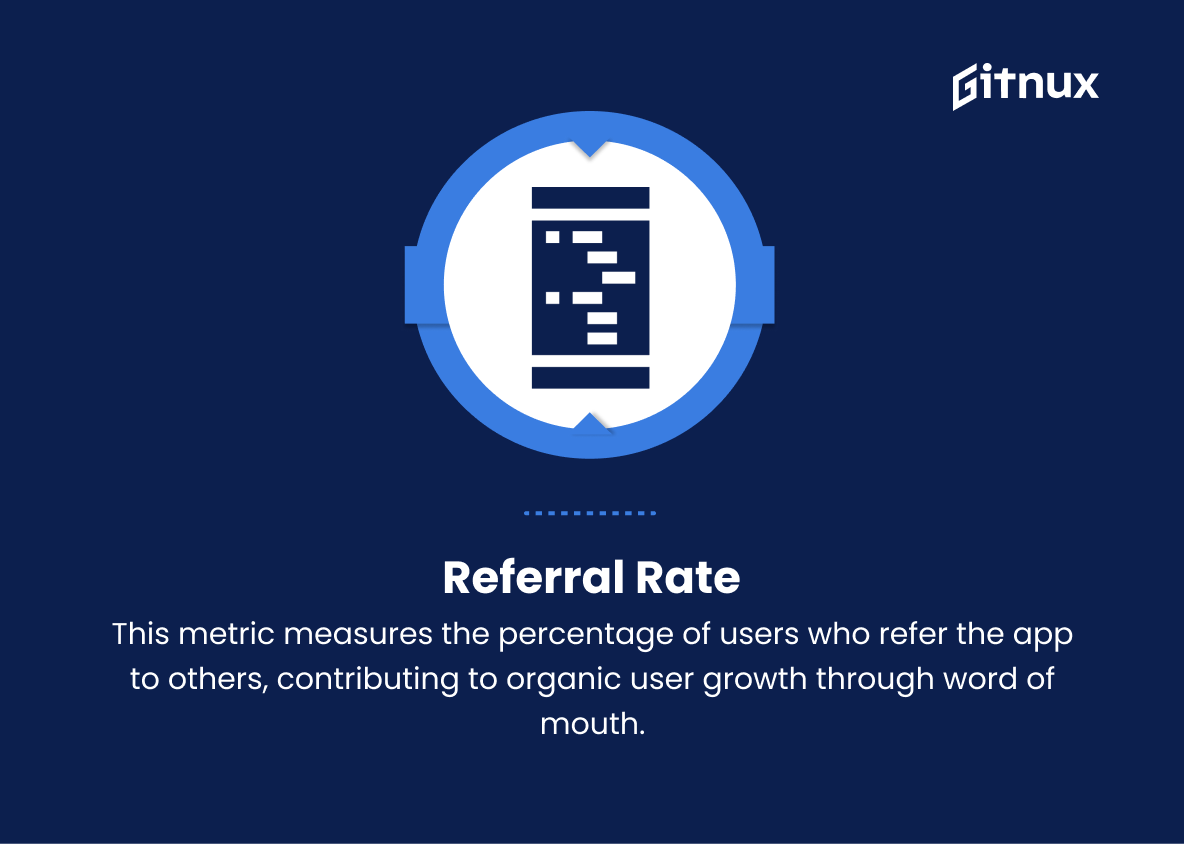
13. Referral Rate
This metric measures the percentage of users who refer the app to others, contributing to organic user growth through word of mouth.
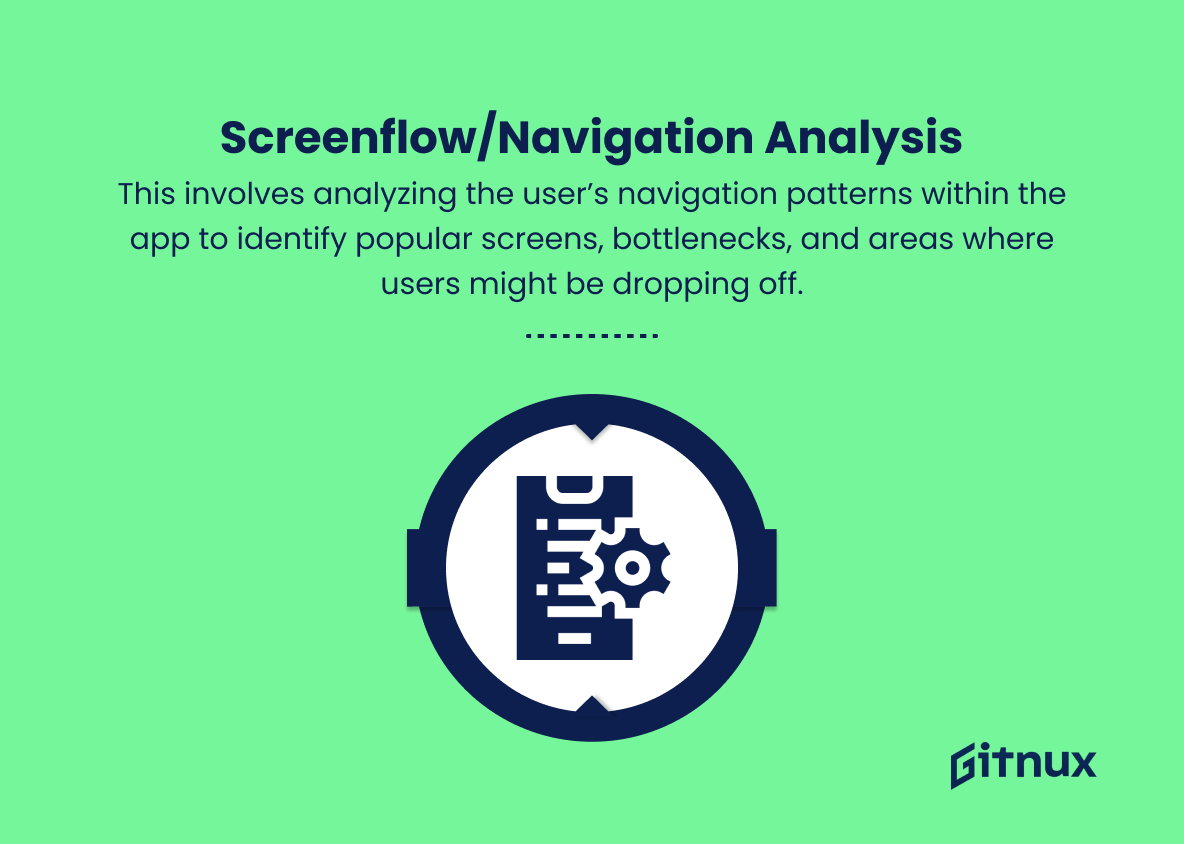
14. Screenflow/Navigation Analysis
This involves analyzing the user’s navigation patterns within the app to identify popular screens, bottlenecks, and areas where users might be dropping off.
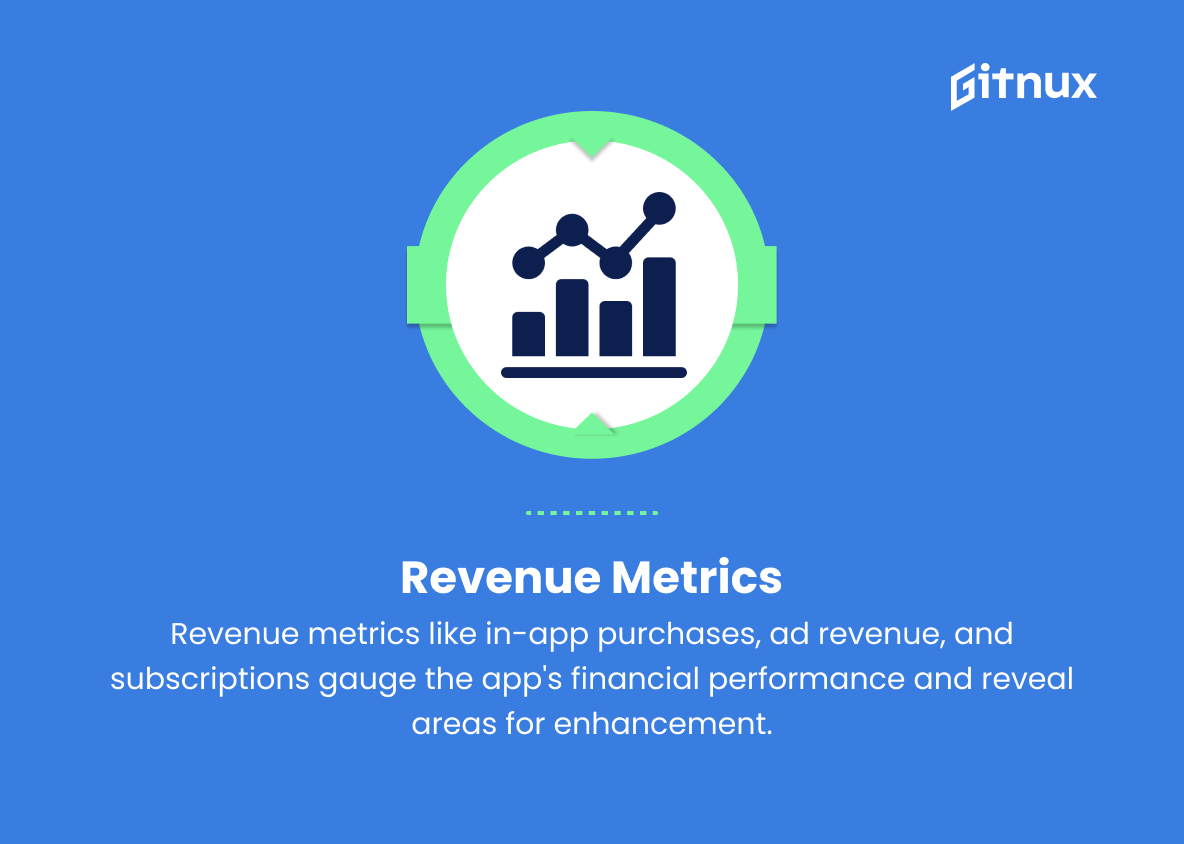
15. Revenue Metrics
Various revenue-related metrics, such as in-app purchase revenue, ad revenue, and subscription revenue, help measure the app’s overall financial success and identify areas for improvement.
Mobile App Engagement Metrics Explained
Mobile App Engagement Metrics are crucial for understanding user behavior, optimizing the app experience, and ensuring its overall success. Daily Active Users (DAU) and Monthly Active Users (MAU) provide insights into the app’s stickiness and long-term growth, while session length, stickiness ratio, churn rate, and retention rate help measure user engagement and satisfaction levels. Time-in-app, session frequency, in-app events, and screenflow/navigation analysis further illustrate user interactions and preferences within the app. User Acquisition Cost (UAC), Lifetime Value (LTV), and referral rate enable better decision-making for marketing and user acquisition efforts. Additionally, app ratings, reviews, and revenue metrics help gauge user satisfaction and the financial viability of the app. Together, these metrics offer a comprehensive view of an app’s performance, which can be invaluable for both developers and investors in determining the app’s potential and areas for improvement.
Conclusion
In summary, mobile app engagement metrics play a crucial role in the success of any mobile application. By monitoring and analyzing key metrics such as acquisition, activation, retention, referral, and revenue, developers and marketers can make informed decisions on app features, marketing strategies, and user experience. Regularly tracking these performance indicators can lead to optimization and growth in both the short and long term.
To stay ahead of the competition and ensure continued user satisfaction, it’s important to continuously pursue improvements in the mobile app landscape. Always remember, a well-engaged user base is the foundation for a thriving mobile application.
