In today’s fast-paced and competitive software development landscape, Continuous Integration (CI) and Continuous Deployment (CD) have emerged as crucial practices for maintaining high-quality software products. These modern methodologies enable teams to streamline the development process, increase efficiency, and foster seamless collaboration among cross-functional team members. As organizations invest more heavily in their CI/CD pipelines, the need for impactful metrics to measure the success and effectiveness of their practices has become increasingly important.
In this blog post, we will delve into the world of CI/CD metrics, exploring the benefits, challenges, and key performance indicators that will help practitioners gain valuable insights and continuously improve their processes. Join us as we unveil the power of data-driven decision-making in the realm of software delivery and uncover how crucial these metrics are to the overall success of your development strategy.
CI/CD Metrics You Should Know
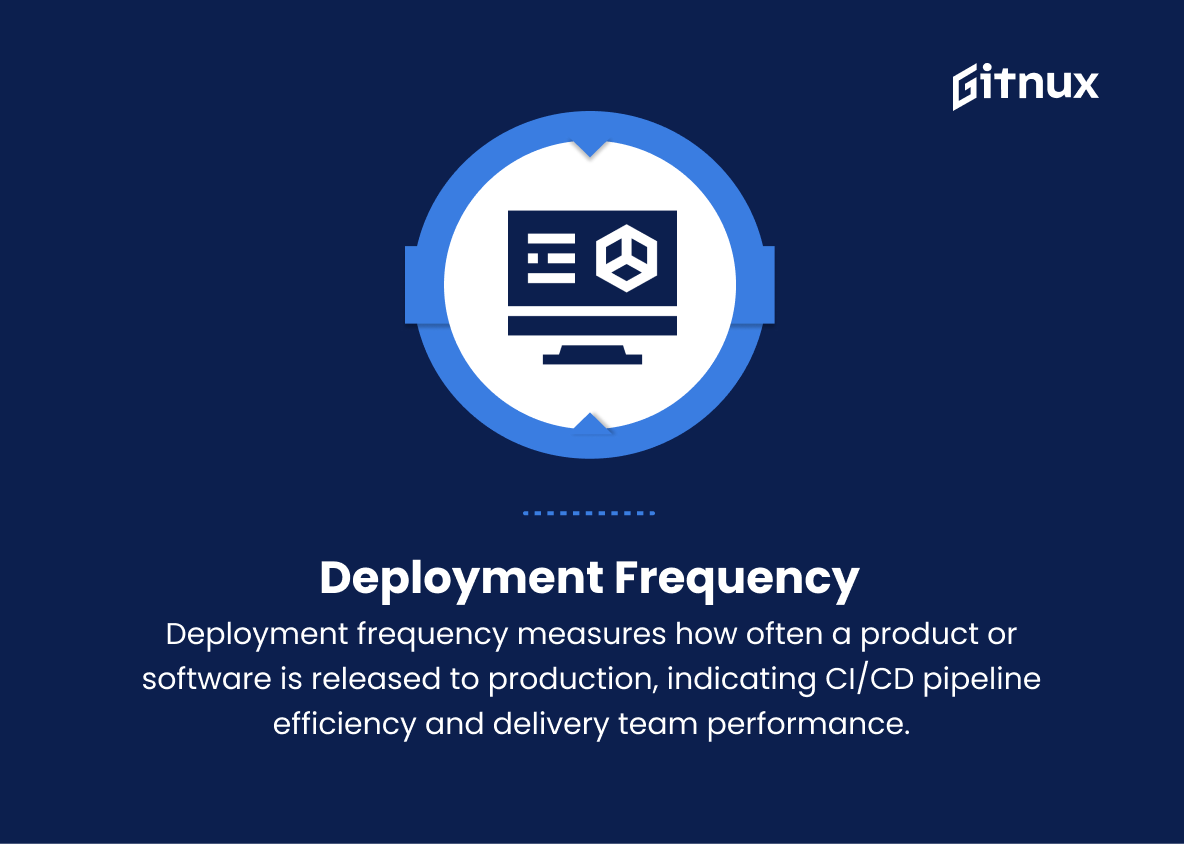
1. Deployment Frequency
The number of times a product or software is deployed to production per unit of time (e.g., daily, weekly, monthly). It measures the efficiency of the CI/CD pipeline and the team’s ability to deliver.
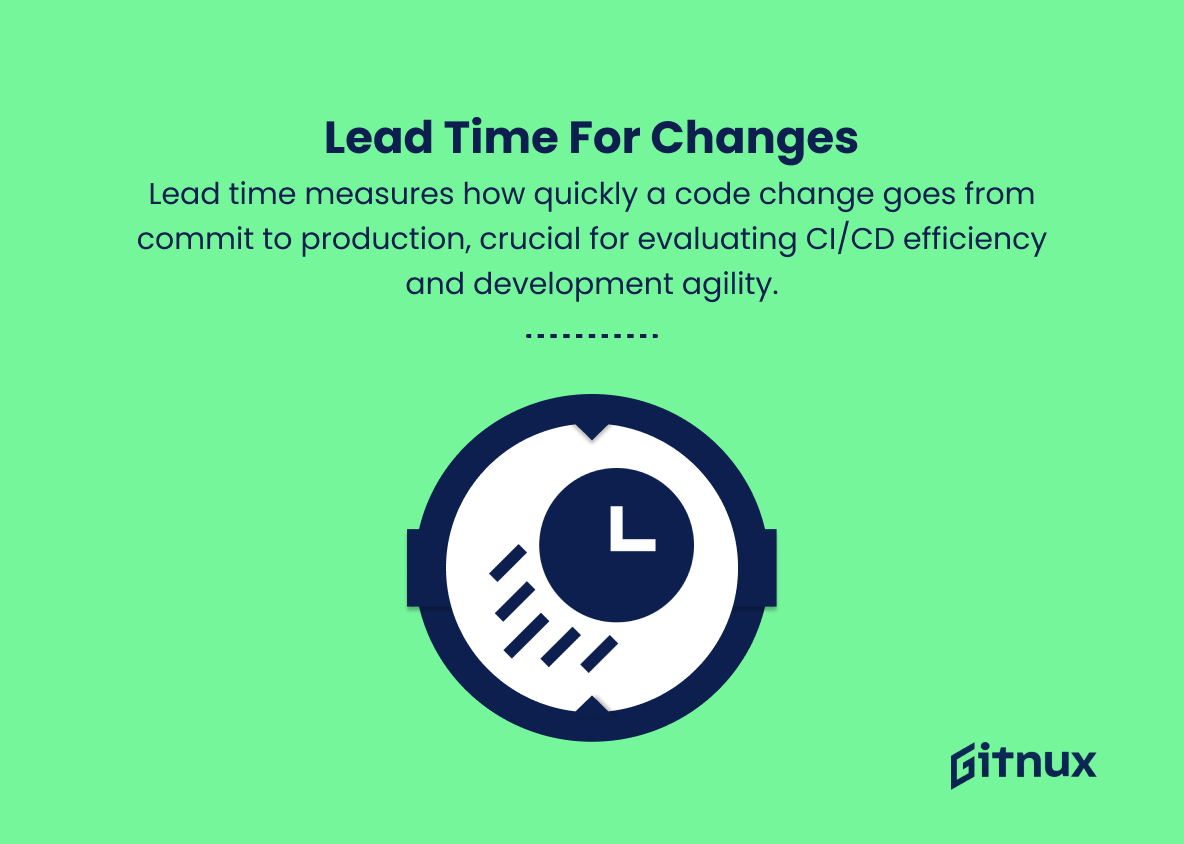
2. Lead Time for Changes
The time taken for a code change to reach production from the point it was committed. This is a crucial metric for assessing the efficiency of the CI/CD pipeline and the agility of the development process.
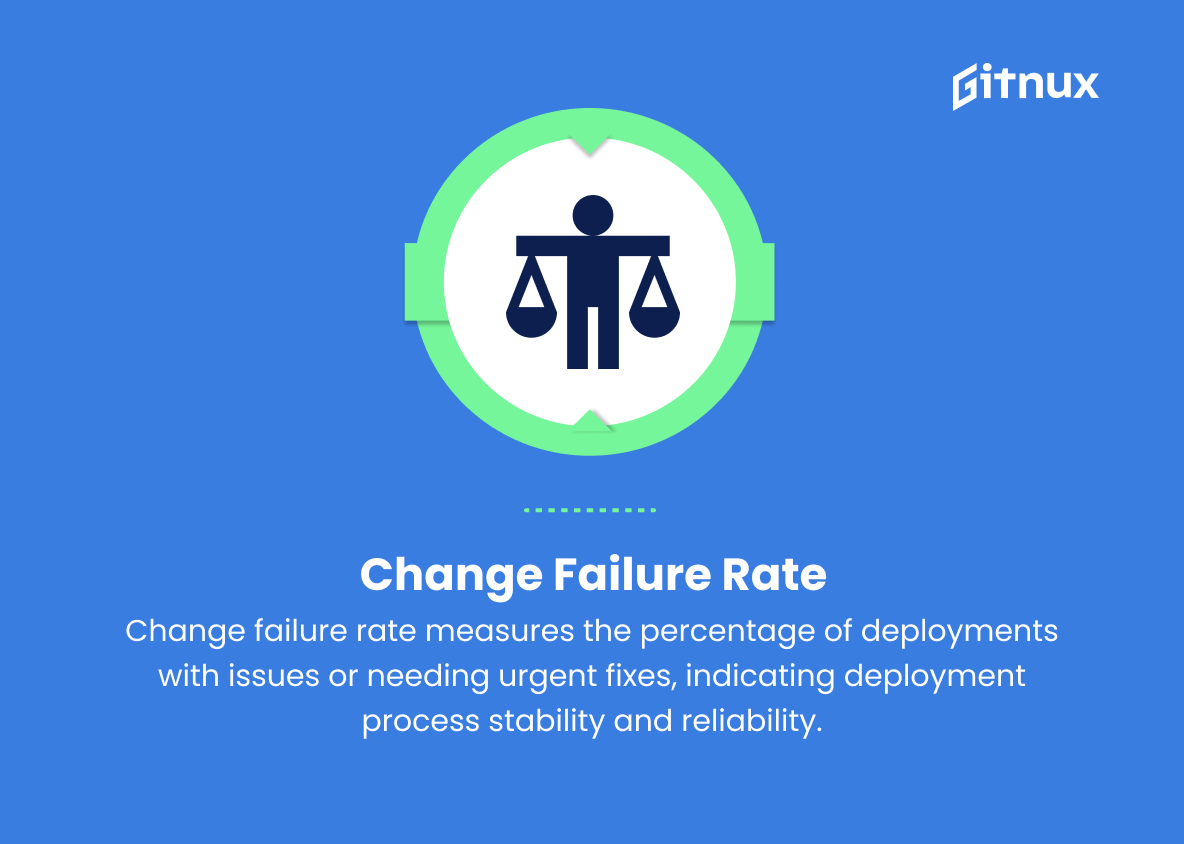
3. Change Failure Rate
The percentage of deployments that result in failures or require urgent remediation, such as hotfixes or rollbacks, after deployment. A lower change failure rate indicates a more stable and reliable deployment process.
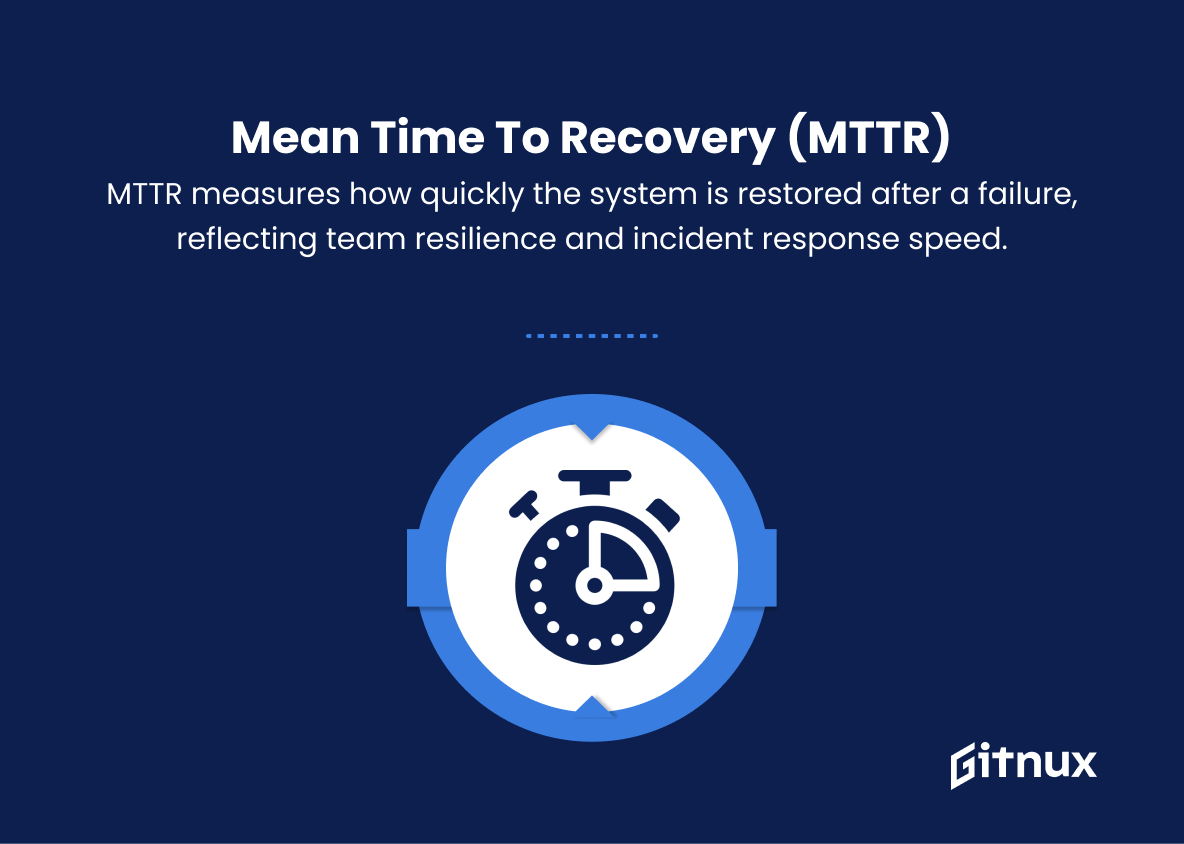
4. Mean Time to Recovery (MTTR)
The average time required to restore the system after an incident or failure. A shorter MTTR reflects a more resilient and responsive development team and incident management process.
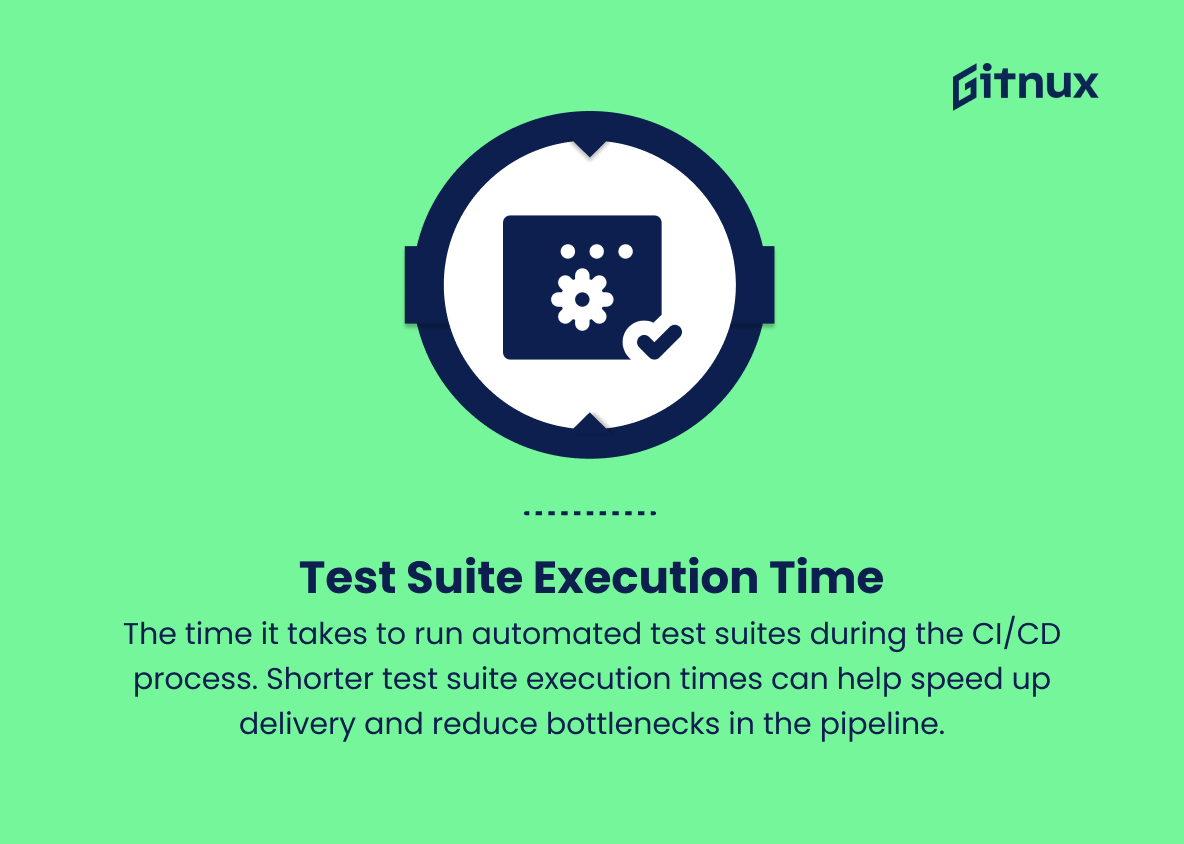
5. Test Suite Execution Time
The time it takes to run automated test suites during the CI/CD process. Shorter test suite execution times can help speed up delivery and reduce bottlenecks in the pipeline.
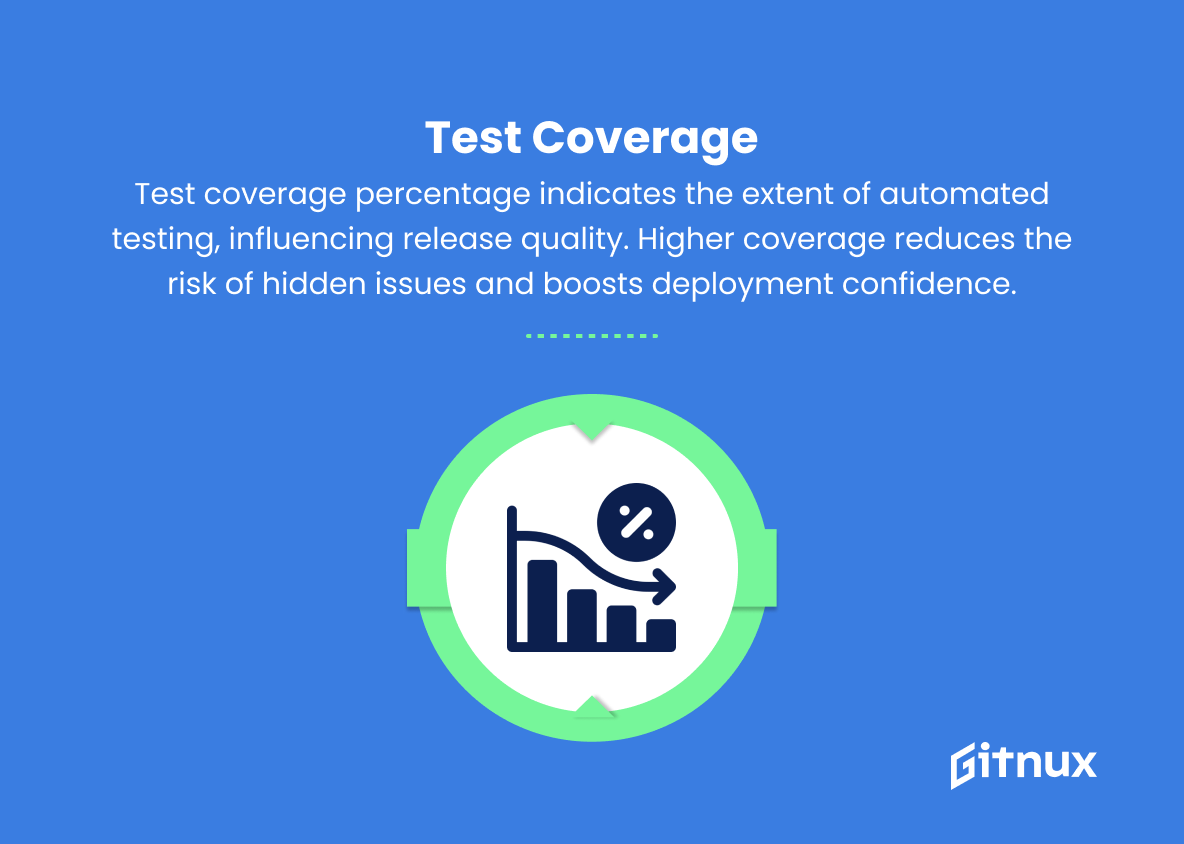
6. Test Coverage
The percentage of code that is covered by automated tests, indicating the thoroughness of testing and potential quality of the release. Higher test coverage reduces the risk of undetected issues and increases confidence in the deployment process.
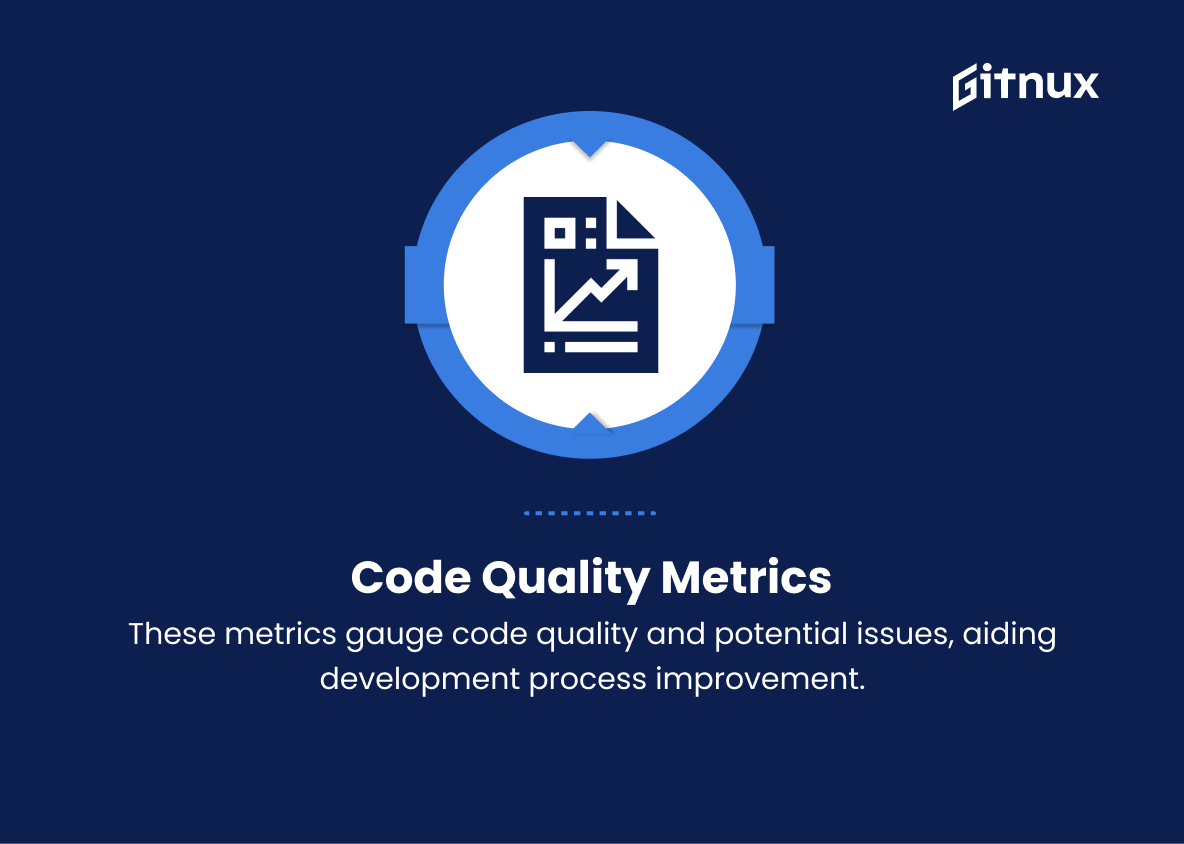
7. Code Quality Metrics
These are metrics related to the maintainability, complexity, and potential bugs in the codebase, such as code churn, cyclomatic complexity, and technical debt. Monitoring these metrics can help identify potential areas of improvement in the development process.
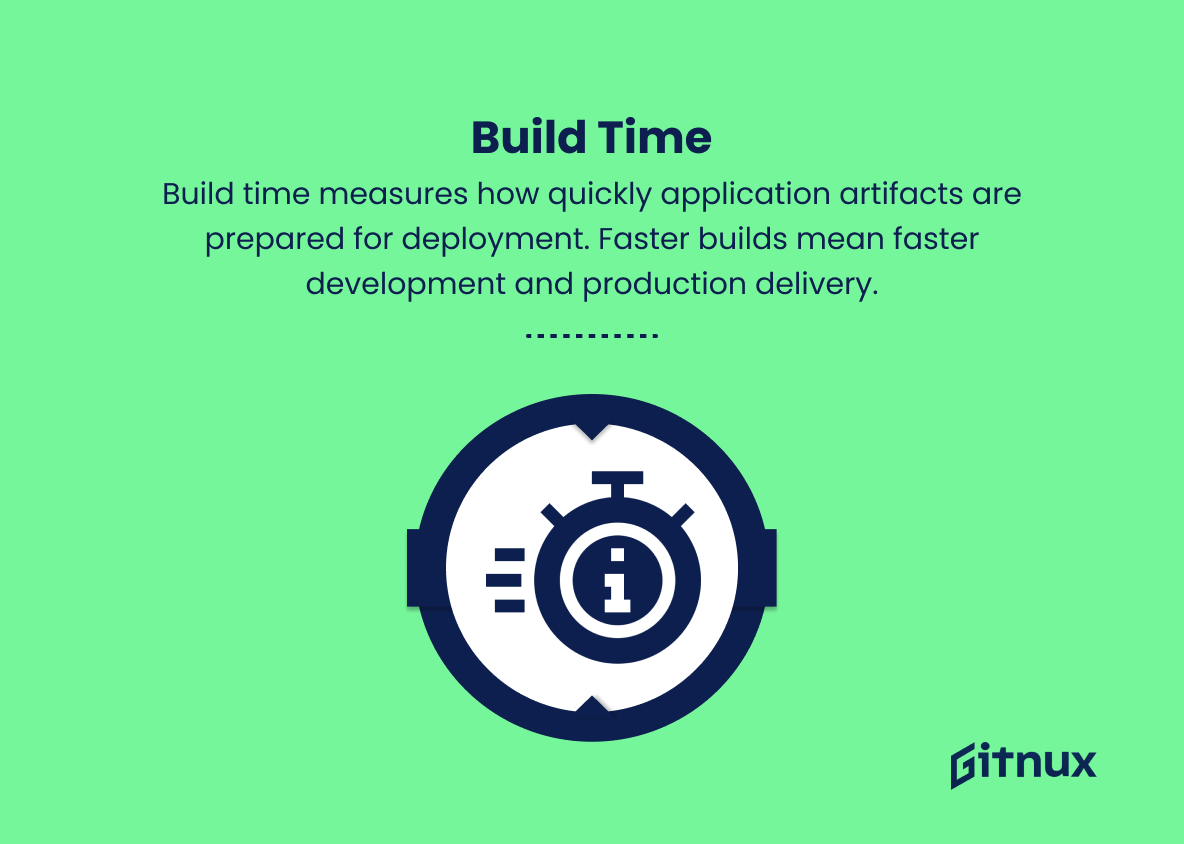
8. Build Time
The duration it takes to compile, package, and prepare the application artifacts for deployment. Shorter build times contribute to faster development cycles and quicker delivery to production.
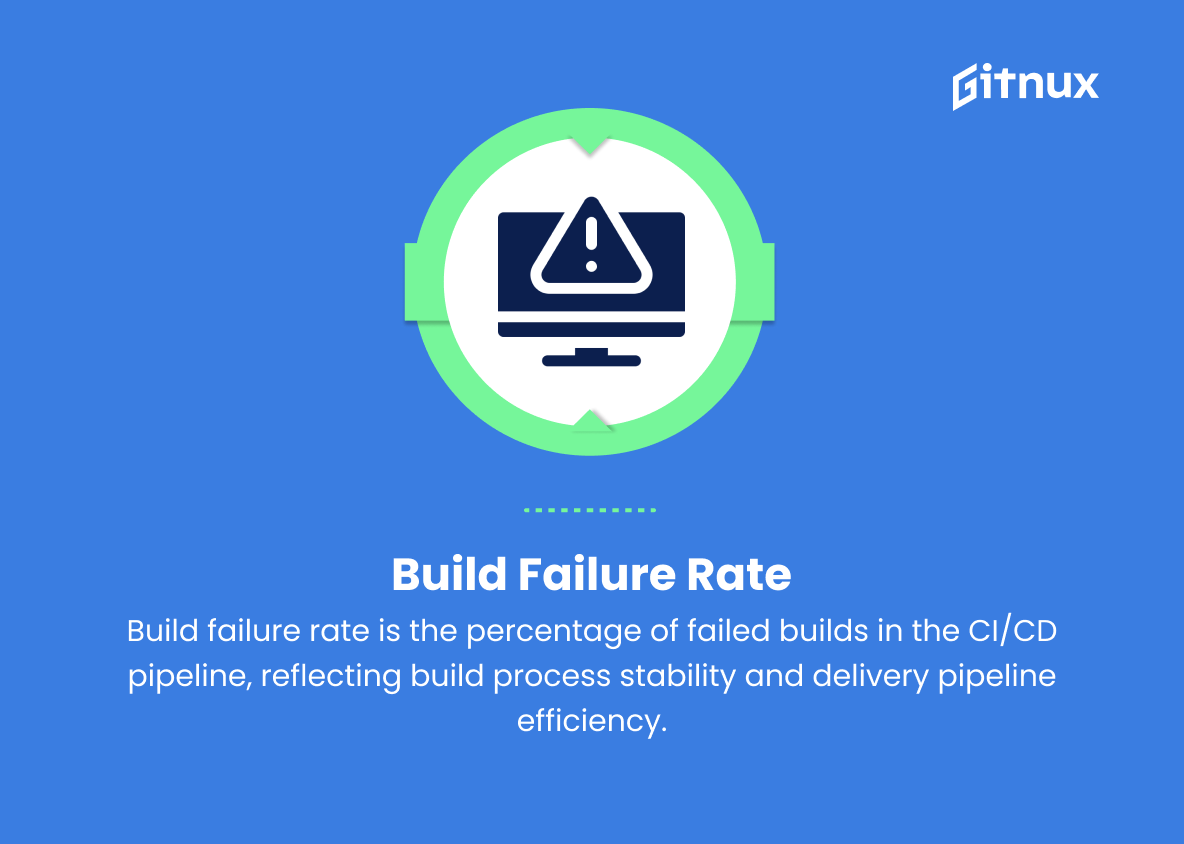
9. Build Failure Rate
The percentage of builds that fail in the CI/CD pipeline. A lower build failure rate indicates a more stable and reliable build process, leading to fewer interruptions and delays in the delivery pipeline.
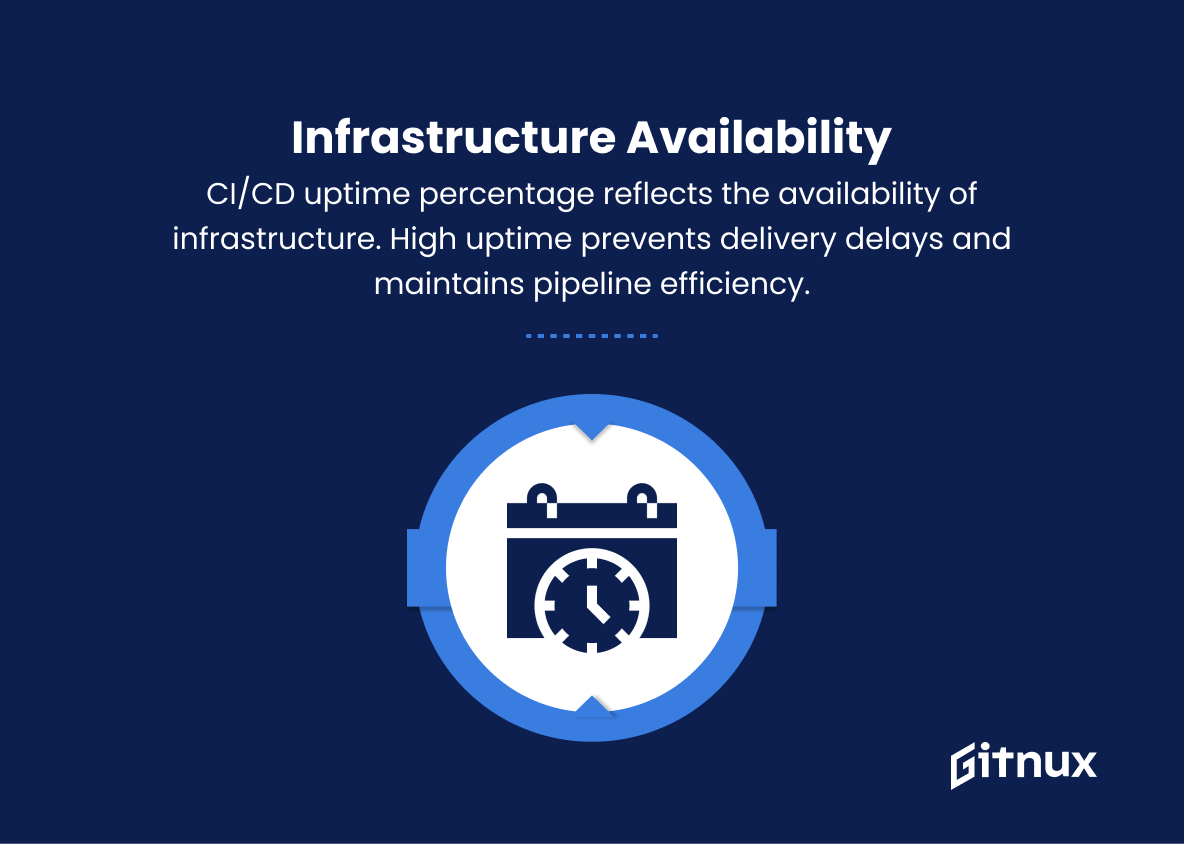
10. Infrastructure Availability
The percentage of time the CI/CD infrastructure is operational and available for use. Ensuring high availability helps prevent delays in software delivery and maintains the efficiency of the pipeline.
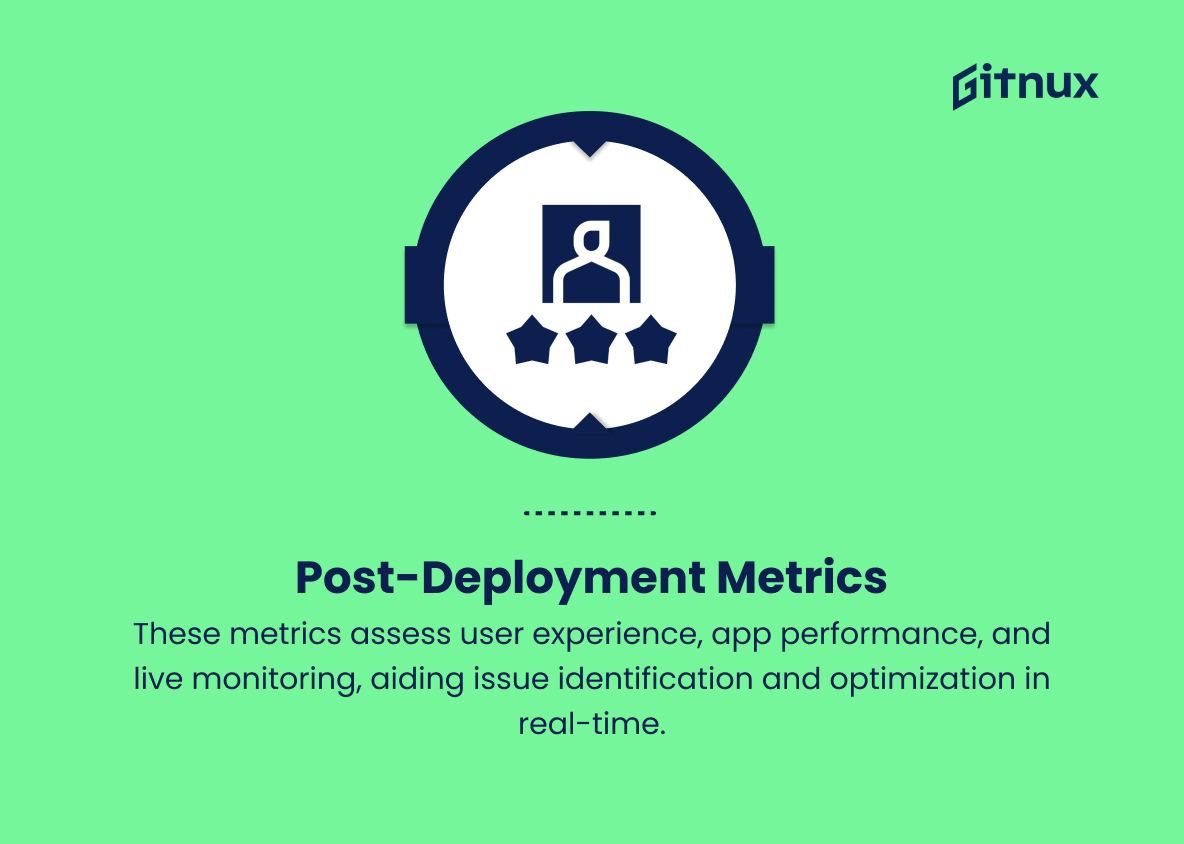
11. Post-deployment Metrics
These are metrics related to end-user experience, application performance, and real-time monitoring of the deployed application, such as error rates, response times, resource utilization, and customer satisfaction. Tracking these metrics can help identify issues and areas for optimization in the live environment.
CI/CD Metrics Explained
Deployment Frequency is a crucial CI/CD metric that measures the efficiency of the pipeline and the team’s ability to deliver software consistently. Alongside, the Lead Time for Changes helps in assessing the overall agility of the development process. A lower Change Failure Rate signifies a more stable deployment process, whereas a shorter Mean Time to Recovery illustrates the development team’s ability to manage incidents effectively. Test Suite Execution Time and Test Coverage are critical in maintaining high-quality software, as they ensure sufficient testing and identification of potential issues.
Code Quality Metrics and Build Time provide insights into the maintainability of the codebase and the speed of development cycles, while a lower Build Failure Rate demonstrates stability in the build process. Infrastructure Availability plays a vital role in preventing delays and maintaining pipeline efficiency. Lastly, Post-deployment Metrics, such as error rates and customer satisfaction, enable teams to identify areas of optimization and maintain a reliable end-user experience. Overall, these CI/CD metrics are essential for driving continuous improvement and delivering high-quality software.
Conclusion
In conclusion, CI/CD metrics play a critical role in the success of any software development project. By closely monitoring these metrics, development teams can identify bottlenecks, improve efficiency, maintain a high level of code quality, and ensure faster time to market.
Implementing a comprehensive approach to tracking and optimizing these metrics can have a significant impact on the overall performance of a software development team. Undeniably, embracing CI/CD metrics as a part of the development process is a strategic move towards ensuring a streamlined, cost-effective, and high-quality software delivery.
