
In today’s rapidly evolving healthcare landscape, understanding the financial metrics that drive the industry is not only necessary, but essential for the sustainability and growth of healthcare organizations. As healthcare costs continue to rise, and patient populations become more diverse, capturing the underpinning dynamics of healthcare finance is crucial for providers, payers, and policymakers alike.
In this blog post, we will delve into the core healthcare financial metrics that not only shape the decision-making process but also inform strategic initiatives to optimize patient care, minimize financial risks, and promote long-term financial stability. By closely examining these key indicators, we can gain invaluable insights to inform data-driven strategies, identify improvement areas, and ultimately, contribute to the betterment of global healthcare systems.
Healthcare Financial Metrics You Should Know
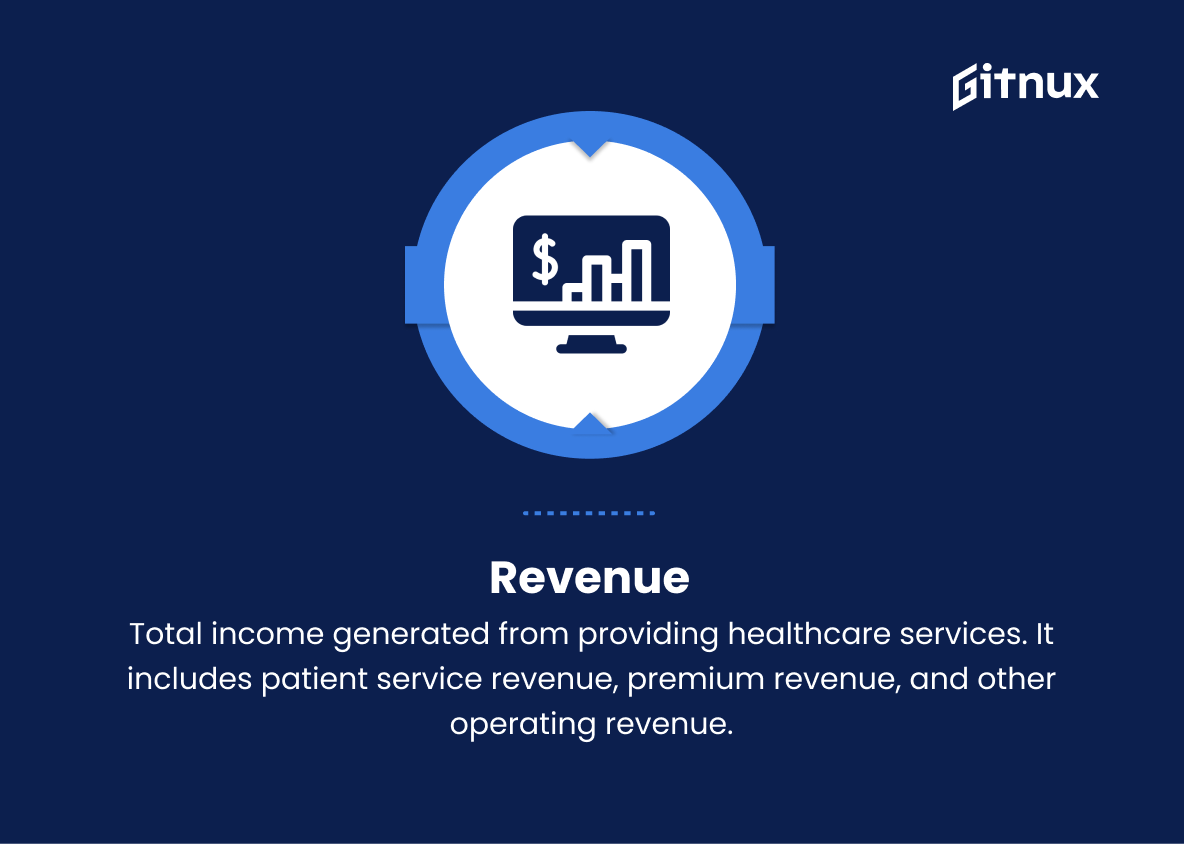
1. Revenue
Total income generated from providing healthcare services. It includes patient service revenue, premium revenue, and other operating revenue.
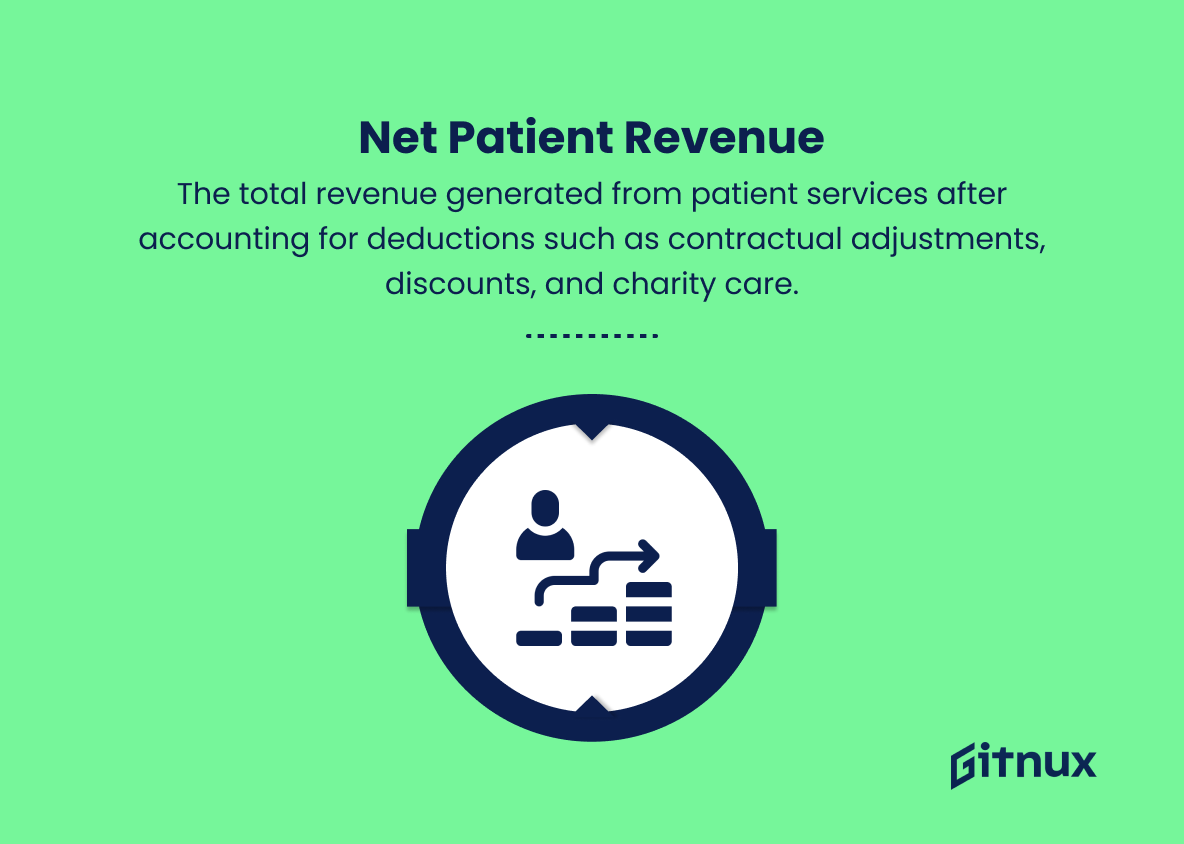
2. Net Patient Revenue (NPR)
The total revenue generated from patient services after accounting for deductions such as contractual adjustments, discounts, and charity care.
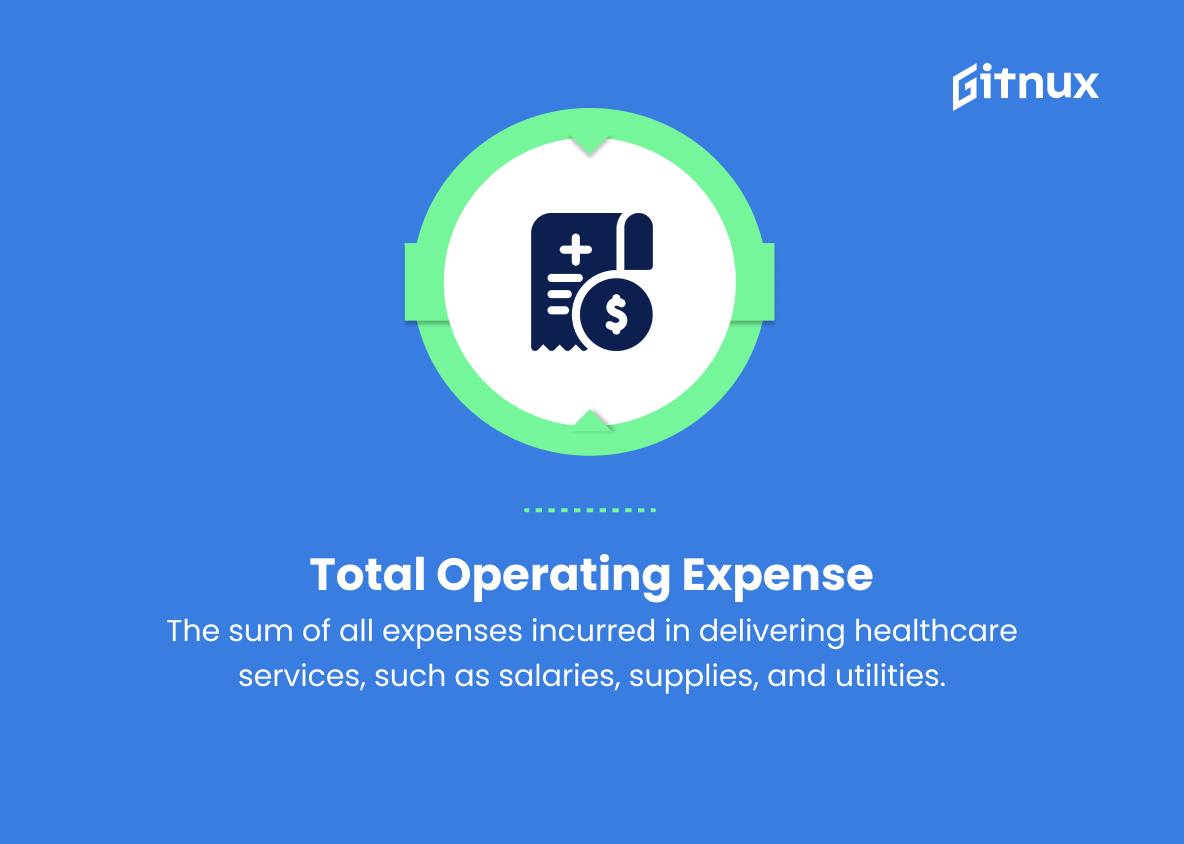
3. Total Operating Expense (TOE)
The sum of all expenses incurred in delivering healthcare services, such as salaries, supplies, and utilities.
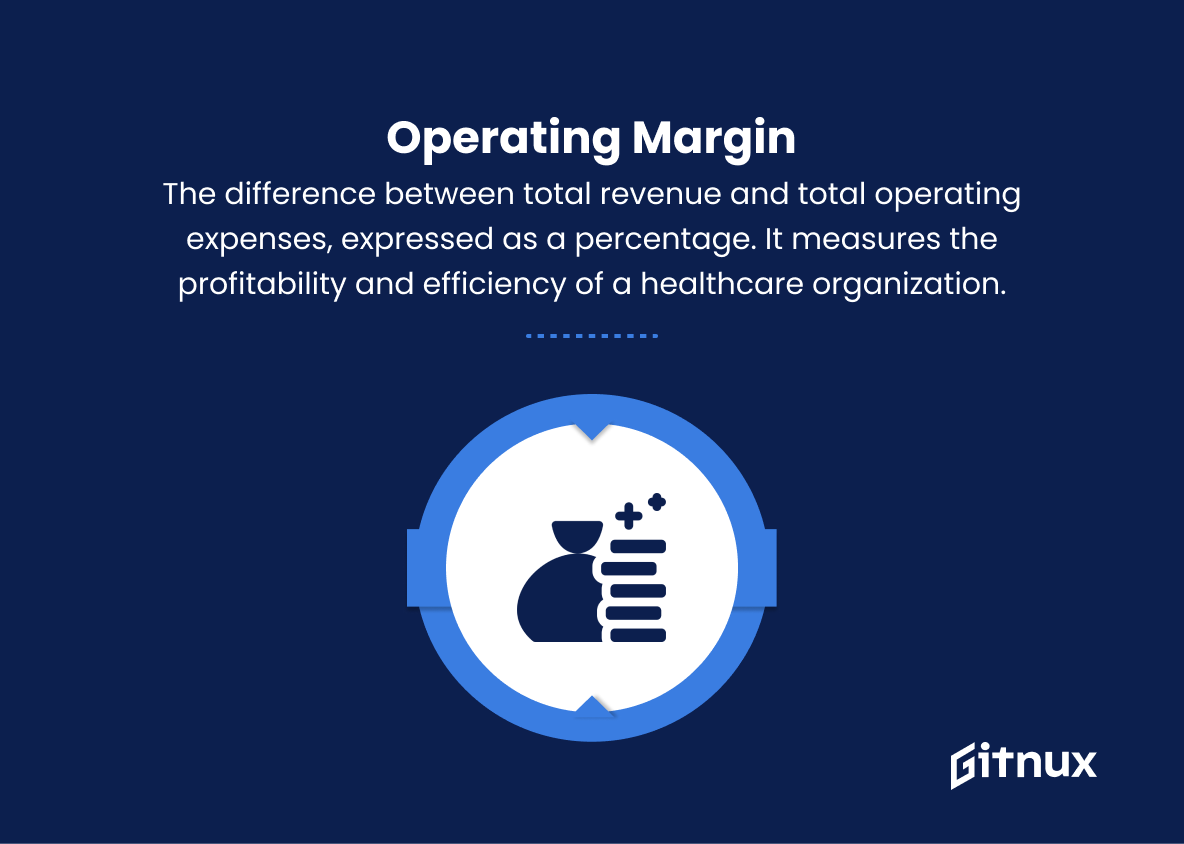
4. Operating Margin
The difference between total revenue and total operating expenses, expressed as a percentage. It measures the profitability and efficiency of a healthcare organization.
5. Net Income
The amount of money a healthcare organization has left after accounting for all expenses and taxes.
6. Cost per Case
The average cost for treating a patient, calculated by dividing total operating expenses by the number of cases or patients treated.
7. Days in Accounts Receivable (DAR)
The average number of days it takes for a healthcare organization to collect payment for services rendered.
8. Debt-to-Equity Ratio
A solvency ratio calculated by dividing a healthcare organization’s total debt by its total equity. It measures the organization’s ability to meet its long-term debt obligations.
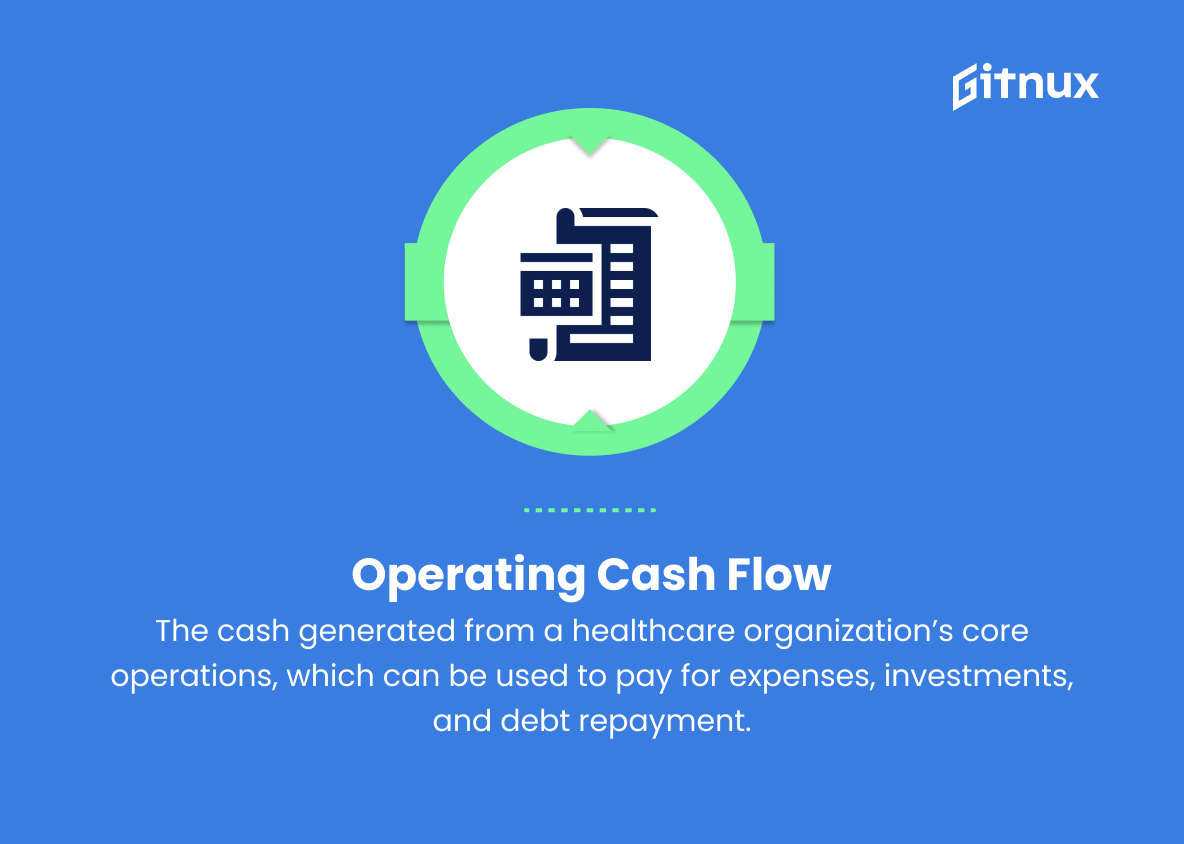
9. Operating Cash Flow (OCF)
The cash generated from a healthcare organization’s core operations, which can be used to pay for expenses, investments, and debt repayment.
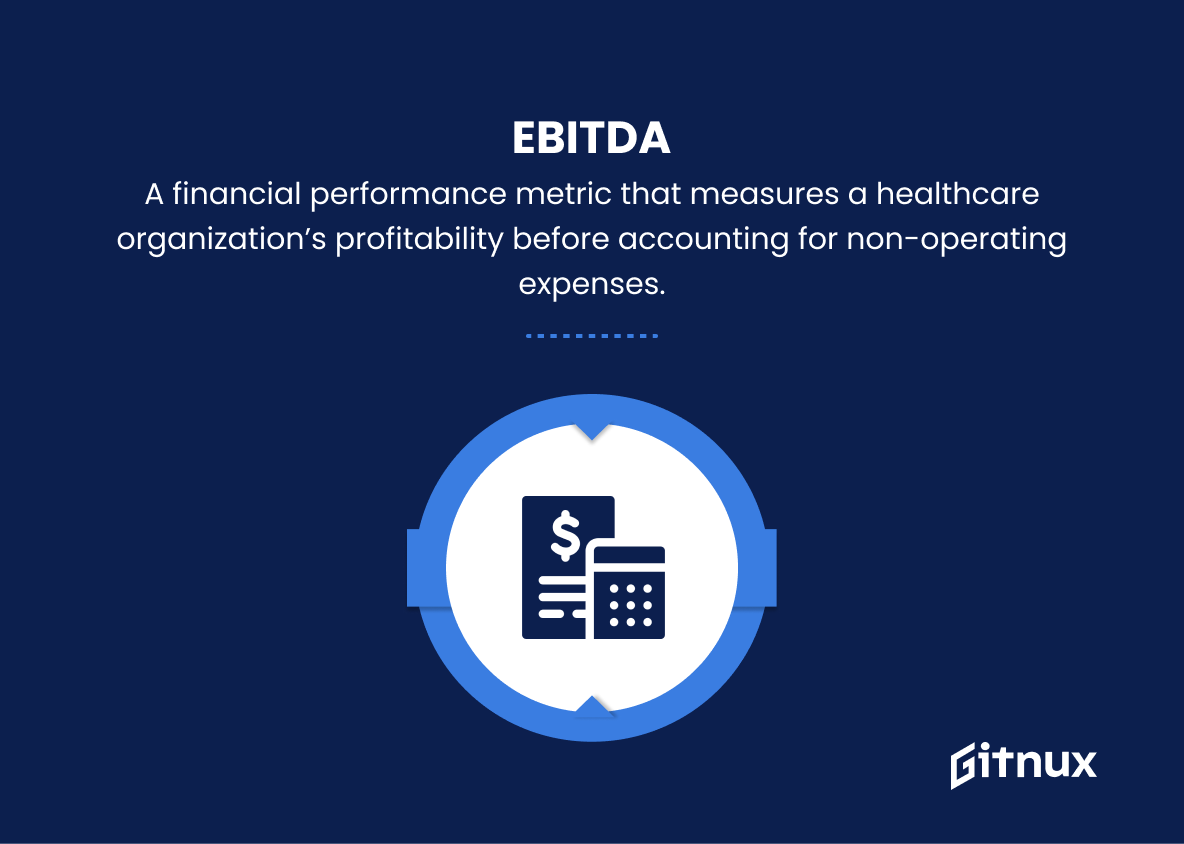
10. Earnings Before Interest, Taxes, Depreciation, and Amortization (EBITDA)
A financial performance metric that measures a healthcare organization’s profitability before accounting for non-operating expenses.
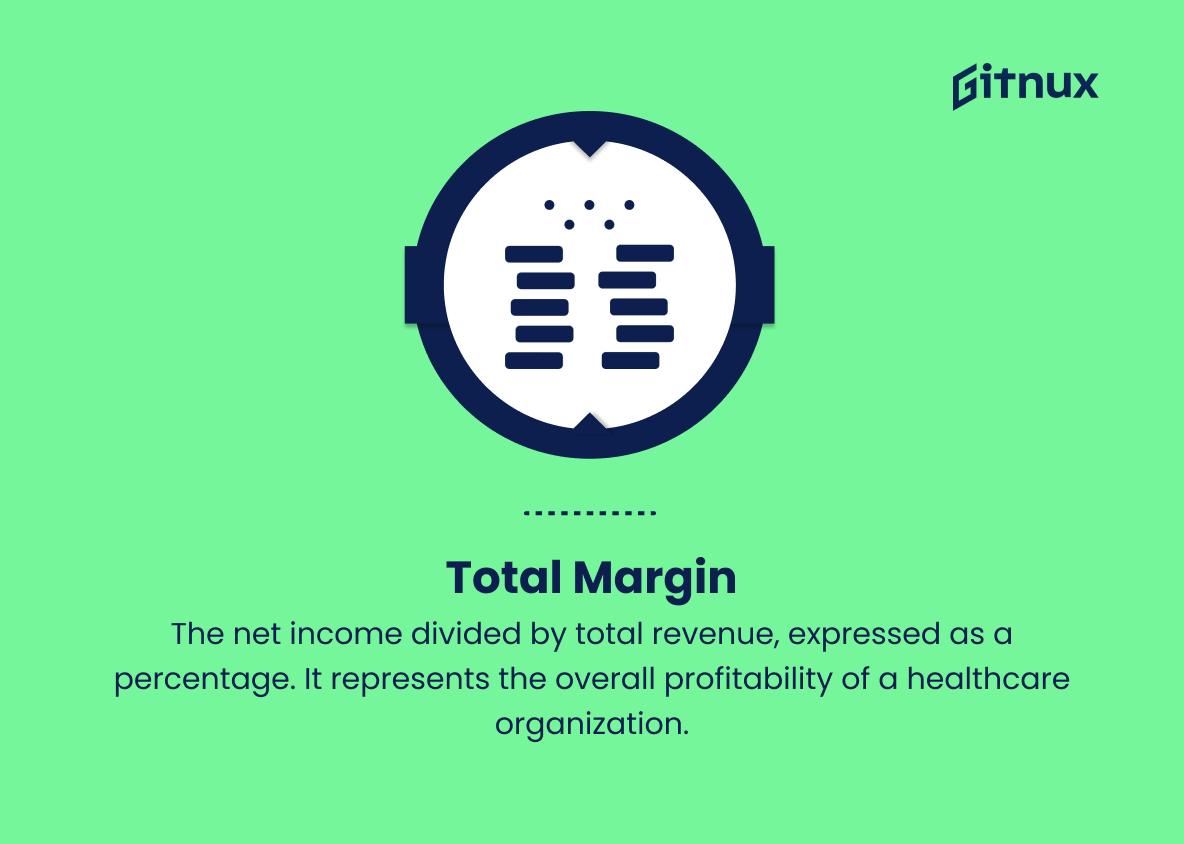
11. Total Margin
The net income divided by total revenue, expressed as a percentage. It represents the overall profitability of a healthcare organization.
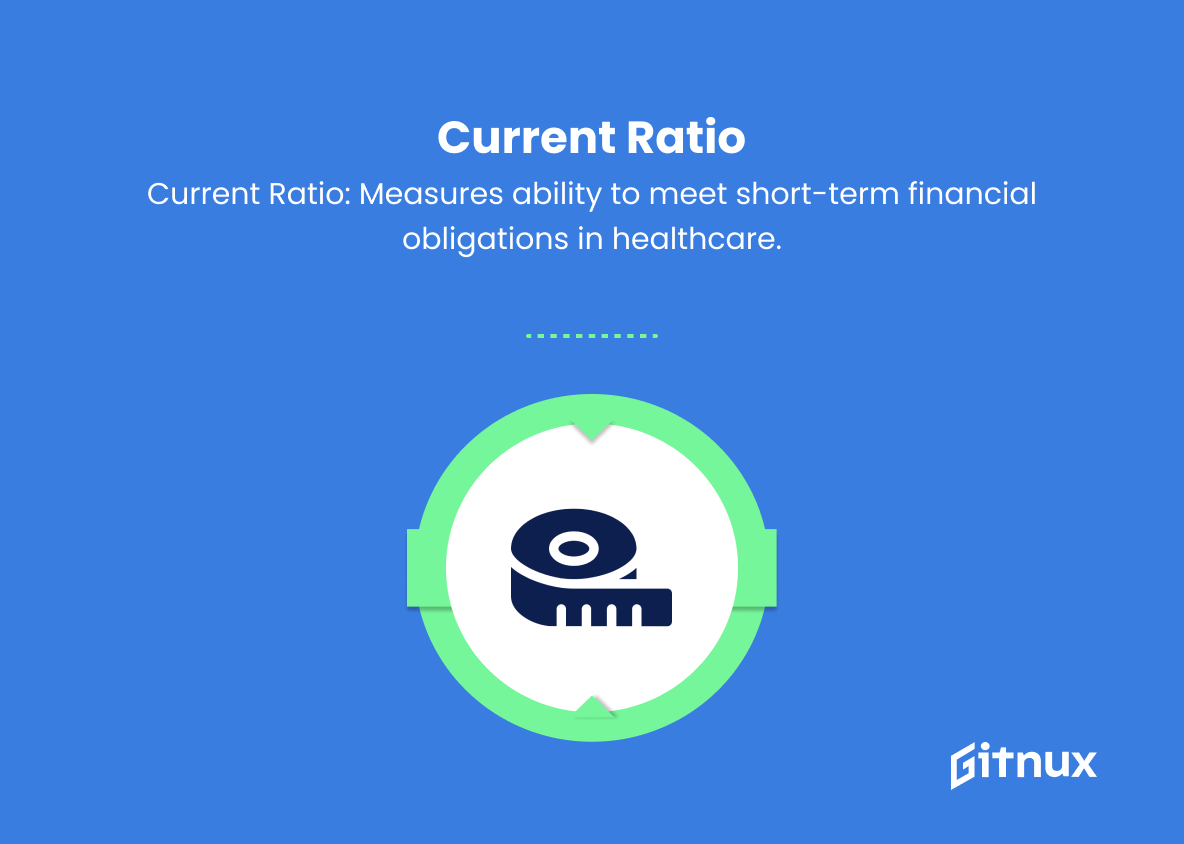
12. Current Ratio
A liquidity ratio calculated by dividing a healthcare organization’s current assets by its current liabilities. It indicates the organization’s ability to meet its short-term financial obligations.
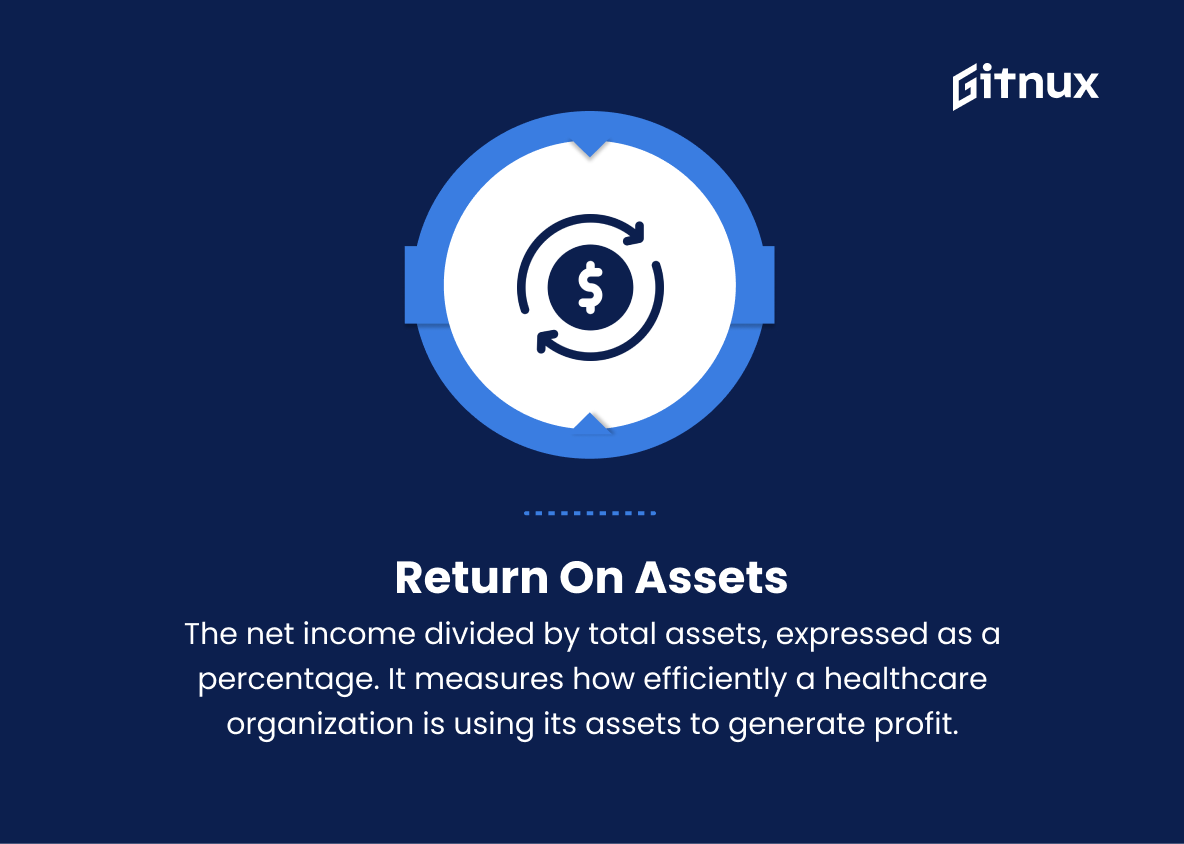
13. Return on Assets (ROA)
The net income divided by total assets, expressed as a percentage. It measures how efficiently a healthcare organization is using its assets to generate profit.
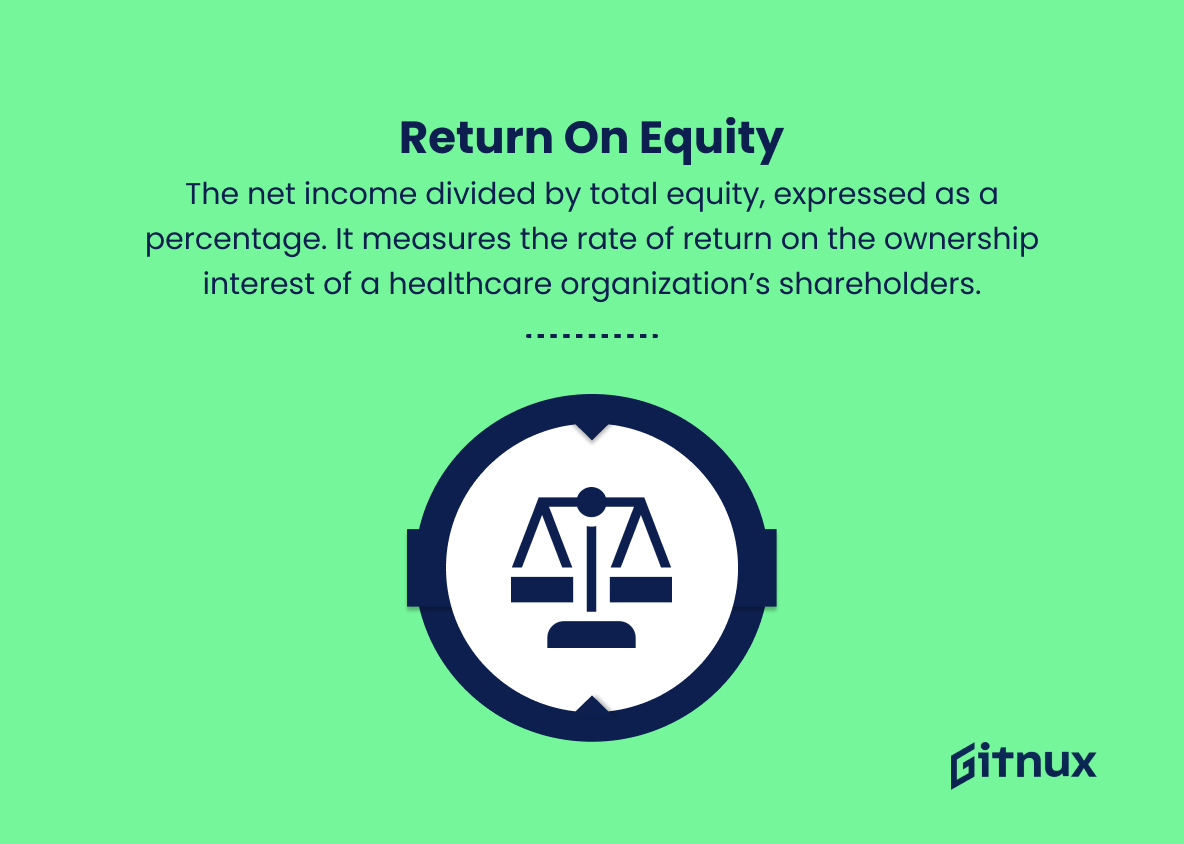
14. Return on Equity (ROE)
The net income divided by total equity, expressed as a percentage. It measures the rate of return on the ownership interest of a healthcare organization’s shareholders.
15. Fixed Asset Turnover
The ratio of net patient service revenue to total fixed assets, which measures how efficiently a healthcare organization is using its fixed assets to generate revenue.
16. Bad Debt Expense Ratio
The percentage of bad debt expense (uncollectible accounts) to net patient service revenue. This indicates the effectiveness of an organization’s collection policies and practices.
17. Length of Stay (LOS)
The average number of days a patient spends in a healthcare facility, used to measure the efficiency and effectiveness of patient care.
18. Occupancy Rate
The percentage of available bed capacity that is currently utilized in a healthcare facility.
19. Case Mix Index (CMI)
A measure of the clinical complexity and resource utilization of a healthcare organization’s patients, which is used to compare and analyze patient care across different facilities.
Healthcare Financial Metrics Explained
Healthcare financial metrics are crucial for evaluating the financial performance, efficiency, and overall health of a healthcare organization. Revenue, which represents the total income generated from providing healthcare services, reflects the organization’s financial capacity to deliver care, while Net Patient Revenue (NPR) provides insight into the revenue derived from patient services after accounting for deductions. Total Operating Expense (TOE) helps gauge the cost-effectiveness of operations, whereas Operating Margin and Net Income indicate the organization’s profitability and financial stability.
Metrics like Cost per Case, Days in Accounts Receivable (DAR), and Debt-to-Equity Ratio can provide insights into operational efficiency, cash flow management, and long-term solvency. Operating Cash Flow (OCF), EBITDA, and Total Margin offer additional perspectives on profitability and financial performance, while liquidity and efficiency measures like Current Ratio, Return on Assets (ROA), Return on Equity (ROE), and Fixed Asset Turnover provide an assessment of the organization’s short-term financial health and asset utilization.
Finally, metrics like Bad Debt Expense Ratio, Length of Stay (LOS), Occupancy Rate, and Case Mix Index (CMI) give insights into the effectiveness of collections practices, patient care efficiency, bed utilization, and clinical complexity of the patient population, all of which contribute to a comprehensive understanding of a healthcare organization’s overall performance and financial health.
Conclusion
In conclusion, healthcare financial metrics are crucial in understanding and managing the financial performance of healthcare organizations. These metrics not only help in identifying the key financial indicators that affect the profitability and sustainability of healthcare operations, but they also serve as a guide in making informed decisions and implementing effective strategies.
As the healthcare industry continues to evolve and face new challenges, such as rising costs, changing regulations, and increasing demand for quality care, it is now more important than ever for healthcare executives and managers to stay well-versed with these metrics. By leveraging this knowledge and continuously adapting to the changing landscape, healthcare organizations can maintain their financial health, ensure the delivery of high-quality patient care, and remain competitive in the industry.
