


In today’s rapidly evolving financial landscape, Fintech has emerged as a driving force of innovation, transforming the way businesses and individuals engage with banking, payments, and investments. As market demands and expectations shift, it’s crucial to stay ahead of the curve by understanding the most relevant and influential Fintech metrics.
In this in-depth blog post, we’ll examine the key performance indicators shaping the industry, offering valuable insights to help you stay informed, make strategic decisions, and ultimately harness the full potential of Fintech. So, whether you’re a seasoned professional or simply curious about the future of finance, join us as we navigate the dynamic world of Fintech Metrics.
Fintech Metrics You Should Know
1. Customer Acquisition Cost (CAC)
The cost of acquiring a new customer, including marketing, advertising, and other expenses divided by the number of customers acquired.
2. Churn Rate
The percentage of customers who leave the service within a specific period, which indicates customer dissatisfaction or better alternatives available.
3. Net Promoter Score (NPS)
A measure of customers’ willingness to recommend the fintech service to others, ranging from -100 to 100. A higher score indicates higher customer satisfaction and loyalty.
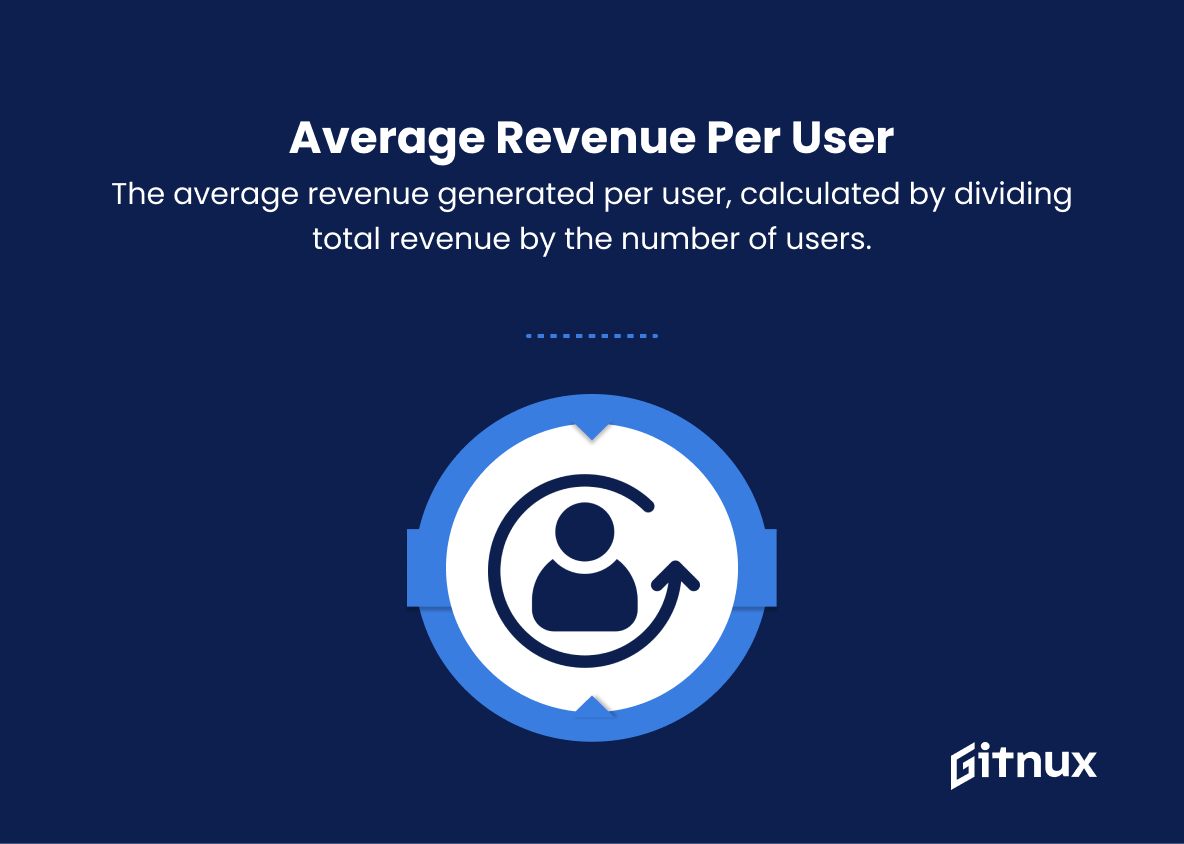
4. Average Revenue Per User (ARPU)
The average revenue generated per user, calculated by dividing total revenue by the number of users.
5. Customer Lifetime Value (CLTV)
An estimate of the total value of a customer over their entire relationship with the fintech company, considering factors like profit margins, churn rate, and customer acquisition cost.
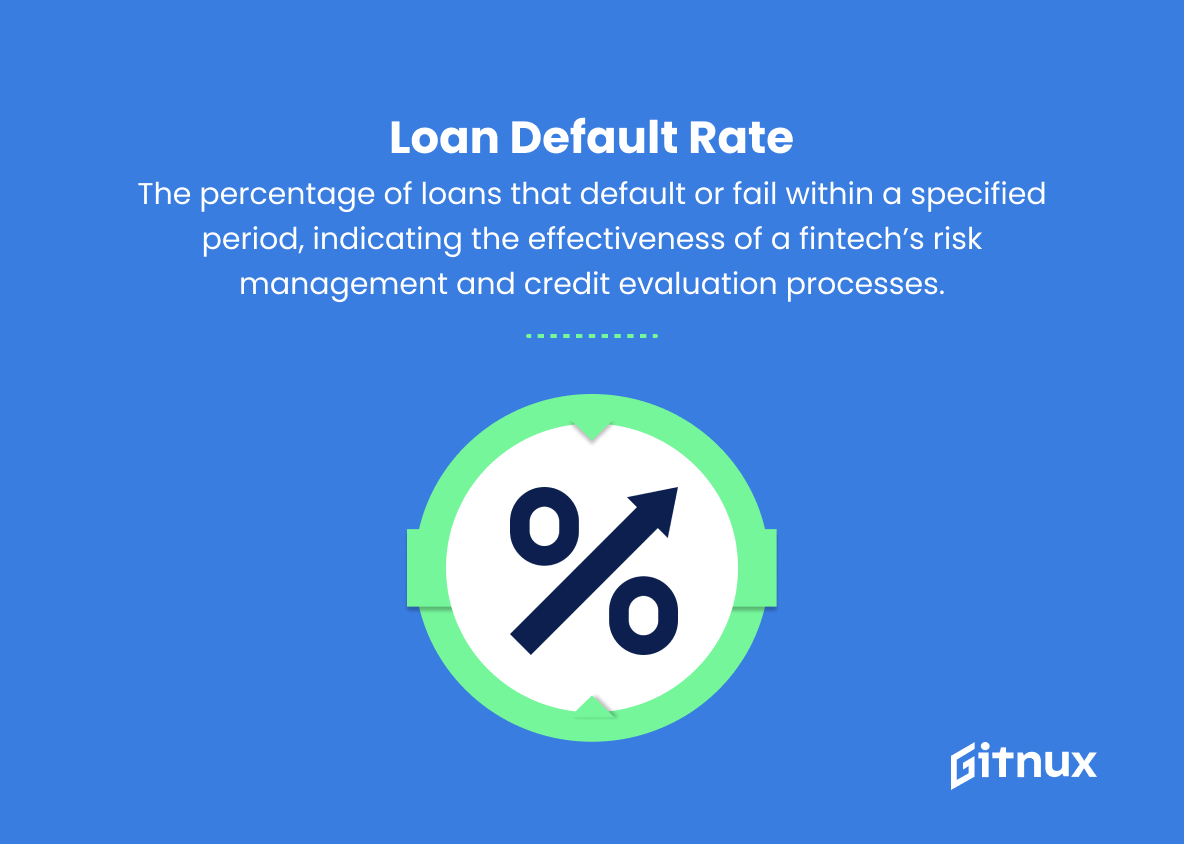
6. Loan Default Rate
The percentage of loans that default or fail within a specified period, indicating the effectiveness of a fintech’s risk management and credit evaluation processes.
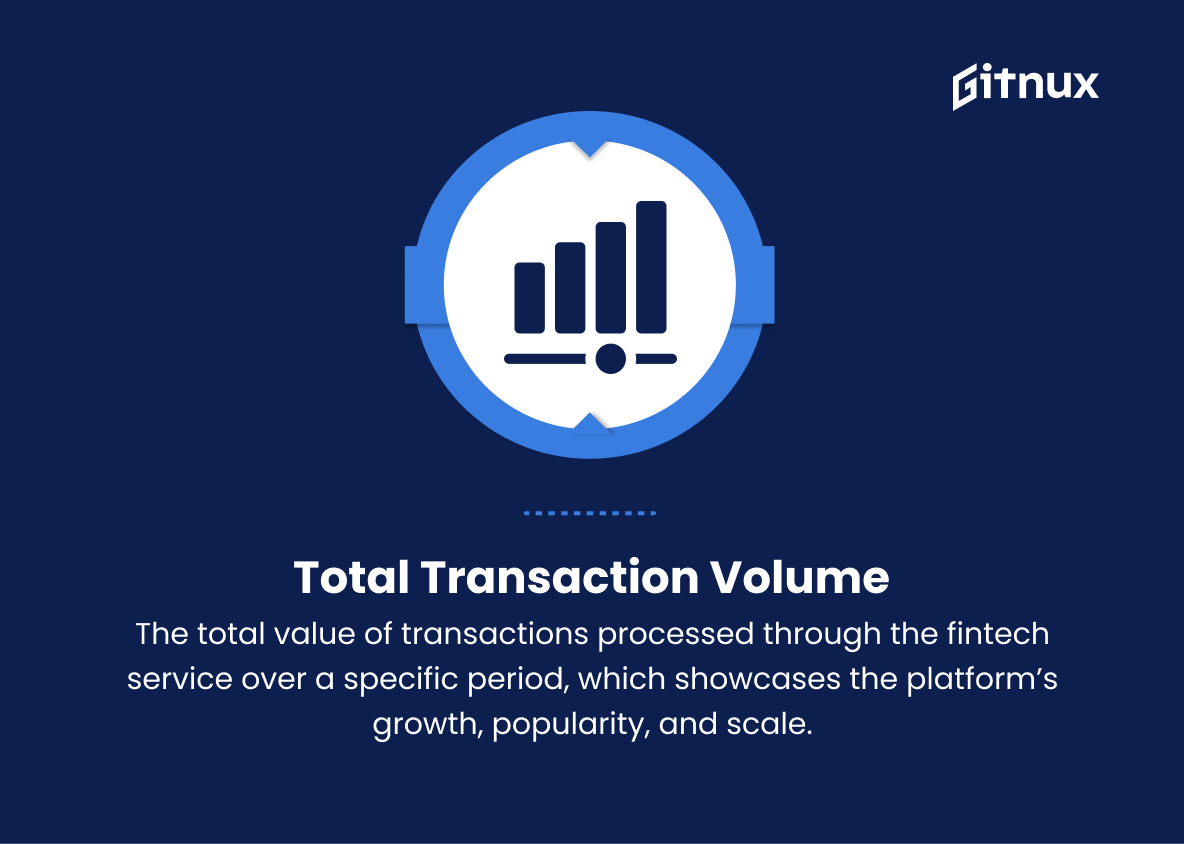
7. Total Transaction Volume (TTV)
The total value of transactions processed through the fintech service over a specific period, which showcases the platform’s growth, popularity, and scale.
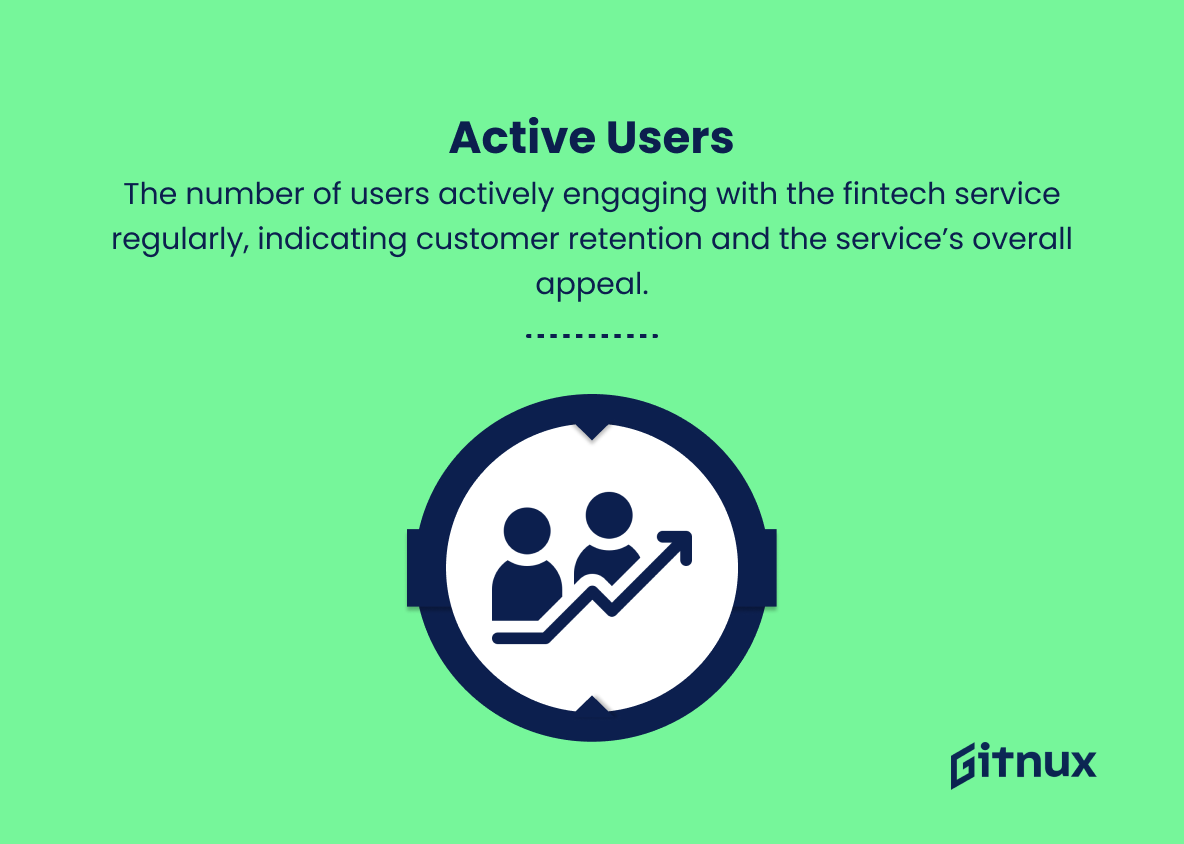
8. Active Users
The number of users actively engaging with the fintech service regularly, indicating customer retention and the service’s overall appeal.
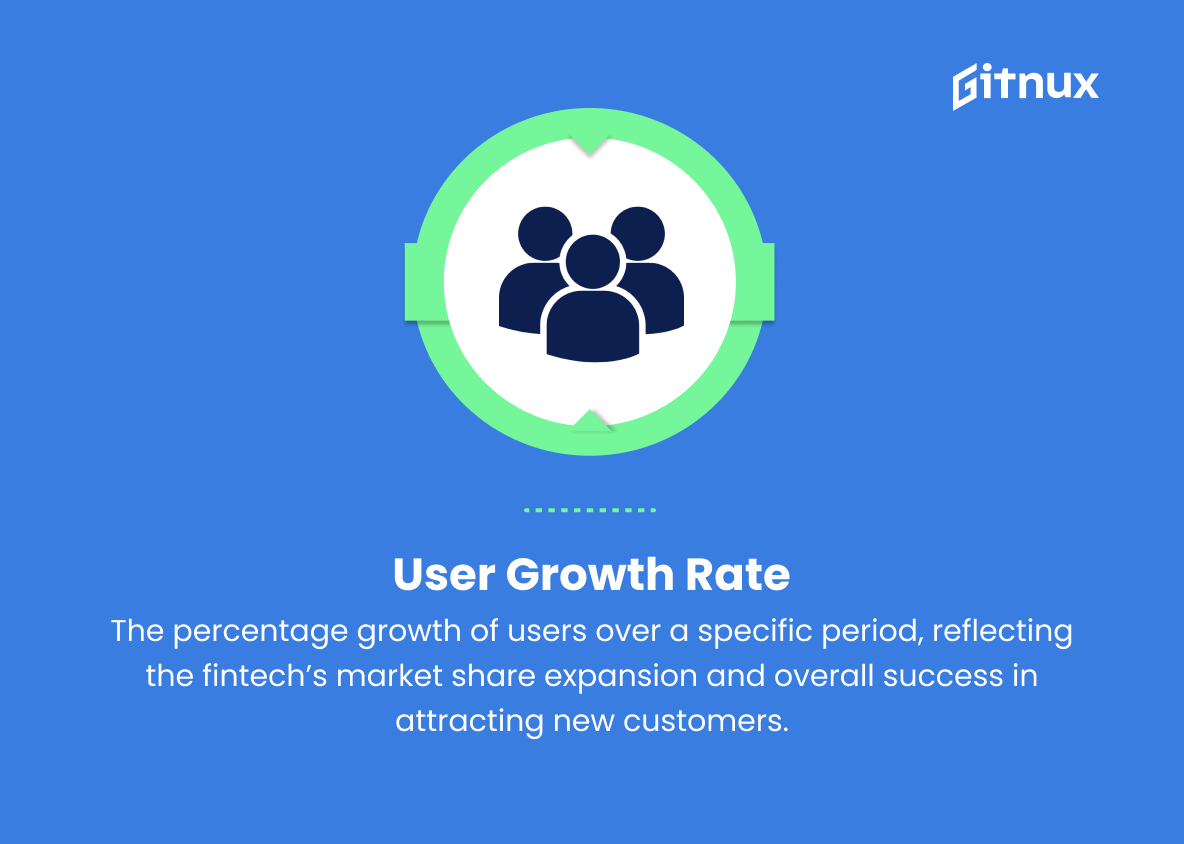
9. User Growth Rate
The percentage growth of users over a specific period, reflecting the fintech’s market share expansion and overall success in attracting new customers.
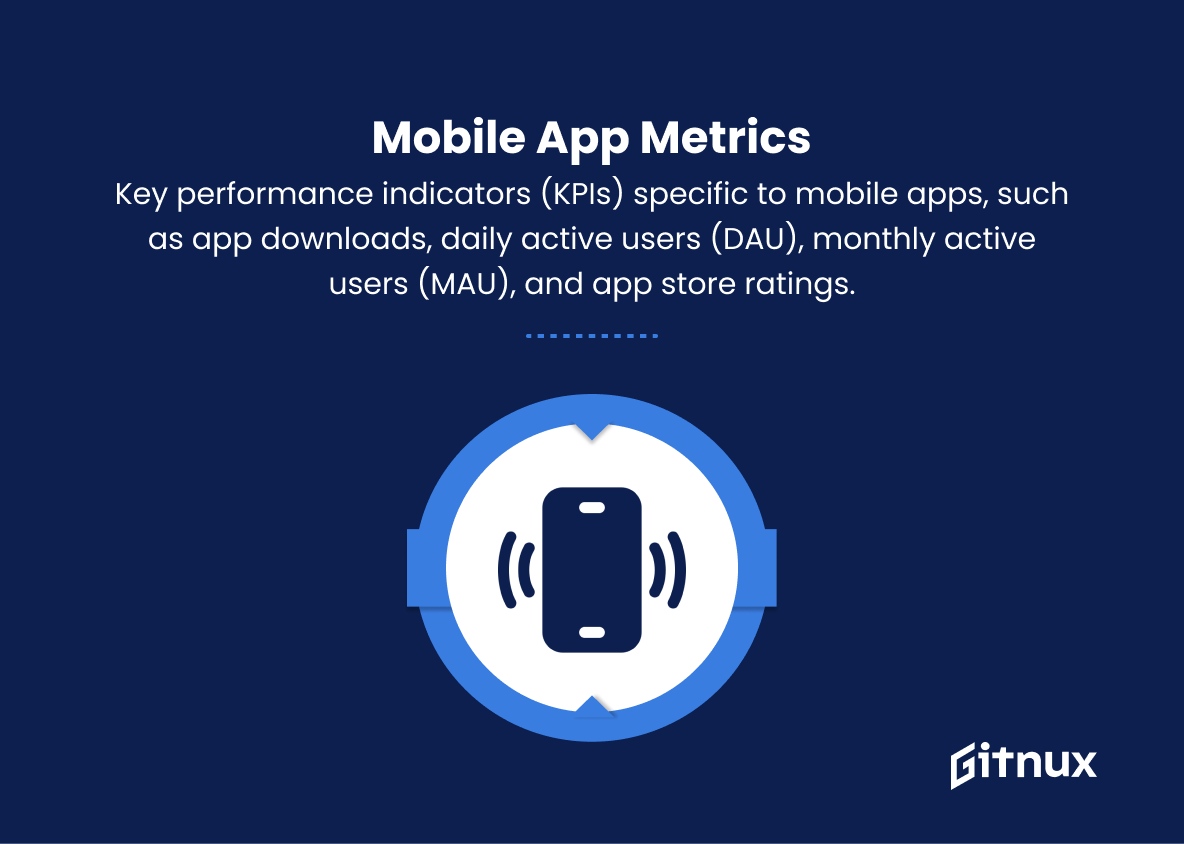
10. Mobile App Metrics
Key performance indicators (KPIs) specific to mobile apps, such as app downloads, daily active users (DAU), monthly active users (MAU), and app store ratings.
11. Conversion Rate
The percentage of users who complete a defined action, such as signing up, upgrading, or making a transaction. A high conversion rate shows the success of marketing campaigns and user experience.
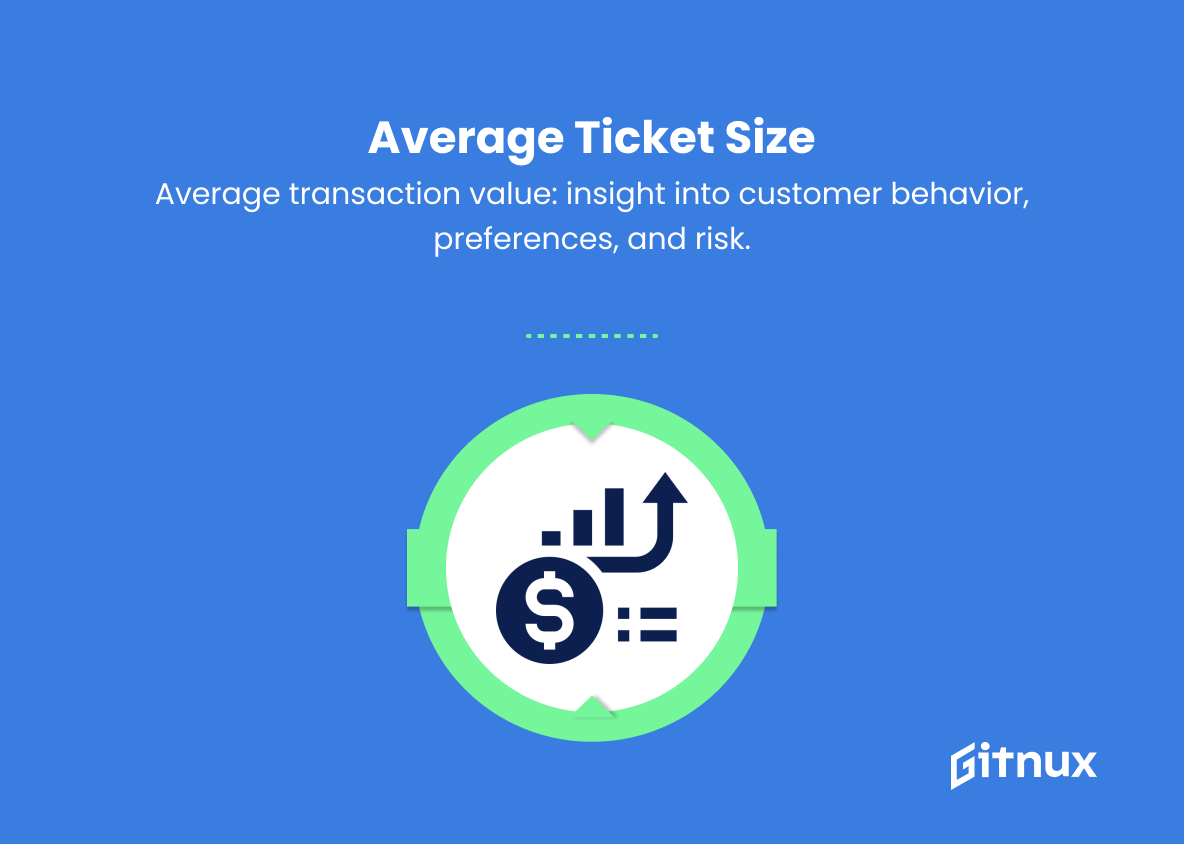
12. Average Ticket Size
The average value of a single transaction, including loans, investments, or transfers. This metric can help fintechs understand their customer behavior, preferences, and risk exposure.
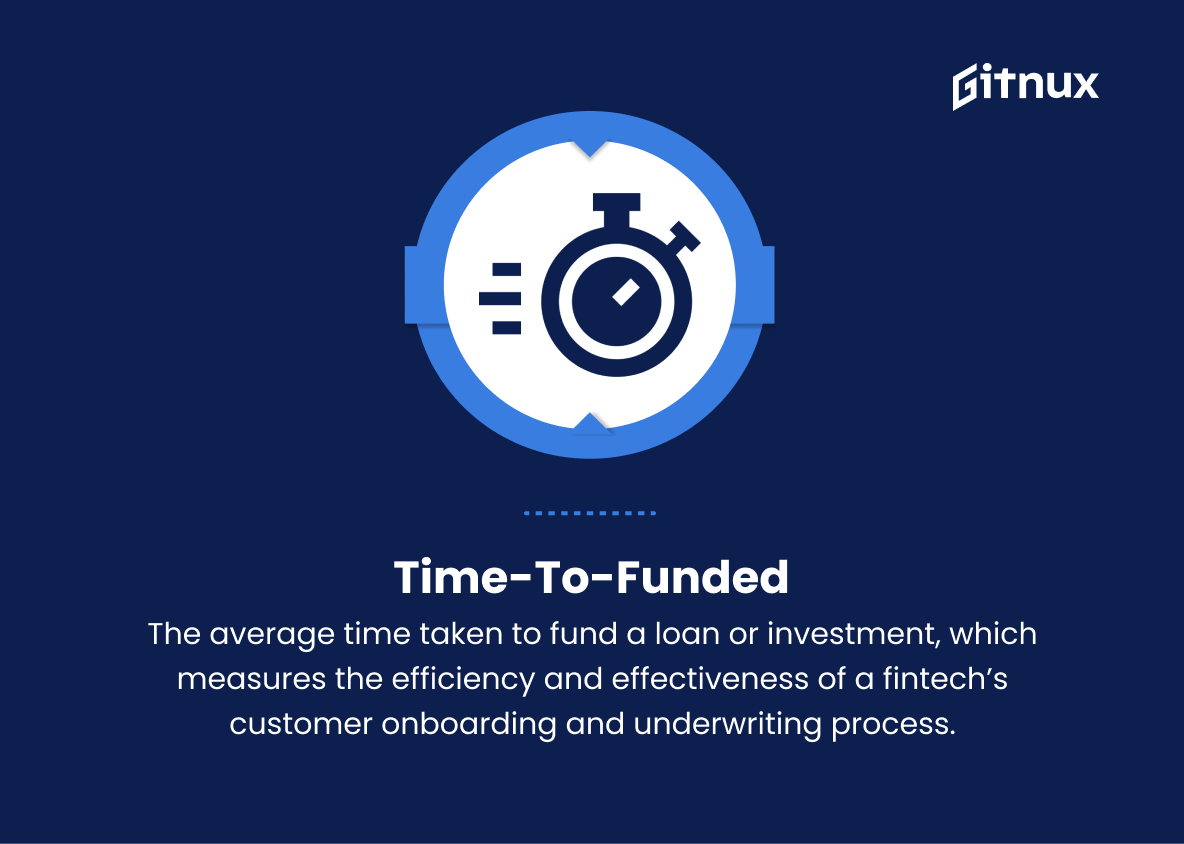
13. Time-to-Funded
The average time taken to fund a loan or investment, which measures the efficiency and effectiveness of a fintech’s customer onboarding and underwriting process.
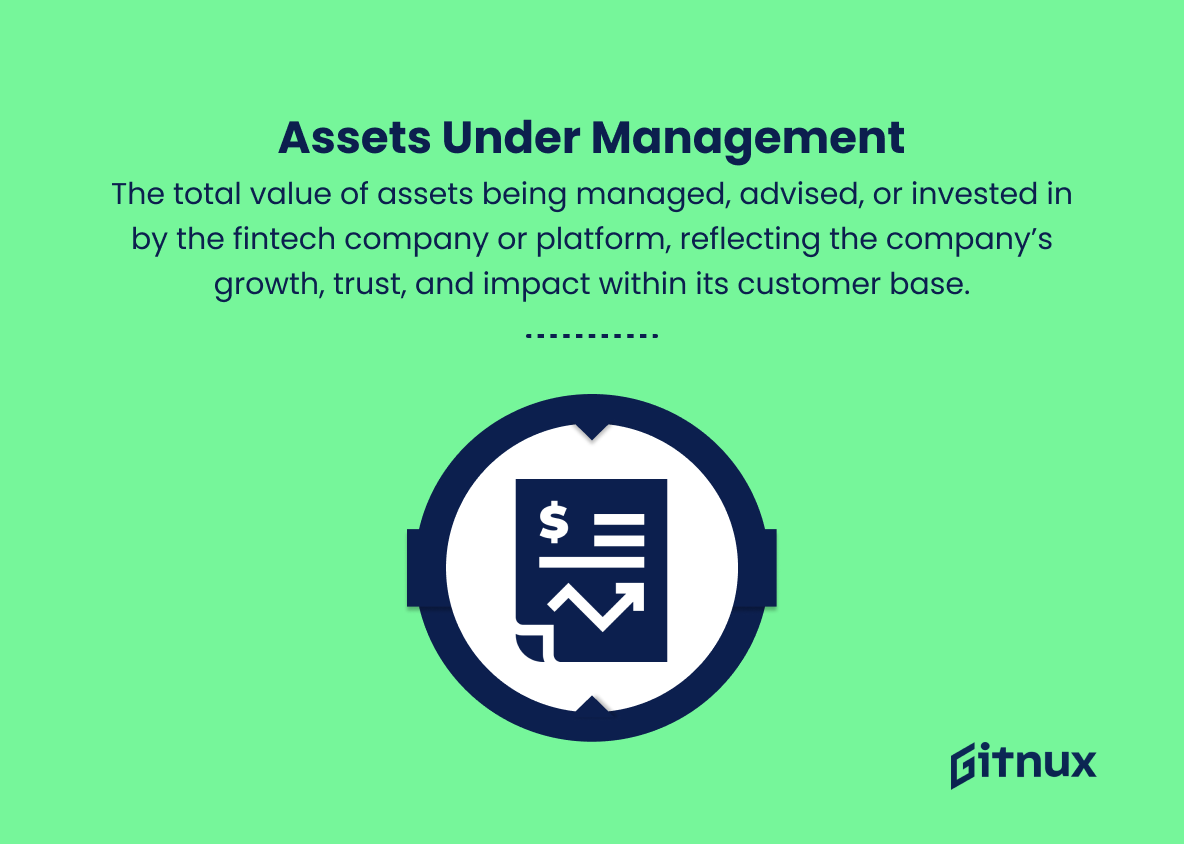
14. Assets Under Management (AUM)
The total value of assets being managed, advised, or invested in by the fintech company or platform, reflecting the company’s growth, trust, and impact within its customer base.
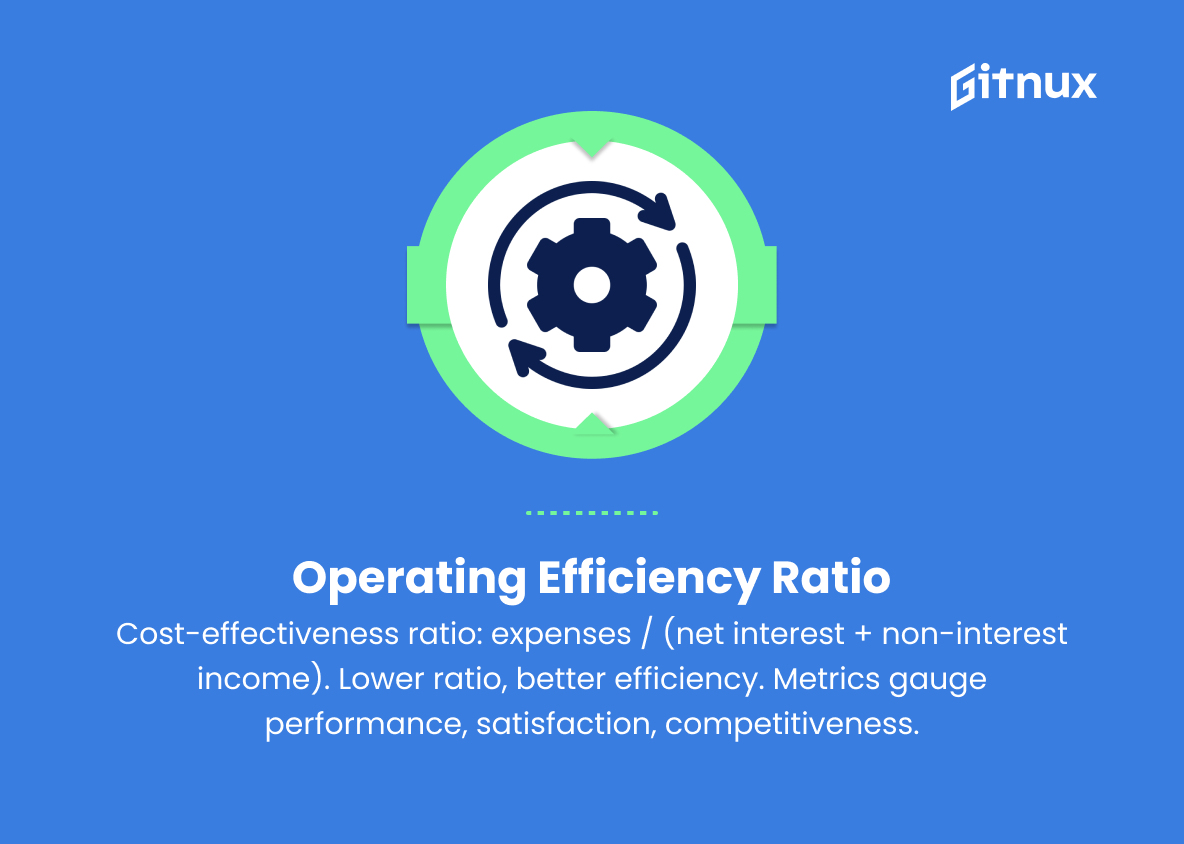
15. Operating Efficiency Ratio
The overall cost-effectiveness of the fintech company, calculated by dividing its non-interest expenses by the sum of its net interest income and non-interest income. A lower ratio indicates better operational efficiency.
These metrics can provide valuable insight into a fintech company’s performance, customer satisfaction, and competitiveness within the financial services industry.
Fintech Metrics Explained
Fintech metrics play a critical role in evaluating a company’s performance, customer satisfaction, and competitiveness within the financial services industry. Metrics such as Customer Acquisition Cost, Churn Rate, and Net Promoter Score offer insights into marketing effectiveness, customer loyalty, and satisfaction, while Average Revenue Per User, Customer Lifetime Value, and Loan Default Rate reflect revenue generation, long-term customer value, and risk management capabilities.
Total Transaction Volume, Active Users, and User Growth Rate showcase the platform’s growth and market penetration, while Mobile App Metrics, Conversion Rate, and Average Ticket Size inform user engagement, marketing success, and customer behavior insights. Time-to-Funded, Assets Under Management, and Operating Efficiency Ratio depict the fintech’s operational efficiency, trustworthiness, and impact within its customer base.
By closely monitoring these metrics, fintech companies can identify areas of improvement, set realistic goals, and inform strategic decision-making to remain competitive in the ever-evolving world of financial technology.
Conclusion
In conclusion, Fintech metrics have become an essential tool for the ever-evolving world of financial technology. By observing and analyzing these key performance indicators, organizations can effectively measure their success, optimize processes, and penetrate markets.
It is crucial for businesses operating in the Fintech ecosystem to stay updated on the latest trends and developments, in order to meet the demands of customers and stay ahead of the competition. As the Fintech industry continues to disrupt the traditional financial sector, understanding these metrics will not only help businesses stay agile and grow exponentially, but also contribute to building a more inclusive and efficient global financial landscape.
