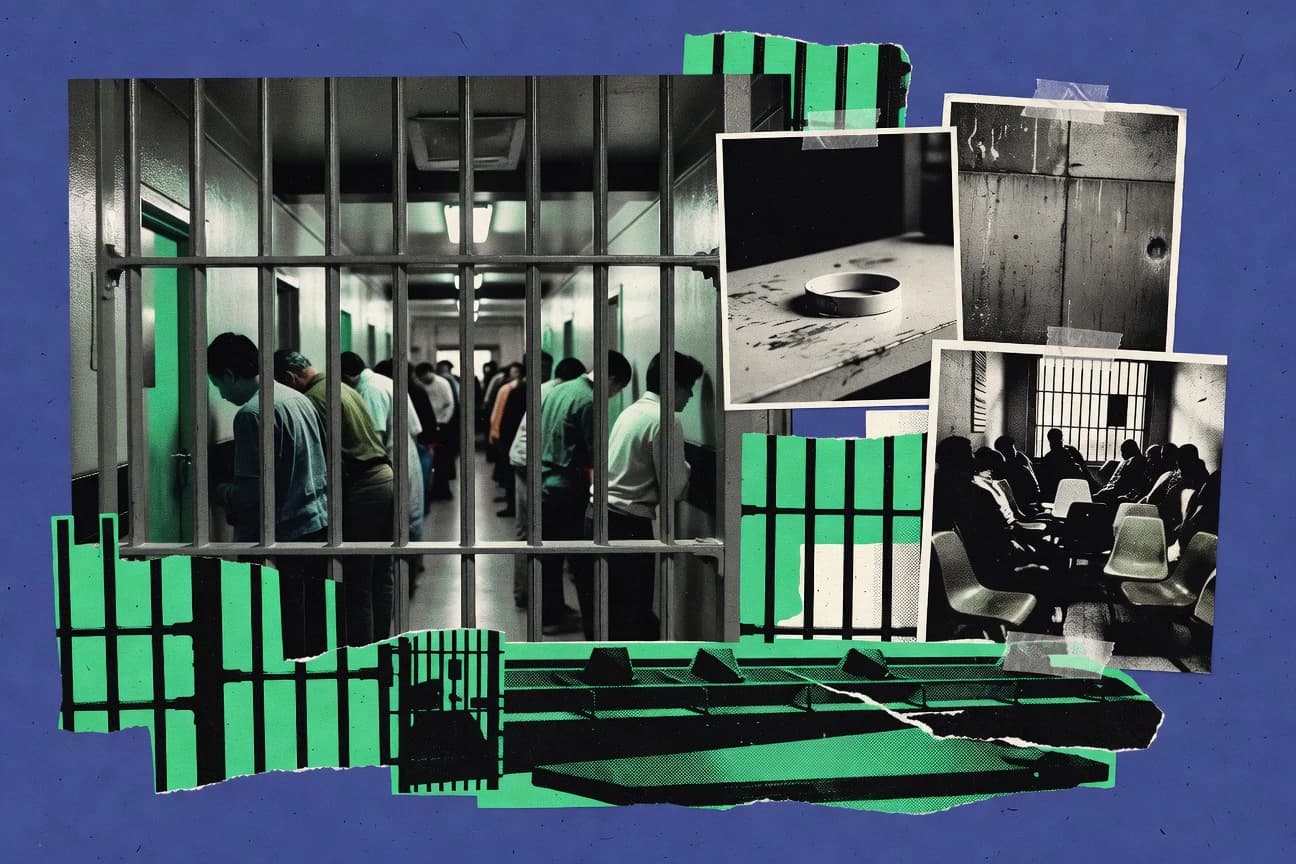

The United States accounts for 25 percent of the world's incarcerated population while representing 5 percent of global residents. Black Americans comprise 33 percent of the prison population but 12 percent of U.S. adults. Data on offense types, sentence lengths, annual spending of 80 billion dollars, and an 83 percent recidivism rate within nine years detail the system's reach and outcomes.
Key Takeaways
- Black Americans comprise 33% of prison population but 12% of U.S. adults
- 38% of U.S. prison population is Black men aged 18-39
- Hispanic people are 16% of U.S. population but 24% of prison population in 2021
- In 2021, the U.S. had an incarceration rate of 531 people per 100,000 residents in prisons and jails combined
- The U.S. prison population totaled 1,230,100 at year-end 2021, down 2% from 2020
- From 2000 to 2021, the state prison population declined by 25%, from 1,214,000 to 1,102,090
- Drug offenses account for 46% of federal prisoners
- Violent crimes make up 48% of state prison population
- Property crimes: 17% of state prisoners in 2021
- Average sentence for murder in state prison: 22 years
- 55% of state prisoners receive sentences over 5 years
- Federal mandatory minimums apply to 25% of drug sentences
- U.S. spends $80 billion annually on incarceration
- Recidivism rate: 83% rearrested within 9 years of release
- Cost per inmate per year: $47,000 in state prisons
The United States incarcerates millions, with stark racial and gender disparities and enormous social costs.
Related reading
01 · Category
Demographics27 stats
01
Black Americans comprise 33% of prison population but 12% of U.S. adults
02
38% of U.S. prison population is Black men aged 18-39
03
Hispanic people are 16% of U.S. population but 24% of prison population in 2021
04
White people are 58% of prison population but 69% of U.S. adults
05
Women make up 8.6% of U.S. prison population in 2022
06
Black women incarcerated at 5 times rate of white women
07
50% of incarcerated women have children under 18
08
Median age of state prisoners is 37 years old
09
32% of state prisoners are aged 40 or older in 2021
10
Native Americans incarcerated at 2.5 times rate of whites
11
65% of state prisoners have no high school diploma
12
27% of federal inmates have mental health disorders
13
56% of jail inmates reported drug use in past month pre-arrest
14
LGBTQ+ individuals are 5-10 times more likely to be incarcerated
15
Veterans comprise 8% of state prison population
16
40% of women prisoners are serving time for nonviolent offenses
17
Black youth are 5 times more likely to be incarcerated than white youth
18
70% of Black children have a parent with criminal record
19
Hispanic men incarcerated at 2.6 times rate of white men
20
Elderly prisoners (55+) now 16% of population, up from 6% in 1995
21
19% of state prisoners are foreign-born
22
Transgender inmates face 13 times higher assault rate
23
54% of jail inmates are white, 27% Black, 15% Hispanic
24
Rural areas have higher incarceration rates than urban
25
1 in 3 Black men have felony conviction lifetime risk
26
Women prisoners grew 82% from 1993-2021 vs. 59% for men
27
48% of federal prisoners are non-U.S. citizens
Interpretation
Demographics Interpretation
While these numbers paint a bleak and systemic portrait of a justice system that disproportionately selects, convicts, and cages Black, Hispanic, and poor Americans, they also quietly reveal the devastating collateral damage inflicted on families, children, and entire communities.
02 · Category
Incarceration Rates30 stats
01
In 2021, the U.S. had an incarceration rate of 531 people per 100,000 residents in prisons and jails combined
02
The U.S. prison population totaled 1,230,100 at year-end 2021, down 2% from 2020
03
From 2000 to 2021, the state prison population declined by 25%, from 1,214,000 to 1,102,090
04
Local jail population was 659,100 in 2022, the lowest since 1995
05
Federal prison population was 143,644 at year-end 2022
06
U.S. incarceration rate for Black Americans was 1,186 per 100,000 in 2021
07
The national incarceration rate dropped 25% from its peak in 2006
08
Juvenile detention population fell to 30,146 in 2021, down 72% since 2000
09
Pretrial detention rate was 226 per 100,000 in 2021
10
Sentenced population in prisons and jails was 1,047,100 in 2021
11
U.S. has 25% of world's incarcerated population despite 5% of world population
12
State prison population per 100,000 adults was 350 in 2021
13
Jail incarceration rate was 181 per 100,000 in 2022
14
Federal incarceration rate was 36 per 100,000 in 2022
15
Total correctional population under supervision was 5.9 million in 2021
16
Probation population was 3,496,100 in 2021
17
Parole population was 843,000 in 2021
18
Incarceration rate for women rose 475% from 1980-2021
19
Men's incarceration rate fell 33% since 2006 peak
20
Youth incarceration rate dropped 75% from 2000-2021
21
U.S. incarceration rate is 5 times higher than Canada's
22
State jail population averaged 570,000 daily in 2022
23
Federal Bureau of Prisons held 151,161 inmates in 2023
24
Total U.S. prisoners under jurisdiction: 1,193,300 in 2022
25
Incarceration rate in Southern states averaged 650 per 100,000
26
Northeastern states had lowest rate at 320 per 100,000 in 2021
27
California prison population: 94,000 in 2022, down 45% since 2006
28
Texas prison population: 133,000 in 2022
29
Florida jail average daily population: 55,000 in 2022
30
New York prison population: 32,000 in 2023, down 55% since peak
Interpretation
Incarceration Rates Interpretation
While we can find a flicker of cautious optimism in the multi-year decline of our overall prison population, the persistently grotesque racial disparity and our global monopoly on incarceration reveal a justice system that has traded mass for malignant inequality.
03 · Category
Offense Types27 stats
01
Drug offenses account for 46% of federal prisoners
02
Violent crimes make up 48% of state prison population
03
Property crimes: 17% of state prisoners in 2021
04
Drug offenses: 12% of state prisoners
05
Public order offenses: 23% of state prisoners
06
Murder/non-negligent manslaughter: 15.1% of state prisoners
07
Rape/sexual assault: 12.6% of sentenced state prisoners
08
Robbery: 12.2% of state prisoners
09
Aggravated assault: 7.9% of state prisoners
10
Burglary: 7.4% of state prisoners
11
Larceny/theft: 4.4% of state prisoners
12
Drug possession: 3.9% of state prisoners
13
Fraud: 1.8% of state prisoners
14
83% of state drug prisoners are for trafficking/sale, not possession
15
Firearm offenses: 9% of federal prisoners
16
Immigration offenses: 5% of federal prisoners
17
99% of state violent crime prisoners convicted of violent offenses
18
Methamphetamine most common drug offense in state prisons at 33%
19
65% of jail inmates held for misdemeanors or status offenses
20
DUI offenses: 10% of state prisoners
21
Child abuse: 1.2% of state prisoners
22
40% of federal sentences for drugs are crack cocaine related historically
23
White-collar crimes: less than 10% of federal prisoners
24
Sex offenses: 19% of state prisoners, up from 12% in 2000
25
Other unspecified offenses: 6% of state prisoners
26
Parole violations: 26% of state prison admissions
27
Technical violations account for 50% of parole revocations
Interpretation
Offense Types Interpretation
While federal prisons are stuffed with non-violent drug offenders, state prisons are overwhelmingly for violent crimes, but we keep filling them with people who fail to check in with their parole officer, proving we're more committed to punishing paperwork violations than preventing the trauma that actually fills the cells.
More related reading
04 · Category
Sentencing Practices25 stats
01
Average sentence for murder in state prison: 22 years
02
55% of state prisoners receive sentences over 5 years
03
Federal mandatory minimums apply to 25% of drug sentences
04
Life sentences without parole: 50,000 people in U.S. prisons
05
Black men receive 19.1% longer sentences than white men for same crimes
06
98% of federal cases end in guilty pleas
07
Average federal drug sentence: 72 months in FY2022
08
Three-strikes laws in 28 states lead to 20% longer sentences
09
34% of state prisoners have sentences of over 10 years
10
Juvenile life without parole sentences: 2,100 serving in 2021
11
Truth-in-sentencing laws require 85% time served in 33 states
12
Federal sentences for powder cocaine average 108 months vs. 126 for crack
13
Women receive 28% shorter sentences than men federally
14
15% of state prisoners eligible for parole
15
Average time served by released state prisoners: 2.7 years
16
Death sentences imposed: 20 in 2022, lowest in modern era
17
Habitual offender laws increase sentences by 50% on average
18
Federal gun enhancement adds 5 years to 40% of sentences
19
Plea bargains reduce sentences by 30% on average
20
Life sentences total 203,000 in U.S. prisons
21
Pretrial detention increases conviction likelihood by 25%
22
Cash bail leads to 40% longer pretrial detention
23
Supermax solitary confinement sentences up to 40 years
24
Federal average sentence length: 57 months in 2022
25
State violent offenders serve 63% of sentence before release
Interpretation
Sentencing Practices Interpretation
America's justice system has perfected a dark arithmetic where mandatory minimums inflate the collateral damage, plea deals grease the wheels of a guilty factory, and racial bias compounds the interest on every sentence, proving we don't just lock people up—we sentence them by spreadsheet.
05 · Category
System Impacts25 stats
01
U.S. spends $80 billion annually on incarceration
02
Recidivism rate: 83% rearrested within 9 years of release
03
Cost per inmate per year: $47,000in state prisons
04
68% of released state prisoners rearrested within 3 years
05
Incarceration costs $182 billion including societal costs
06
1 in 5 parolees reincarcerated for technical violations
07
Prison healthcare costs rose 45% from 2001-2011
08
Recidivism drops 43% with education programs
09
Mass incarceration costs $1 trillion in lost earnings
10
30% of formerly incarcerated unemployed long-term
11
Solitary confinement increases recidivism by 25%
12
Family separation from incarceration costs $9 billion yearly
13
2.7 million U.S. children have incarcerated parent
14
Prisoner labor generates $11 billion revenue but pays $0.14-$0.52/hour
15
Mental health treatment reduces recidivism 20-30%
16
COVID-19 deaths in prisons: 2,500+ by 2022
17
40 states under court order for prison conditions
18
Reentry housing denial rate: 75% for ex-prisoners
19
Collateral consequences: 44,000+ restrictions post-sentence
20
Employment ban for felons in 27 states for public jobs
21
Voter disenfranchisement: 5.2 million due to felony convictions
22
Food stamp bans affect 150,000 ex-prisoners yearly
23
Prison phone calls cost families $1.6 billion annually pre-reform
24
Drug treatment programs cut recidivism 12%
25
Elderly release saves $70,000per inmate annually
Interpretation
System Impacts Interpretation
The United States is spending billions on a prison system that seems more invested in recycling people than rehabilitating them, as evidenced by an 83% recidivism rate, while systematically dismantining the very housing, employment, and family supports proven to make success after release possible.
Reference
Cite This Report
This report is designed to be cited. We maintain stable URLs and versioned verification dates. Copy the format appropriate for your publication below.
APA
Elif Demirci. (2026, February 13). U.S. Incarceration Statistics. Gitnux. https://gitnux.org/u-s-incarceration-statistics
MLA
Elif Demirci. "U.S. Incarceration Statistics." Gitnux, 13 Feb 2026, https://gitnux.org/u-s-incarceration-statistics.
Chicago
Elif Demirci. 2026. "U.S. Incarceration Statistics." Gitnux. https://gitnux.org/u-s-incarceration-statistics.
Sources & references
24 datasets cited across this report · attribution is report-level