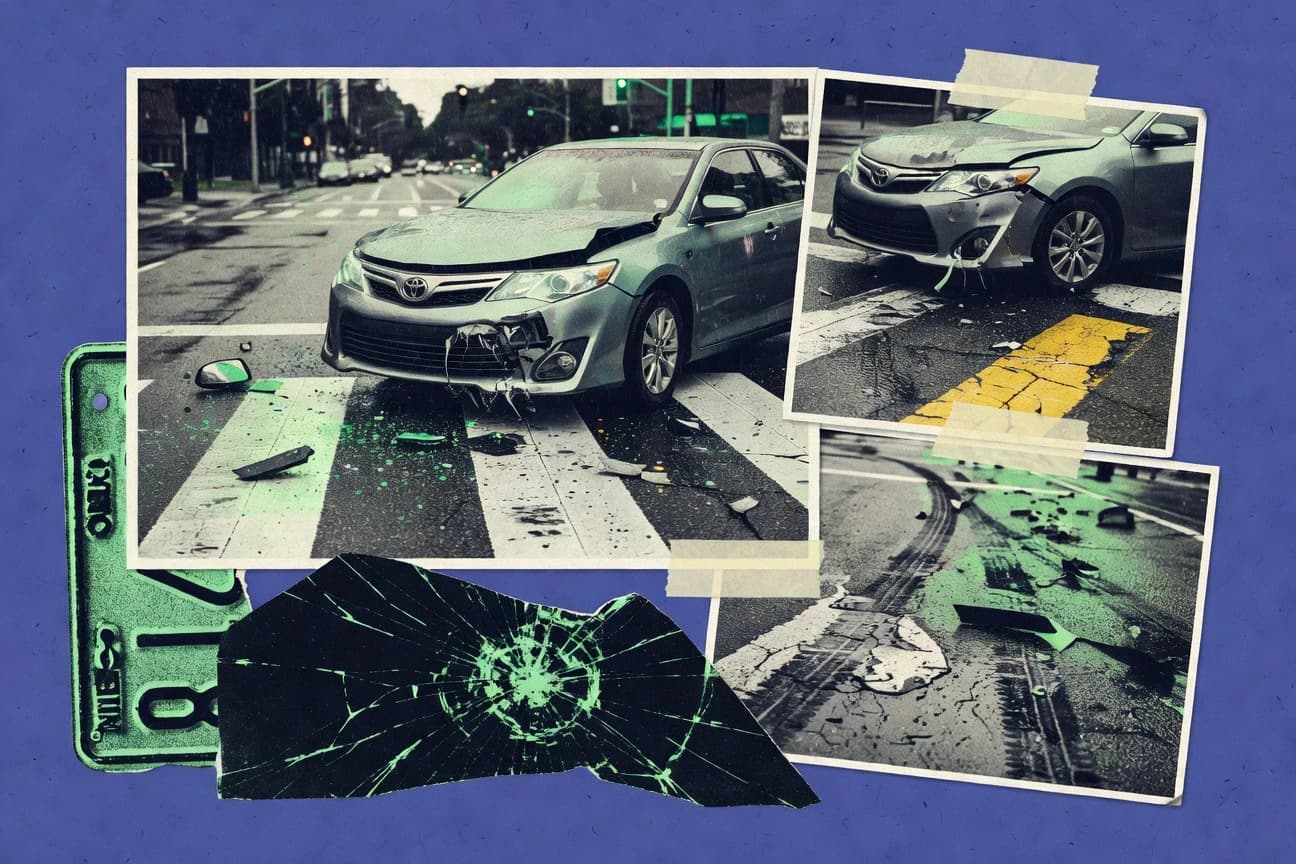

Traffic accidents affect millions of people each year through deaths, serious injuries, and long-term harm, with outcomes shaped by behaviors like speeding, impaired driving, and distracted habits. Patterns differ by who is hit and where: drivers account for 53% of U.S. traffic fatalities in 2022, while globally 54% of road deaths are pedestrians and males face much higher fatality risk. This page maps trends and risk factors across the United States, the EU, and Australia, then connects them to global patterns where most crash deaths occur in low- and middle-income countries.
Key Takeaways
- Distracted driving caused 3,142 deaths and 362,000 injuries in U.S. 2022.
- Drunk driving led to 13,524 U.S. fatalities and thousands of injuries in 2022.
- Speeding was a factor in 29% of all U.S. fatal crashes in 2021.
- Males are 3 times more likely to be killed in crashes.
- In U.S., 53% of traffic fatalities were drivers in 2022.
- Ages 16-20: Highest crash rate per mile driven in U.S.
- In 2022, the United States recorded 42,514 motor vehicle traffic fatalities, representing a 0.3% increase from 2021 according to preliminary estimates.
- Globally, road traffic crashes killed approximately 1.19 million people in 2023, with 90% occurring in low- and middle-income countries.
- In the European Union, 19,976 people died in road accidents in 2022, a rate of 4.5 per 100,000 inhabitants.
- In 2021, there were over 5 million motor vehicle crashes in the U.S., resulting in 42,939 fatalities.
- U.S. traffic crashes caused 5.25 million injuries in 2020.
- Globally, road crashes injure 20-50 million people annually.
- U.S. fatalities rose 16% during pandemic 2020-2021.
- Global road deaths down 3.6% from 2010-2021.
- EU fatalities halved since 2001 to 2022.
In 2022, the United States saw 42,514 road deaths, with distracted and drunk driving and speeding still driving the risk.
Related reading
01 · Category
Causes24 stats
01
Distracted driving caused 3,142 deaths and 362,000 injuries in U.S. 2022.
02
Drunk driving led to 13,524 U.S. fatalities and thousands of injuries in 2022.
03
Speeding was a factor in 29% of all U.S. fatal crashes in 2021.
04
Globally, speeding contributes to one-third of road traffic deaths.
05
In EU, 22% of fatal accidents involved alcohol in 2022.
06
Australia: 30% of fatalities due to speeding in 2022.
07
India: Over-speeding caused 71.2% of accidents in 2021.
08
Canada: Distracted driving in 26% of fatal collisions 2022.
09
Japan: 20% of accidents due to inattention in 2022.
10
Brazil: Alcohol involved in 25% of fatal crashes 2021.
11
South Africa: Speeding primary cause in 35% of fatal crashes 2022.
12
Germany: 12% of fatalities from DUI in 2022.
13
UK: 17% of serious casualties from speeding 2022.
14
China: Violation of traffic rules in 90% of accidents.
15
Mexico: Fatigue caused 15% of serious accidents 2022.
16
U.S.: Red-light running kills 900+ yearly.
17
Drowsy driving involved in 91,000 U.S. crashes annually.
18
Seat belt non-use caused 49% of passenger vehicle occupant deaths 2021.
19
Motorcycle helmet non-use doubles fatality risk.
20
Wrong-way driving causes 400+ U.S. deaths yearly.
21
Teen drivers: 19% of fatalities due to speeding.
22
Large trucks: Brake issues in 30% of crashes.
23
Pedestrian crashes: 74% at night in U.S.
24
Bicycle collisions: 90% involve motor vehicles.
Interpretation
Causes Interpretation
For the causes behind traffic accidents, the data point to a clear pattern where alcohol, speeding, and distracted driving are driving large shares of harm, from 29% of U.S. fatal crashes tied to speeding in 2021 to alcohol being involved in 22% of EU fatal accidents in 2022 and distracted driving causing 3,142 deaths and 362,000 injuries in the U.S. in 2022.
02 · Category
Demographics23 stats
01
Males are 3 times more likely to be killed in crashes.
02
In U.S., 53% of traffic fatalities were drivers in 2022.
03
Ages 16-20: Highest crash rate per mile driven in U.S.
04
Globally, 54% of road deaths are pedestrians.
05
EU: Young males (18-24) highest fatality risk group.
06
Australia: Males 71% of road deaths 2022.
07
India: 75% of fatalities male victims 2021.
08
Canada: 75% of fatalities male 2022.
09
Japan: Elderly (65+) 40% of fatalities despite lower mileage.
10
Brazil: 80% male road deaths 2021.
11
South Africa: Pedestrians 40% of fatalities, mostly males.
12
Germany: 70% male fatalities 2022.
13
UK: 72% male killed or seriously injured 2022.
14
China: Rural areas 60% of fatalities.
15
Mexico: 65% fatalities in urban areas 2022.
16
U.S.: Blacks 21% higher pedestrian death rate.
17
Teens: 2,800 U.S. drivers killed yearly.
18
Elderly U.S.: 20% of fatalities, 9% of population.
19
Males drive 60% more miles, account for 70% deaths.
20
Children under 15: 95,000 injured yearly U.S.
21
Hispanic drivers: 14% of population, 17% fatalities.
22
Rural U.S. roads: 53% of fatalities despite 19% travel.
23
Motorcyclists: 80% male fatalities U.S.
Interpretation
Demographics Interpretation
From a demographics perspective, road deaths are heavily shaped by sex and age, with males accounting for most fatalities such as 71% of Australia’s 2022 road deaths and being 3 times more likely to be killed in crashes, while youth remains especially vulnerable as ages 16 to 20 have the highest crash rate per mile driven in the U.S.
03 · Category
Fatalities30 stats
01
In 2022, the United States recorded 42,514 motor vehicle traffic fatalities, representing a 0.3% increase from 2021 according to preliminary estimates.
02
Globally, road traffic crashes killed approximately 1.19 million people in 2023, with 90% occurring in low- and middle-income countries.
03
In the European Union, 19,976 people died in road accidents in 2022, a rate of 4.5 per 100,000 inhabitants.
04
Australia saw 1,194 road fatalities in 2022, with a rate of 4.6 deaths per 100,000 population.
05
In 2021, India reported over 153,972 road accident deaths, accounting for 11% of global road traffic fatalities.
06
Canada recorded 1,931 road fatalities in 2022, down 2.1% from the previous year.
07
Japan had 2,682 traffic accident fatalities in 2022, a historic low with a rate of 2.2 per 100,000.
08
Brazil reported 31,635 road traffic deaths in 2021, equating to 15.1 per 100,000 population.
09
South Africa recorded 12,151 road fatalities in 2022, with a rate of 20.5 per 100,000.
10
In 2022, Germany had 2,788 road deaths, a decrease of 4.4% from 2021.
11
UK road fatalities totaled 1,711 in 2022, the lowest since records began in 1921.
12
China estimated 62,387 road traffic deaths in 2021, with a rate of 4.5 per 100,000.
13
Mexico saw 16,173 traffic fatalities in 2022, up 4% from prior year.
14
In 2023, Florida led U.S. states with 3,567 traffic deaths.
15
New York reported 1,125 road fatalities in 2022.
16
Texas had 4,481 traffic deaths in 2022, highest in the nation.
17
California recorded 4,258 fatalities in 2022 motor vehicle crashes.
18
Globally, males account for 77% of all road traffic deaths.
19
In the U.S., 38,680 people died in motor vehicle crashes in 2020.
20
Nighttime driving accounted for 55% of U.S. traffic fatalities in 2021.
21
In 2022, 13,524 U.S. fatalities occurred in crashes involving drunk drivers.
22
Pedestrian fatalities in the U.S. reached 7,522 in 2022.
23
Motorcycle fatalities in the U.S. totaled 5,579 in 2021.
24
In France, 3,538 people died on roads in 2022.
25
Italy reported 3,039 road deaths in 2022.
26
Sweden had 204 traffic fatalities in 2022, rate of 2.0 per 100,000.
27
Nigeria estimated 40,000 road deaths annually as of recent data.
28
In 2021, over 400,000 children died globally in road crashes.
29
U.S. fatality rate was 12.9 per 100,000 population in 2022.
30
In 2022, 22% of U.S. traffic deaths involved large trucks.
Interpretation
Fatalities Interpretation
For the Fatalities category, road deaths remain a global priority, with 1.19 million people killed in 2023 worldwide and the United States recording 42,514 motor vehicle fatalities in 2022, only slightly up 0.3% from 2021.
More related reading
04 · Category
Injuries29 stats
01
In 2021, there were over 5 million motor vehicle crashes in the U.S., resulting in 42,939 fatalities.
02
U.S. traffic crashes caused 5.25 million injuries in 2020.
03
Globally, road crashes injure 20-50 million people annually.
04
In the EU, 127,654 serious injuries from road accidents in 2022.
05
Australia reported 35,963 serious injuries in road crashes in 2022.
06
India saw 451,361 non-fatal injuries from road accidents in 2021.
07
Canada had 121,516 injury crashes in 2022.
08
Japan recorded 358,316 traffic injury cases in 2022.
09
Brazil reported 173,702 serious injuries from traffic accidents in 2021.
10
South Africa had 147,568 injuries in road crashes in 2022.
11
Germany saw 55,221 seriously injured in road accidents 2022.
12
UK reported 79,590 injury accidents in 2022.
13
China estimated 200,000 serious road injuries annually.
14
Mexico recorded 150,671 traffic injuries in 2022.
15
Florida had 279,000 injury crashes in 2022.
16
New York reported 118,256 injury-involved crashes in 2022.
17
Texas saw 188,000 serious injuries from crashes in 2022.
18
California had over 270,000 traffic injuries in 2022.
19
In U.S., 2.71 million people sought ER treatment for crash injuries in 2021.
20
U.S. saw 6 million police-reported crashes in 2021, many with injuries.
21
Pedestrians comprised 20% of U.S. crash injuries in 2022.
22
Motorcycle injuries totaled 82,000 in U.S. 2021.
23
France reported 69,911 injured in road accidents 2022.
24
Italy had 179,000 road injuries in 2022.
25
Sweden recorded 4,965 serious injuries in 2022.
26
Nigeria estimates 1 million road injuries yearly.
27
Globally, 90% of road injuries occur in low/middle-income countries.
28
U.S. injury rate from crashes was 785 per 100,000 in 2020.
29
15% of U.S. injury crashes involved large trucks in 2022.
Interpretation
Injuries Interpretation
Across locations, road traffic injuries are a persistent and massive problem, with the U.S. alone producing 5.25 million injuries in 2020 and globally affecting 20 to 50 million people each year, while 2022 data still shows 127,654 serious injuries in the EU and 35,963 in Australia.
05 · Category
Trends22 stats
01
U.S. fatalities rose 16% during pandemic 2020-2021.
02
Global road deaths down 3.6% from 2010-2021.
03
EU fatalities halved since 2001 to 2022.
04
Australia: 50% reduction in road deaths since 1970.
05
India: Road fatalities up 12% from 2016-2021.
06
Canada: 40% drop in fatalities since 1990.
07
Japan: Fatalities declined 60% from 2000-2022.
08
Brazil: Road deaths increased 20% last decade.
09
South Africa: Fatalities up 10% post-COVID.
10
Germany: 20% fatality reduction 2012-2022.
11
UK: 60% fewer deaths since 1979.
12
China: 30% decline in road fatality rate since 2010.
13
Mexico: Fatalities up 50% since 2010.
14
U.S. seat belt use at 91% in 2022, saving lives.
15
Airbags prevented 50,000+ U.S. deaths since 1980s.
16
U.S. pedestrian deaths up 77% since 2010.
17
Motorcycle deaths doubled in U.S. last 20 years.
18
Vision Zero cities saw 40% fatality drops.
19
Automatic emergency braking reduces rear crashes 50%.
20
U.S. fatality rate fell to 1.33 per 100M miles 2022.
21
Global helmet laws save 75% of motorcyclist lives.
22
Graduated licensing cut teen crashes 40%.
Interpretation
Trends Interpretation
Across the Trends landscape, progress is uneven because while global road deaths fell 3.6% from 2010 to 2021 and the EU fatalities have halved since 2001 to 2022, the U.S. saw a 16% rise in fatalities during 2020 to 2021 and India recorded a 12% increase from 2016 to 2021.
report visual · Key figures
Traffic accident impacts, and where risk concentrates
Accidents are driven by specific behaviors (e.g., impaired and distracted driving) and show meaningful differences across regions and groups—highlighting targeted prevention opportunities.
0.3%
In 2022, the United States recorded 42,514 motor vehicle traffic fatalities, representing a 0.3% increase from 2021 acco
2.1%
Canada recorded 1,931 road fatalities in 2022, down 2.1% from the previous year.
4.4%
In 2022, Germany had 2,788 road deaths, a decrease of 4.4% from 2021.
54%
Globally, 54% of road deaths are pedestrians.
26%
Canada: Distracted driving in 26% of fatal collisions 2022.
13,524
Drunk driving led to 13,524 U.S. fatalities and thousands of injuries in 2022.
Reference
Cite This Report
This report is designed to be cited. We maintain stable URLs and versioned verification dates. Copy the format appropriate for your publication below.
APA
Nathan Caldwell. (2026, February 13). Traffic Accident Statistics. Gitnux. https://gitnux.org/traffic-accident-statistics
MLA
Nathan Caldwell. "Traffic Accident Statistics." Gitnux, 13 Feb 2026, https://gitnux.org/traffic-accident-statistics.
Chicago
Nathan Caldwell. 2026. "Traffic Accident Statistics." Gitnux. https://gitnux.org/traffic-accident-statistics.
Sources & references
27 datasets cited across this report · attribution is report-level