GITNUX MARKETDATA
Browse Our Category
Waste Management Recycling
Latest update:

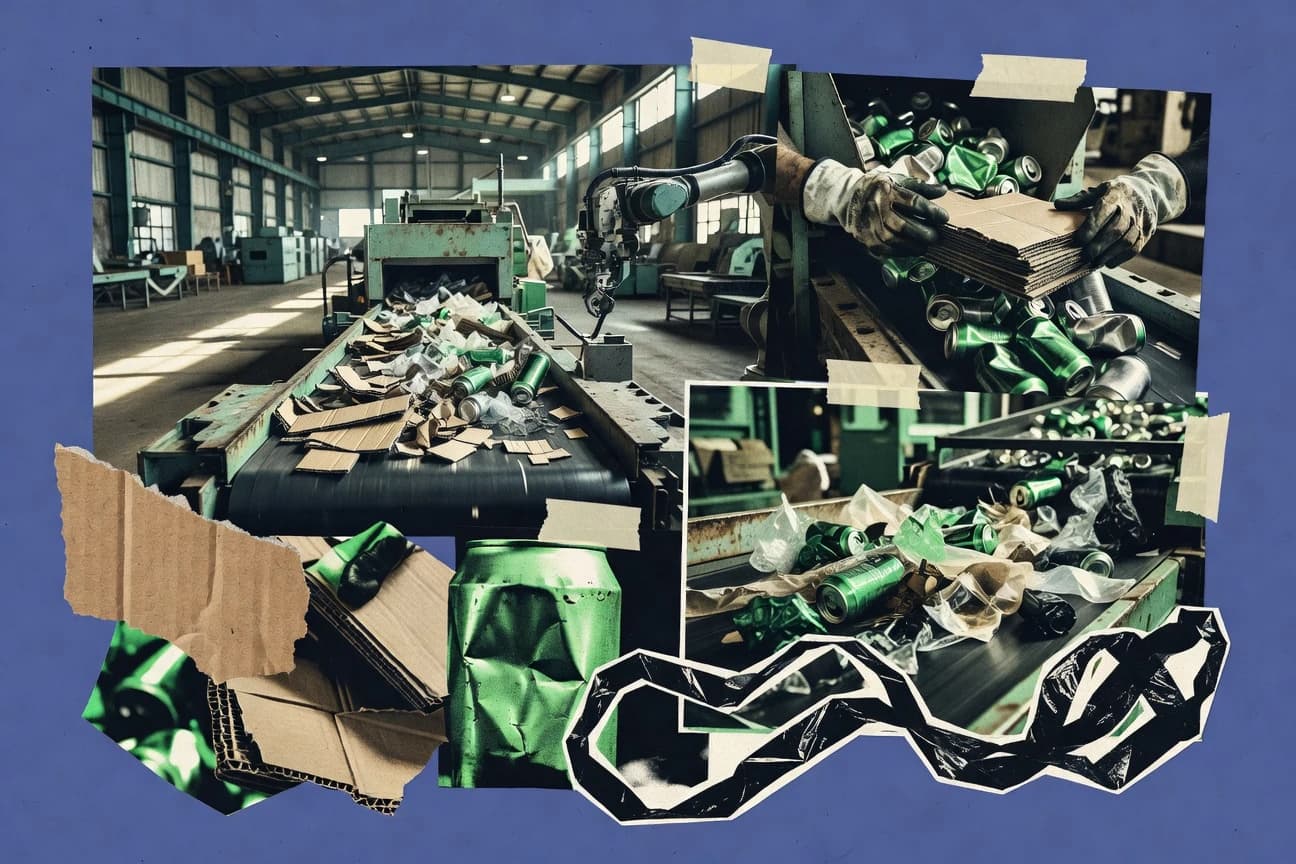
Recycling Industry Statistics
With global plastic recycling capacity running at just 50 percent and a mere 9 percent plastic recycling rate as of 2023, the page maps how contamination and quality bottlenecks keep materials from becoming new products. It also tracks what is working now with the US generating $117.4 billion in economic activity in 2021 alongside recycling rates that range from 32.1 percent in the US to 68.2 percent in Germany.

Electronic Recycling Statistics
As of 2025, e waste keeps climbing, and the gap between what gets recycled and what actually gets collected is widening fast. On this Electronic Recycling statistics page, you will see the latest figures that explain why the recovery rate still lags behind the volume of devices being discarded.

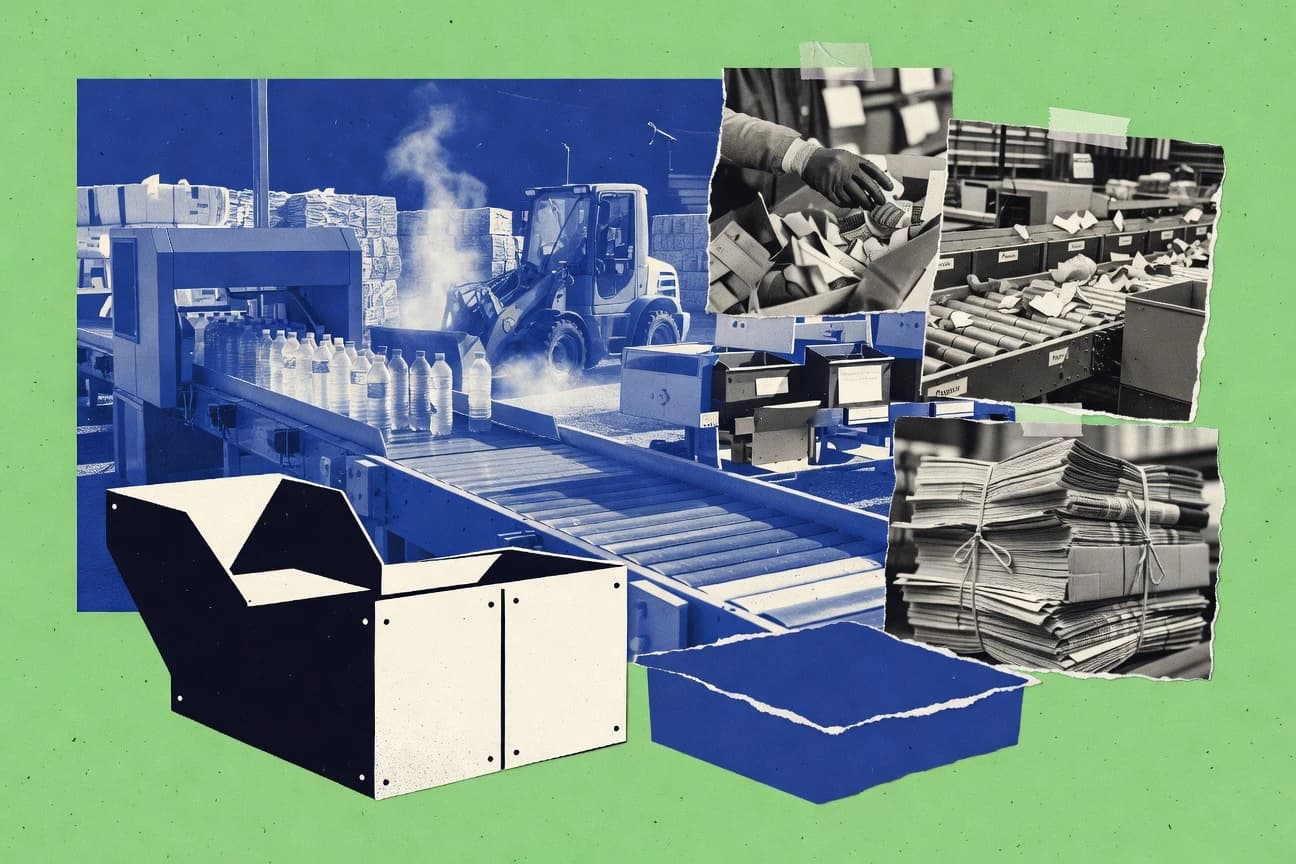
Waste Industry Statistics
Waste is projected to keep rising, from 2.01 billion metric tons globally in 2016 to 3.4 billion metric tons by 2050, while only about 9% of municipal waste is being recycled and roughly 33% ends up dumped. This page connects those outcomes to the real pressure points, including the waste sector’s 7% share of global greenhouse gas emissions and the gap in safely managed sanitation, so you can see exactly where material losses turn into climate and public health costs.
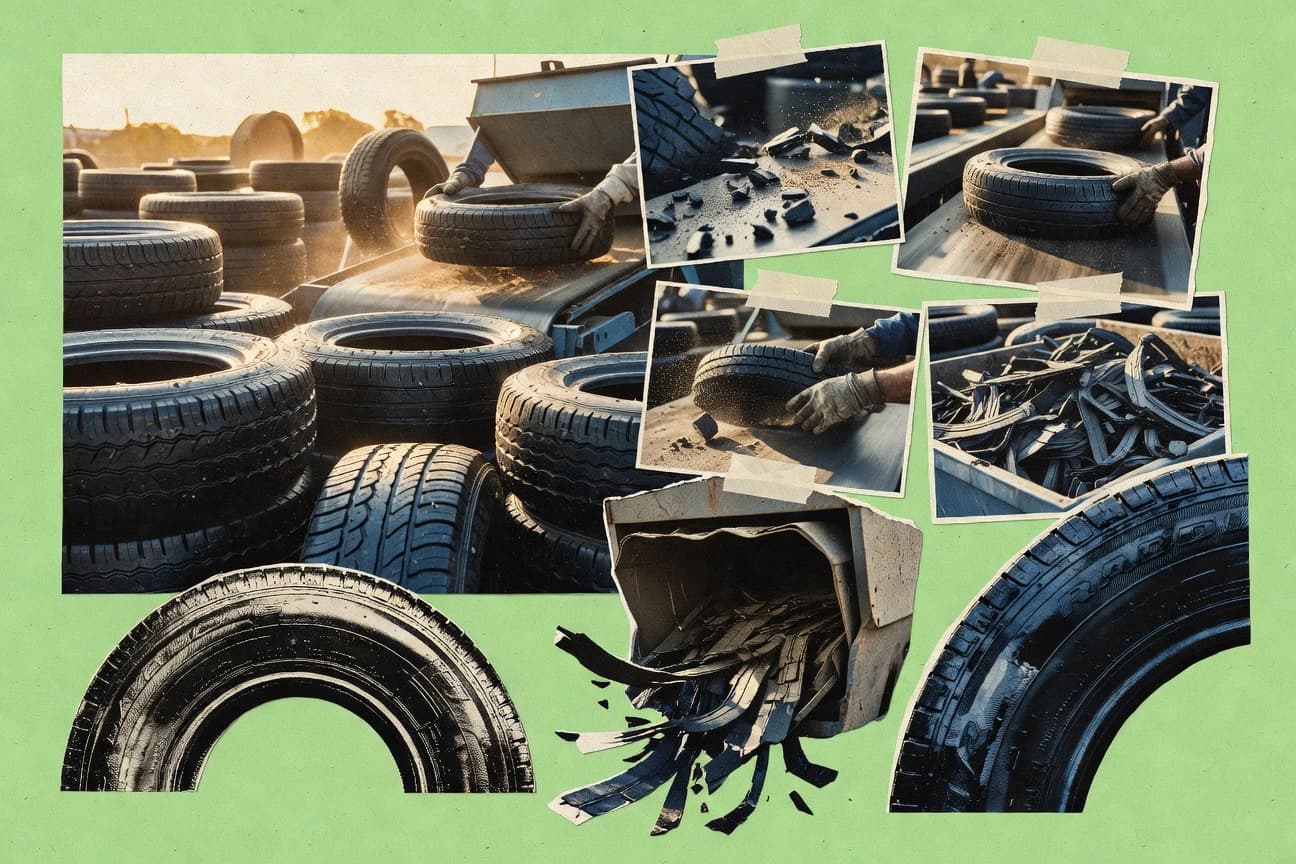
Tire Waste Statistics
Tire waste is costing money and health at the same time, with U.S. cleanup and tire fire damages running into the hundreds of millions each year even as recycling can save $1.5B in disposal costs annually. See how markets are scaling, from a $12B global tire recycling forecast to crumb rubber at $0.20 per lb, alongside the pollution tradeoffs like tire smoke particulate and landfill leachate that can outlast disposal itself.

Coffee Cup Waste Statistics
Every coffee cup has an ocean afterlife you can measure in particles, emissions, and microplastics that can harm 80% of marine life, while only 1% of cups globally end up recycled and 99% are dumped in landfill. This Coffee Cup Waste page pairs startling production, waste, and city level figures with the stark reality that even in places like London where only 0.5% of cups are recycled, the streets keep getting littered with millions of cups every year.
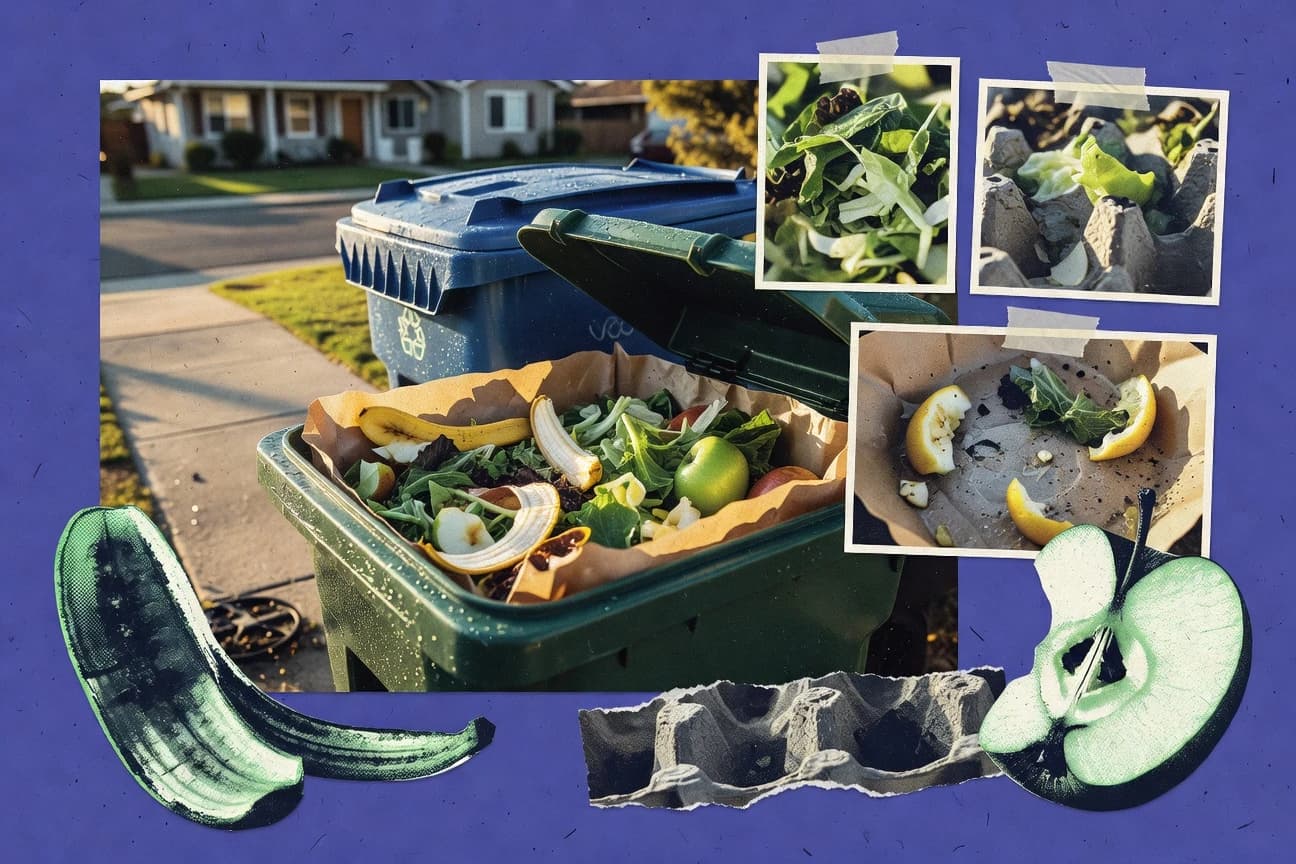
California Food Waste Statistics
California’s food waste still lands in landfills and costs billions, with 3.8 million tons landfilled in 2021 and $10 billion in yearly economic losses tied to retail to consumer waste. The page also tracks how SB 1383 raised the 2022 diversion rate to 28 percent, plus the state wide climate and public health ripple effects that come from missed recovery.
Waste Management Industry Statistics
Waste management is a double edged climate lever, from composting that cuts methane emissions by up to 80 percent and recycling that saves 95 percent energy for aluminum to a sector that still drives about 5 percent of global GHG emissions and sends ocean plastic 80 percent from land sources. Follow the tradeoffs and the momentum with today’s scale and growth signals, including global industry market expansion to USD 1.94 trillion by 2030 and landfill systems that capture 64 billion cubic feet of methane a year in the US.
Junk Removal Industry Statistics
Junk Removal Industry statistics reveal how rapidly pricing, disposal habits, and service demand are shifting, with 2026 figures already pointing to a noticeably different market than last year. Read these data driven takeaways to spot what is changing for customers and operators and what that means for smarter, faster junk removal decisions.