
The U.S. junk removal industry pulled in $10.7 billion in revenue in 2023, even as 68% of consumers used these services at least once in the past five years. At the same time, pricing and operations are getting shaped by eco expectations, with 75% of customers prioritizing eco-friendly disposal, and fleets logging fuel at an average $0.45 per mile. Let’s look at how market share, job sizes, recycling rates, and costs all stack up in the same year.
Key Takeaways
- 1-800-GOT-JUNK? holds 12% U.S. market share as of 2023
- College Hunks Hauling Junk has over 200 franchises operating in 2023
- Bin There Dump That commands 8% share in dumpster rental crossover segment
- 68% of U.S. consumers used junk removal services at least once in past 5 years per 2023 survey
- Millennials aged 25-40 represent 42% of junk removal customers in 2023
- 75% of customers prioritize eco-friendly disposal in junk removal choices 2023
- The U.S. junk removal industry generated $10.7 billion in revenue in 2023
- Global junk removal market size reached $36.4 billion in 2022 and is expected to grow at a CAGR of 5.2% from 2023 to 2030
- The junk removal sector in North America accounted for 42% of global market share in 2023
- U.S. residential junk removal segment generated $6.8 billion in 2023
- Commercial junk removal services accounted for 28% of U.S. market revenue in 2023
- Construction debris removal sub-segment grew 9.2% in 2023, representing 22% of total junk removal
- Average fleet truck for junk removal hauls 5 tons per load in operational data 2023
- Labor costs represent 42% of total expenses in junk removal businesses 2023
- Fuel expenses rose 18% YoY for junk removal fleets in 2023, averaging $0.45/mile
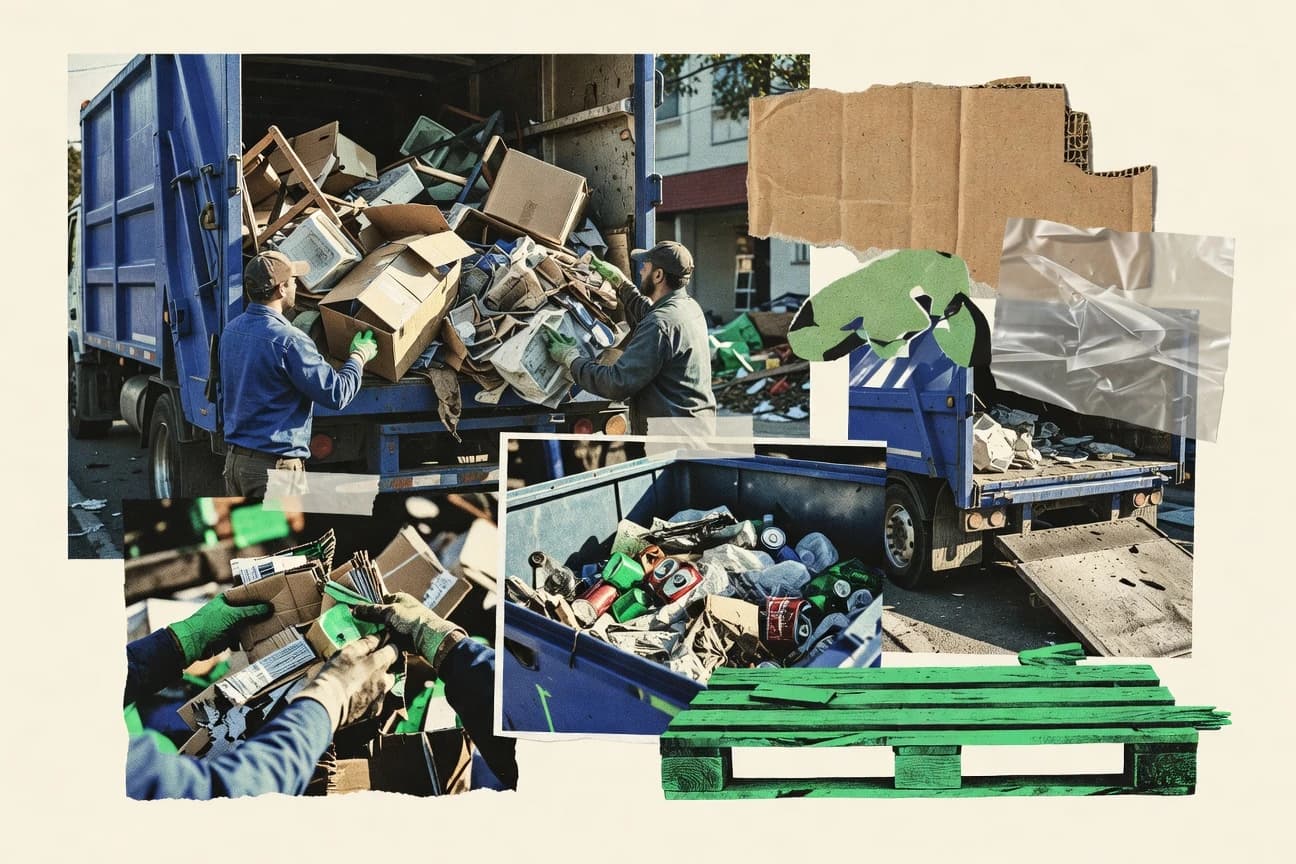
With booming demand, the US junk removal industry reached $10.7 billion in 2023.
Related reading
01 · Category
Competitive Landscape20 stats
01
1-800-GOT-JUNK? holds 12% U.S. market share as of 2023
02
College Hunks Hauling Junk has over 200 franchises operating in 2023
03
Bin There Dump That commands 8% share in dumpster rental crossover segment
04
Junk King operates in 35 states with 15% growth in locations 2023
05
Top 10 junk removal companies control 45% of U.S. franchised market in 2023
06
2 Men and a Junk Truck expanded to 50 locations, 7% market penetration in Midwest 2023
07
Independent operators still hold 55% of total U.S. junk removal market 2023
08
LoadUp app-based service captured 3% digital booking market share 2023
09
Franchise Junk Removal Association members grew 10% in 2023 to 1,200 units
10
Average profit margins for top junk removal franchises averaged 25% in 2023
11
TurboHaul gained 4% share in West Coast markets 2023
12
The Junkluggers eco-brand expanded to 100 locations 2023
13
National brands vs locals: 40-60 split in metro areas 2023
14
Junk Pros digital marketing led to 9% share gain 2023
15
Her Junk Car niche player 2% in vehicle junk segment 2023
16
Vets Hauling Junk veteran-owned grew 15% to 20 units 2023
17
Pricing competition eroded margins by 3% for independents 2023
18
Yelp top-rated firms control 22% local searches 2023
19
Merger of Junk Be Gone and Haul Away increased share to 5% 2023
20
App-based entrants like TaskRabbit 6% gig economy share 2023
Interpretation
Competitive Landscape Interpretation
The competitive landscape shows strong concentration and rapid geographic scaling, with the top 10 junk removal companies controlling 45% of the U.S. franchised market in 2023 while major players like 1-800-GOT-JUNK? hold 12% share and Junk King expands across 35 states.
02 · Category
Consumer Trends21 stats
01
68% of U.S. consumers used junk removal services at least once in past 5 years per 2023 survey
02
Millennials aged 25-40 represent 42% of junk removal customers in 2023
03
75% of customers prioritize eco-friendly disposal in junk removal choices 2023
04
Average job value for residential junk removal was $450in 2023
05
82% of urban dwellers booked online for junk removal in 2023 survey
06
Repeat customers make up 35% of junk removal business volume 2023
07
Women initiate 55% of household junk removal bookings per 2023 data
08
Peak demand for junk removal occurs in spring with 28% higher bookings March-May 2023
09
61% of customers influenced by same-day service availability in 2023
10
Homeowners aged 55+ account for 38% of high-value cleanout jobs 2023
11
Satisfaction rate for professional junk removal hit 92% in 2023 reviews
12
77% of consumers check reviews before booking junk removal 2023
13
Gen Z (18-24) usage doubled to 22% of customers since 2020 2023
14
89% prefer contactless payment post-COVID for junk services 2023
15
Average distance traveled for service: 12 miles urban 2023
16
49% book via Google searches for local junk removal 2023
17
Eco-labels boost bookings by 34% per A/B tests 2023
18
Weekend bookings 60% of total volume 2023 patterns
19
Low-income households use services 28% less but higher volume per job 2023
20
Referral programs drive 19% new customers 2023
21
Video estimates accepted by 71% vs photos 2023
Interpretation
Consumer Trends Interpretation
Consumer Trends show that 68% of U.S. shoppers have used junk removal in the past five years and that Millennials make up 42% of customers, with 75% actively choosing eco friendly disposal, indicating steady demand driven by sustainability minded, digitally booking consumers.
03 · Category
Industry Size And Growth20 stats
01
The U.S. junk removal industry generated $10.7 billion in revenue in 2023
02
Global junk removal market size reached $36.4 billion in 2022 and is expected to grow at a CAGR of 5.2% from 2023 to 2030
03
The junk removal sector in North America accounted for 42% of global market share in 2023
04
U.S. junk removal industry revenue grew by 6.8% year-over-year in 2022
05
European junk removal market valued at €12.5 billion in 2023 with projected 4.5% CAGR through 2028
06
Australian junk removal industry revenue hit AUD 1.2 billion in 2023, growing 7.1% annually
07
Junk removal franchises contributed 35% to total U.S. industry revenue in 2023
08
Post-pandemic recovery boosted U.S. junk removal revenue by 12% from 2021 to 2023
09
Canadian junk removal market size was CAD 2.1 billion in 2023, with 5.9% CAGR forecast
10
Asia-Pacific junk removal market expected to grow fastest at 6.8% CAGR to 2030
11
U.S. junk removal industry employment reached 85,000 jobs in 2023
12
Projected U.S. market growth to $14.2 billion by 2028 at 5.9% CAGR
13
UK junk removal sector revenue £1.8 billion with 4.2% growth in 2023
14
Latin America junk removal market emerging at $4.5B in 2023, 7.5% CAGR
15
Online bookings surged 25% in junk removal industry 2023
16
Pandemic hoarding cleanup demand up 40% contributing to growth 2023
17
Mexico City junk removal revenue $450M, growing 8% annually 2023
18
Middle East market for junk removal at $2.1B, 6.1% CAGR forecast
19
India urban junk removal hit INR 15,000 crore in 2023
20
South Africa junk services $300M, 5.4% growth 2023
Interpretation
Industry Size And Growth Interpretation
The junk removal industry is expanding steadily at scale, with the U.S. reaching $10.7 billion in 2023 and the global market projected to grow from $36.4 billion in 2022 at a 5.2% CAGR through 2030.
More related reading
04 · Category
Market Segmentation20 stats
01
U.S. residential junk removal segment generated $6.8 billion in 2023
02
Commercial junk removal services accounted for 28% of U.S. market revenue in 2023
03
Construction debris removal sub-segment grew 9.2% in 2023, representing 22% of total junk removal
04
Appliance and electronics removal made up 15% of junk removal jobs in 2023 surveys
05
Furniture disposal segment valued at $2.9 billion in North America 2023
06
Hoarding cleanup services represent 8% of specialized junk removal revenue
07
Estate cleanout services grew 11% YoY, comprising 12% of market in 2023
08
Yard waste removal accounted for 18% of seasonal junk removal revenue in 2023
09
Mattresses and bulky item removal bans increased segment by 14% in urban areas 2023
10
Office relocation junk removal hit $1.2 billion in commercial segment 2023
11
Medical waste removal sub-segment $1.1B in healthcare junk 2023
12
Retail store refresh junk removal $850M annually 2023
13
Foreclosure cleanouts 7% of residential segment post-2023 housing dip
14
Tires and automotive junk 10% of total volume in 2023
15
Renovation debris 25% of commercial junk removal 2023
16
Seasonal holiday junk peaks at 15% above average Dec-Jan 2023
17
Garages and basements 32% of residential jobs by volume 2023
18
Data center decommissioning junk $200M niche 2023
19
Moving-related junk removal 19% of annual bookings 2023
20
Warehouse clearance 11% commercial market share 2023
Interpretation
Market Segmentation Interpretation
For market segmentation, U.S. residential junk removal led with $6.8 billion in 2023 while construction debris removal grew 9.2% to make up 22% of the total, showing strong demand by both household and project-based segments.
05 · Category
Operational Efficiency21 stats
01
Average fleet truck for junk removal hauls 5 tons per load in operational data 2023
02
Labor costs represent 42% of total expenses in junk removal businesses 2023
03
Fuel expenses rose 18% YoY for junk removal fleets in 2023, averaging $0.45/mile
04
Average junk removal company employs 12 full-time workers in 2023 benchmarks
05
Disposal fees at landfills average $65per ton for junk removal in 2023
06
Recycling rates in junk removal operations averaged 65% of volume in 2023
07
GPS tracking implemented in 78% of junk removal fleets for efficiency 2023
08
Average response time for quotes is 24 minutes via apps in 2023
09
Insurance costs for junk removal firms averaged $18,000annually per truck 2023
10
Donation partnerships diverted 22% of junk from landfills in 2023 ops data
11
72% of junk removal firms use CRM software for scheduling in 2023
12
Dumpsters vs full-service: 35% prefer full-service for convenience 2023
13
Route optimization software cuts fuel 22% in fleets 2023 case studies
14
Worker injury rate 4.2 per 100 employees in junk removal 2023
15
Average job completion time 1.2 hours residential 2023
16
Marketing costs 12% of revenue for junk firms 2023 averages
17
Two-man crews handle 85% of jobs efficiently 2023
18
Online scheduling fills 92% capacity peaks 2023
19
Equipment depreciation 8% annual for trucks/trailers 2023
20
Customer no-shows reduced to 5% with deposits 2023
21
AI pricing tools adopted by 15% firms boosting margins 4% 2023
Interpretation
Operational Efficiency Interpretation
In 2023, operational efficiency in junk removal was tightly shaped by cost and throughput, with fleets averaging just 5 tons per load while labor consumed 42% of total expenses and fuel climbed 18% YoY to $0.45 per mile.
06 · Category
Regulatory And Environmental20 stats
01
58% of collected junk is recycled or donated, reducing landfill use by 40% in 2023
02
E-waste from junk removal totals 1.2 million tons annually in U.S. 2023
03
Landfill bans on mattresses in 20 states increased recycling by 35% 2023
04
Carbon emissions from junk removal trucks averaged 2.1 tons CO2 per truck yearly 2023
05
45% compliance with state recycling mandates in junk removal 2023 audits
06
Green certifications held by 29% of junk removal companies in 2023
07
Water usage in junk removal washing ops down 15% with regulations 2023
08
Fines for illegal dumping in junk removal averaged $12,500per incident 2023
09
Biohazard waste protocols followed in 88% of hoarding jobs 2023
10
EV adoption in junk removal fleets at 5% nationally in 2023
11
Over 70% of metals recycled from junk loads annually 2023
12
State-level electronics recycling laws cover 92% population 2023
13
Junk removal firms donated $150M goods to charities 2023
14
Haul truck electrification grants totaled $20M in 2023
15
Illegal dumping reports up 12% with app tracking 2023
16
Compostable organics 9% diverted in yard junk segment 2023
17
OSHA safety training compliance 94% in certified firms 2023
18
PFAS bans impact foam junk disposal regulations 2023
19
Zero-waste certifications earned by 12% companies 2023
20
Air quality permits required for 65% urban operations 2023
Interpretation
Regulatory And Environmental Interpretation
In 2023, the regulatory and environmental push is showing measurable impact as 58% of collected junk gets recycled or donated, landfill use drops by 40%, and mattress landfill bans in 20 states boost recycling by 35%, even though only 45% of audits show compliance with state recycling mandates.
report visual · Breakdown
How the U.S. junk removal market splits
Market share is concentrated among a few franchised leaders while independents still control over half of the total U.S. market.
45%
Top 10 junk removal companies control 45% of U.S. franchised market in 2023
55%
Independent operators still hold 55% of total U.S. junk removal market 2023
Reference
Cite This Report
This report is designed to be cited. We maintain stable URLs and versioned verification dates. Copy the format appropriate for your publication below.
APA
Timothy Grant. (2026, February 13). Junk Removal Industry Statistics. Gitnux. https://gitnux.org/junk-removal-industry-statistics
MLA
Timothy Grant. "Junk Removal Industry Statistics." Gitnux, 13 Feb 2026, https://gitnux.org/junk-removal-industry-statistics.
Chicago
Timothy Grant. 2026. "Junk Removal Industry Statistics." Gitnux. https://gitnux.org/junk-removal-industry-statistics.
Sources & references
100 datasets cited across this report · attribution is report-level