GITNUX MARKETDATA
Browse Our Category
AI In Industry
Latest update:


AI In The Restaurant Industry Statistics
Restaurants are sitting on a huge incentive set for AI right now, with $997.7 billion in global restaurant revenue in 2023 and a software backdrop growing toward $28.74 billion in global AI in retail, yet 80% of AI projects still fail to land fully. This page connects those stakes to what actually changes operations, from potential 20% less food waste with better forecasting and 15 to 20% higher order accuracy to the real-world cost and risk numbers that decide whether chatbots and automation earn their keep.

AI In The Credit Card Industry Statistics
See how AI is reshaping credit card risk and decisioning, with the latest 2026 signals pointing to faster, more precise underwriting than the industry was relying on before. The page pairs those performance gains with the real tradeoffs in approval behavior, fraud pressure, and model drift so you can judge what’s changing and what might be slipping.
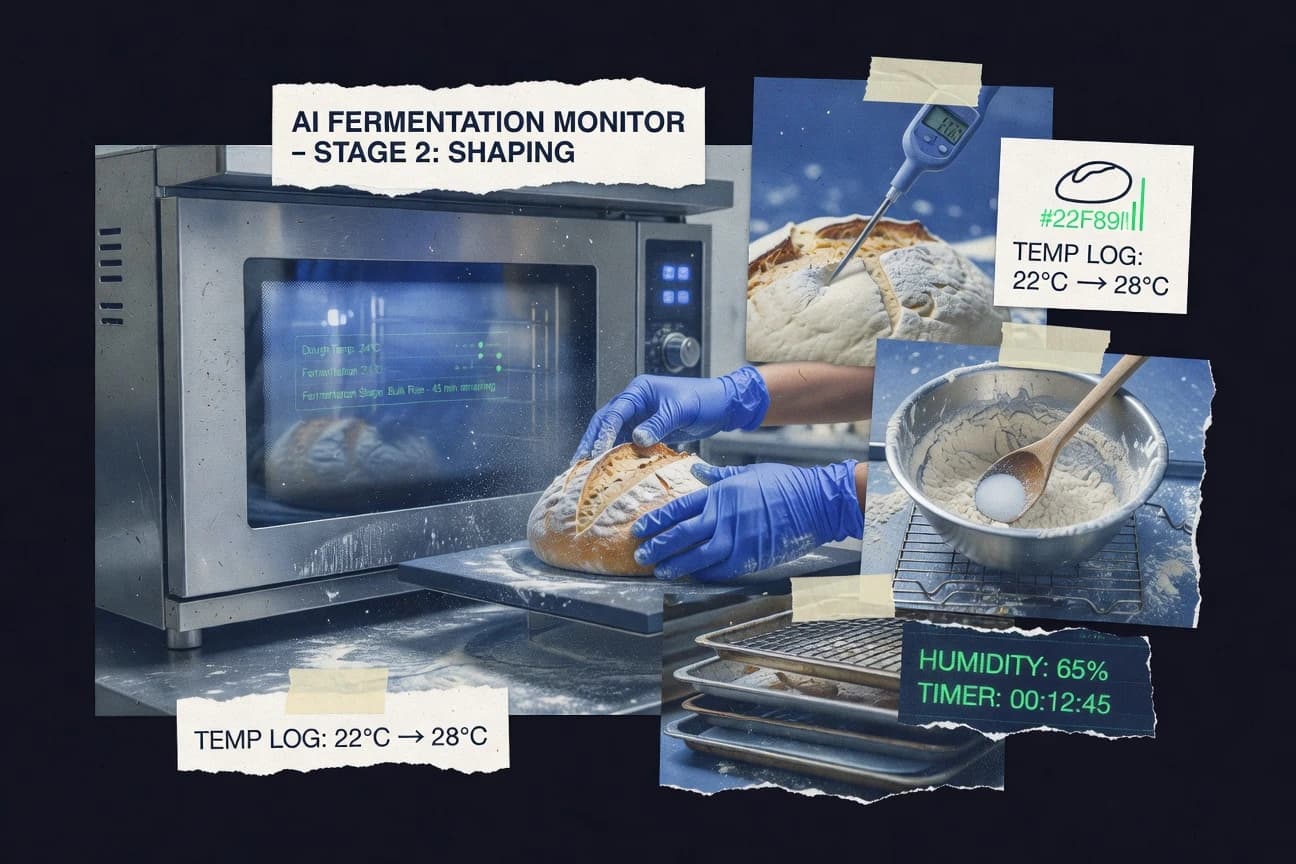
AI In The Baking Industry Statistics
AI is already shifting bakery production from guesswork to measurable control, with computer vision quality inspection cutting scrap and rework by 20 to 50 percent and AI process control reducing temperature time errors by 30 to 60 percent. Meanwhile, executives still debate the jobs impact, but 60 percent say AI will create new roles rather than eliminate them, even as data quality blocks 35 percent of projects.

AI In The Accommodation Industry Statistics
Hotel operators are planning bigger AI bets for 2025 while guests already notice the difference, with 28% saying they would pay more for a more personalized stay. At the same time, data protection remains the pressure point, since GDPR penalties can reach 4% of annual global turnover and 74% of organizations expect tighter AI risk rules within 24 months.

AI In The Global Mining Industry Statistics
Mining is responsible for only 2.6% of global electricity use, yet the same industry is chasing double digit efficiency and recovery gains through AI energy optimization, grade control, and predictive maintenance, with major commercial momentum like a US$4.6 billion AI in mining forecast for 2024 and US$8.0 billion by 2030. This page pairs that upside with hard constraints like a 76% AI governance gap and higher cyber risk, plus 2.7 times higher tailings dam failure probability in extreme rainfall, so you can see where AI pays off and where it can quietly add exposure.

AI In The Travel Agent Industry Statistics
Travel agents are being reshaped by AI at a pace that shows up in the latest 2025 and 2026 figures, with automation gains colliding against customer expectations for speed and personalization. Read these statistics to see where efficiency is actually improving bookings and where it is straining trust.

AI In The Securities Industry Statistics
From $6.5 billion in global AI spend in financial services to 3.0x faster AI based analytics in wealth operations, these securities focused stats show where AI is already paying off and where it still costs time, risk, or money. You will see how model governance, bias remediation, and compliance monitoring moved from pilot to production, alongside the hard security and oversight gaps that can make or break real world deployment.
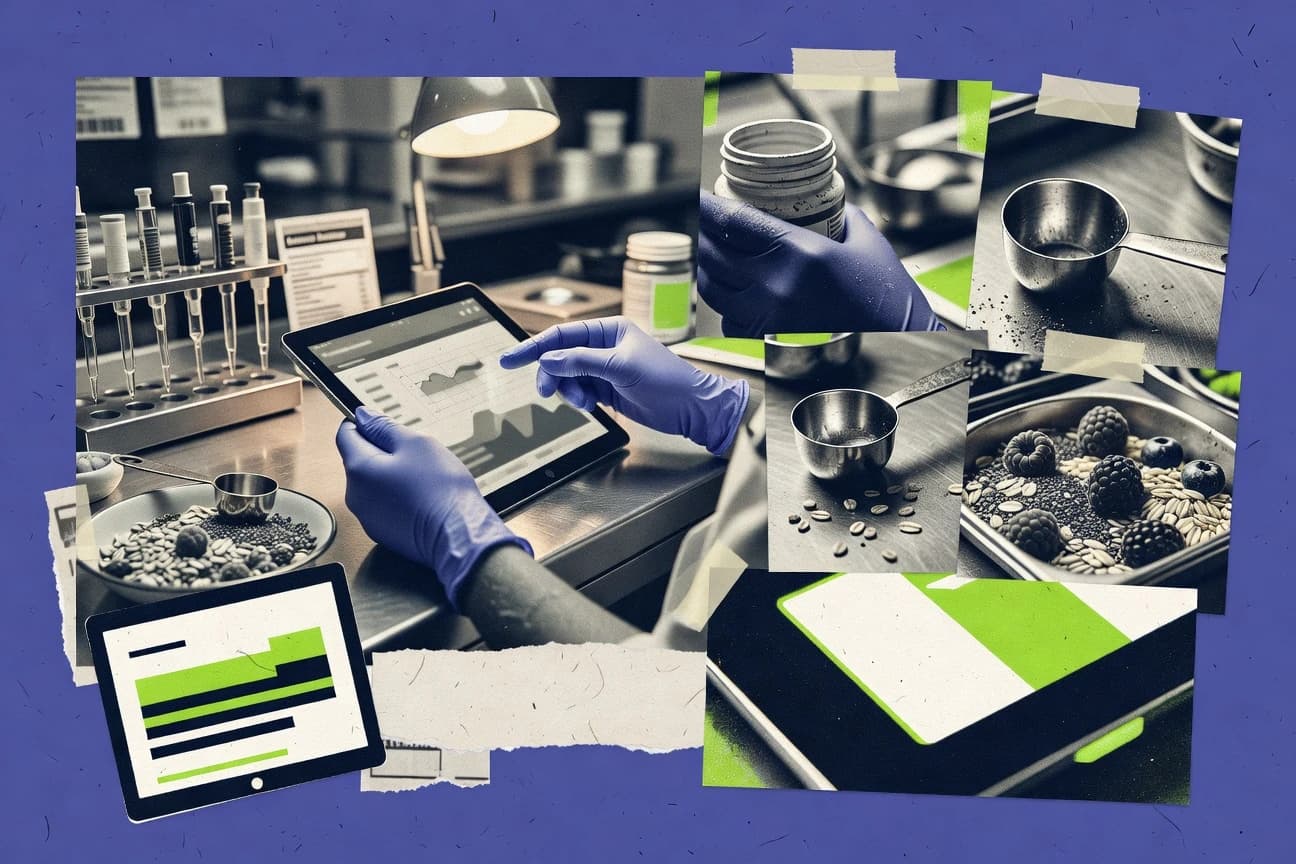
AI In The Nutrition Industry Statistics
See how AI is reshaping nutrition decision making, from supply chain timing to the way recommendations are generated and checked. The most up to date figures in this AI in the nutrition industry statistics page show a sharp shift in adoption and measurable operational impact, making it worth reading before the gap widens between what’s promised and what’s delivered.
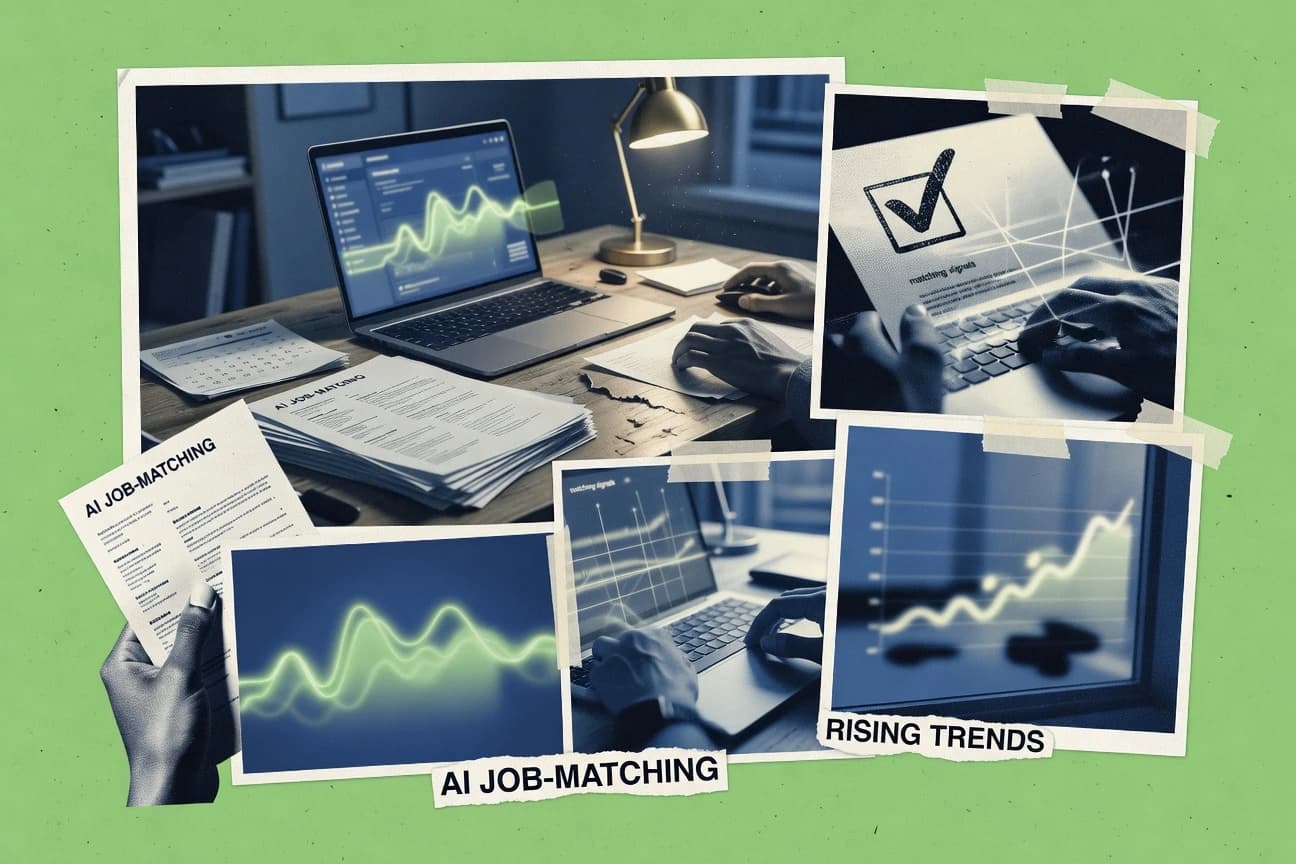
AI In The Job Industry Statistics
Worldwide AI software revenue is up 35% year over year in 2024 to about $14.5 billion, while hiring processes are still facing a trust gap, with 69% of job seekers worried AI screening could be unfair if it is not properly checked. This page connects the policy and compliance reality of EU “high risk” employment AI to measurable workplace outcomes like a 43% faster time to hire and shows why recruiters are racing ahead even as workers question whether automation will replace them.

AI In The Cpg Industry Statistics
CPG leaders are betting on an AI edge, with 73% of executives expecting competitive advantage and 80% of customer service organizations forecast to use at least one generative AI capability by 2026, while shoppers increasingly reward personalization with 35% more likely to buy. The page connects that pressure to hard operational wins across support, supply chain optimization, and retail analytics, so you can see where AI adoption is accelerating and where regulation and ROI still create friction.

AI In The Consumer Product Industry Statistics
Consumer product leaders are steadily shifting how AI shows up in real operations, with 2026 benchmarks revealing which use cases are moving from experiments to measurable performance. Read these statistics to see the gap between flashy pilots and what actually scales, plus the tradeoffs that emerge when budgets, supply chains, and customer expectations collide.

AI In The Meal Kit Industry Statistics
AI is already reshaping meal kit profit and customer experience, from reducing customer service costs by up to 30% and cutting pricing errors by as much as 20% to lowering warehouse energy use by 10 to 20%. With US revenue estimated at $2.6B in 2019 and rising through online grocery and meal kit demand, the more surprising signal is how adoption is surging while data quality remains a hidden bottleneck with up to 30% of revenue at risk.

AI In The Global Financial Industry Statistics
AI is already reshaping global finance, with 2025 figures showing how quickly adoption and operational impact are moving from pilots to measurable outcomes. The page pulls the clearest contrasts across investment, risk, and productivity so you can see where AI delivers fastest and where it still creates friction.

Gen AI Industry Statistics
Gen AI industry benchmarks are moving faster than the hype, with 2026 projections showing where spending, adoption, and hiring are actually concentrating next. Get the clearest snapshot of the shift, using the latest figures to separate near term momentum from what quietly stalled.

AI In The Tech Industry Statistics
See how AI is reshaping tech work in 2025, with adoption rising even as budgets and governance tighten. If you want a grounded read on what is actually changing behind the rollout headlines, these stats make the tradeoffs impossible to ignore.

AI In The Elearning Industry Statistics
With 43% of organizations now planning to use generative AI for learning and development in 2024, the AI education market is simultaneously swelling from $8.1 billion in 2023 to a projected $18.6 billion in 2024, even as classroom outcomes keep ticking up. This page connects the scale of adoption to hard learning effects like a 24% cut in time to competency and a 38% drop in instructor grading time, so you can see where AI actually changes the workflow and where it is still catching up.

AI In The Pet Care Industry Statistics
With the US pet care market projected to reach $300.8 billion in 2025, this page shows where AI is already proving value across EMR ready workflows, imaging faster triage, and documentation automation that hits a 0.86 F1 score on unstructured notes. It also pairs performance breakthroughs like 0.87 sensitivity and 0.90 specificity on radiograph abnormalities with the hard reality that 92% of organizations worry about AI model risk, revealing why slow governance and uneven data quality can still throttle what the money could otherwise fund.

AI In The Eyewear Industry Statistics
In 2025, AI-driven optical design and smart retail tools are shifting eyewear decisions from gut feel to measurable outcomes, changing how frames are chosen, stocked, and priced. The page tracks the numbers behind that shift so you can see where automation is paying off and where it’s still falling short.

AI In The Heavy Machinery Industry Statistics
See how AI is reshaping heavy machinery decisions with the latest 2025 and 2026 benchmarks, where gains in predictive maintenance and machine uptime are starting to outweigh the cost of deployment. The contrast is stark, fewer shutdowns and faster troubleshooting are rising alongside sharper workforce and supply chain impacts, making the statistics impossible to ignore.

AI Quality Assurance Testing Industry Statistics
See how AI quality assurance testing budgets and model verification practices shifted by 2025, and why the cost of late defects is rising even as teams automate more tests. You will also spot the measurable gap between what models promise and what passes QA, with 2025 benchmarks that make the tradeoffs impossible to ignore.