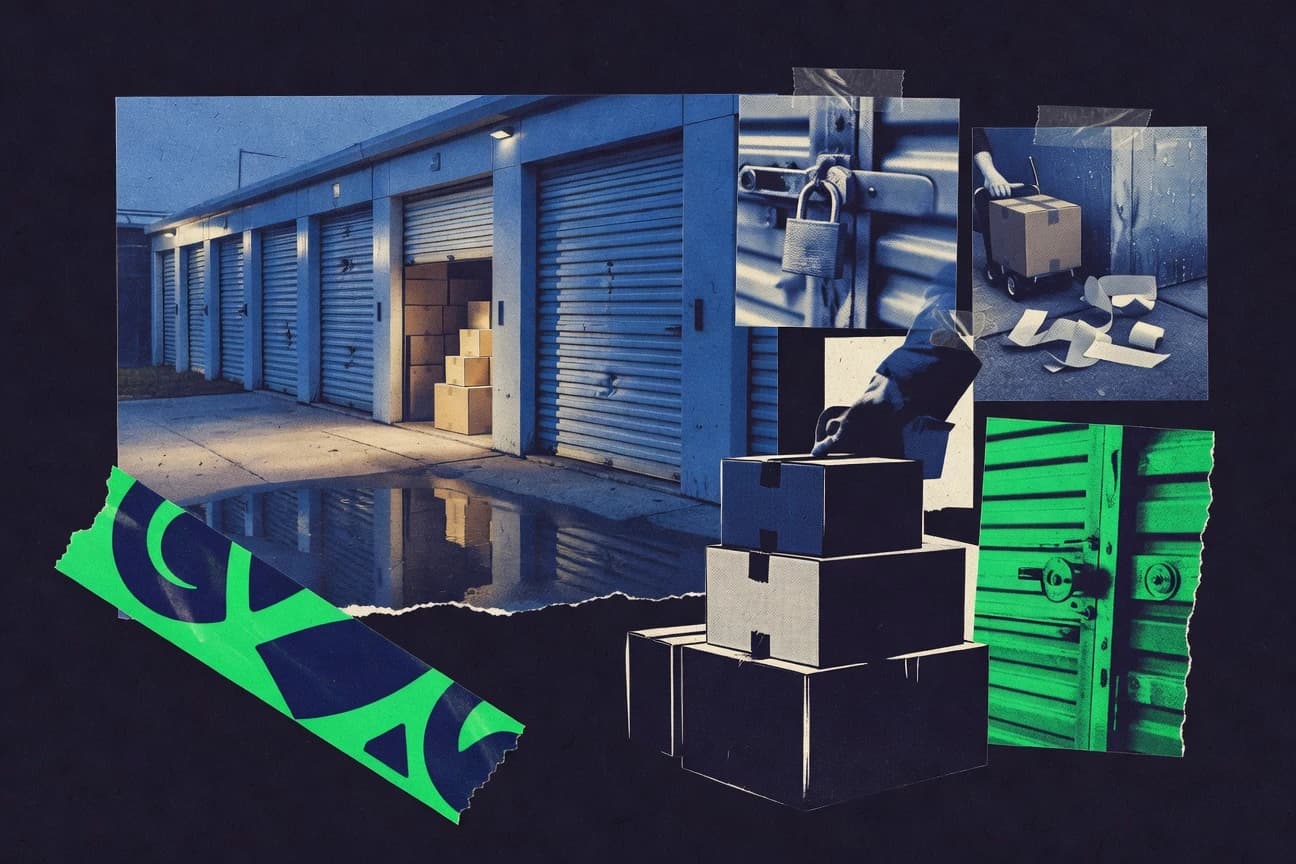

Eleven percent of U.S. households rent self-storage units each year. Occupancy reaches 92 percent in major markets even with new facilities under construction. The statistics below cover customer demographics, revenue totals, and facility operations.
Key Takeaways
- 27% of U.S. renters use self-storage for moving-related needs.
- The U.S. self-storage industry reached a total market size of $22.9 billion in 2023, reflecting a compound annual growth rate (CAGR) of 4.2% from 2018 to 2023.
- U.S. self-storage operating expenses averaged 35% of revenue in 2023.
- The U.S. has over 52,000 self-storage facilities supplying 2.1 billion rentable square feet as of 2023.
- AI adoption in self-storage operations reached 15% in 2023 for pricing optimization.
Self storage demand continues to grow, making this a resilient investment and business opportunity.
Related reading
01 · Category
Customer & Usage30 stats
01
27% of U.S. renters use self-storage for moving-related needs.
02
Average self-storage rental duration in the U.S. is 14.5 months as of 2023 survey data.
03
45% of self-storage customers are aged 25-44, per 2023 industry demographics.
04
Women represent 52% of self-storage unit renters in the U.S., based on 2023 data.
05
18% of U.S. college students use self-storage annually for dorm transitions.
06
Average monthly self-storage spend per U.S. customer is $85in 2023.
07
62% of self-storage users cite decluttering as primary reason in 2023 surveys.
08
Military personnel account for 10% of self-storage demand in U.S. markets near bases.
09
Online reservations make up 35% of new self-storage rentals in 2023.
10
29% of renters use self-storage for business inventory overflow.
11
Average household income of self-storage renters is $65,000USD in 2023.
12
41% of customers rent climate-controlled units, up from 32% in 2019.
13
Peak rental months are June-August, comprising 38% of annual move-ins.
14
15% churn rate monthly for self-storage customers in urban U.S. markets 2023.
15
Seniors (65+) represent 12% of self-storage users, often for downsizing.
16
Vehicle storage units saw 22% demand increase among customers in 2023.
17
67% of customers discover facilities via online search in 2023.
18
Average units rented per multi-unit customer: 1.8 in U.S. 2023 data.
19
UK self-storage customers average 3.2-month stays for short-term needs.
20
24% of Australian self-storage use is for wine and collectibles storage.
21
21% of U.S. self-storage customers are businesses, per 2023 SSA survey.
22
Average unit size rented: 120 sq ft in U.S. 2023.
23
33% of customers rent for home renovation projects.
24
Gen Z (18-24) self-storage usage doubled to 14% since 2019.
25
Boat storage demand up 16% among coastal customers 2023.
26
55% of renters pay via auto-debit, reducing delinquencies 40%.
27
Document storage units: 8% of total rentals, steady demand.
28
Referral rate: 28% of new customers from existing ones 2023.
29
Peak vacate season: December-February, 32% of turnovers.
30
Luxury storage for high-value items grew 9% in affluent markets.
Interpretation
Customer & Usage Interpretation
The self-storage industry has become America's collective attic, basement, and purgatorial waiting room, where our stuff—from decluttered clutter and business inventory to boats and wine collections—lingers for an average of 14.5 months while we pay $85 a month to avoid making a final decision about it.
02 · Category
Market Size & Revenue30 stats
01
The U.S. self-storage industry reached a total market size of $22.9 billion in 2023, reflecting a compound annual growth rate (CAGR) of 4.2% from 2018 to 2023.
02
Global self-storage market revenue was estimated at $42.3 billion in 2022, projected to grow at a CAGR of 7.1% through 2030.
03
In 2023, the self-storage sector in the UK generated £1.2 billion in revenue, up 5.3% year-over-year.
04
Australia's self-storage industry revenue hit AUD 1.8 billion in 2023, with a 6% annual growth since 2019.
05
Europe’s self-storage market size stood at €5.6 billion in 2022, expected to expand at 5.8% CAGR to 2028.
06
U.S. self-storage operators reported $21.4 billion in customer revenues for 2022, excluding ancillary income.
07
The Canadian self-storage market generated CAD 2.1 billion in 2023, growing 4.7% from 2022.
08
Asia-Pacific self-storage revenue reached $8.7 billion in 2023, driven by urbanization in China and Japan.
09
In 2023, Public Storage alone contributed $4.5 billion to U.S. self-storage revenues, representing 20% market share.
10
The self-storage industry's total revenue per square foot in the U.S. averaged $18.50in 2023.
11
U.S. self-storage net operating income (NOI) totaled $13.2 billion in 2023 across 50,000+ facilities.
12
Brazil's emerging self-storage market revenue was BRL 450 million in 2023, with 15% YoY growth.
13
REIT-owned self-storage properties generated $15.8 billion in U.S. revenue in 2023.
14
The self-storage market in India was valued at INR 12 billion in 2023, growing at 12% CAGR.
15
South Africa's self-storage revenue reached ZAR 2.5 billion in 2023, up 8.2% from prior year.
16
Mexico's self-storage industry revenue hit MXN 4.2 billion in 2023 amid urban expansion.
17
U.S. self-storage revenue growth slowed to 1.8% in Q4 2023 due to supply increases.
18
The global self-storage market cap rate averaged 5.9% in 2023 for prime assets.
19
U.S. self-storage facilities under 50,000 sq ft generated $4.1 billion in 2023 revenues.
20
Climate-controlled self-storage revenue segment was $9.8 billion in U.S. 2023.
21
U.S. self-storage market expected to grow at 2.5% CAGR to $26.8 billion by 2028.
22
Public Storage's revenue increased 8.4% to $4.42 billion in 2023 fiscal year.
23
CubeSmart reported $1.16 billion in NOI for 2023, up 7.2% YoY.
24
Extra Space Storage merged with Life Storage, combining for $9.5B revenue potential.
25
National Storage REIT (Australia) revenues AUD 295M in FY2023, +10% growth.
26
Big Yellow Group (UK) achieved £192.8M revenue in FY2023, 12.5% increase.
27
Self Storage Group Europe revenues €45M in 2023, expanding to 20 countries.
28
U.S. self-storage rents per sq ft averaged $1.42in 2023.
29
Ancillary revenue (insurance, trucks) added $2.1B to industry totals in 2023.
30
Small operators (<50k sq ft) generated 28% of total U.S. revenues in 2023.
Interpretation
Market Size & Revenue Interpretation
The global self-storage industry, fueled by our collective inability to let go, has metastasized into a nearly $100 billion business built on charging rent for the things we can't quite bear to live with but can't bring ourselves to throw away.
03 · Category
Operations & Costs30 stats
01
U.S. self-storage operating expenses averaged 35% of revenue in 2023.
02
Average U.S. self-storage facility employs 4.2 full-time staff in 2023.
03
Property taxes consume 12.5% of self-storage operating expenses nationally.
04
Utilities cost per sq ft in self-storage: $0.42annually in 2023.
05
Marketing expenses for self-storage operators averaged 8.7% of revenue in 2023.
06
Average payroll cost per employee in U.S. self-storage: $48,500in 2023.
07
Insurance premiums rose 11% for self-storage facilities in 2023.
08
Maintenance capex per sq ft: $1.25in U.S. self-storage 2023.
09
42% of self-storage facilities use automated kiosks, reducing labor by 25%.
10
Energy costs for climate-controlled units: 18% of total ops expenses.
11
Average rent collection rate: 98.2% in top-performing facilities 2023.
12
Bad debt expense: 1.1% of gross revenue in self-storage industry 2023.
13
Facility turnover rate for managers: 22% annually in 2023.
14
Telecom and internet costs: $2,400per facility per year average.
15
65% of facilities outsource pest control, costing $1,800 annually avg.
16
Elevator maintenance in multi-story facilities: $15,000/year average.
17
Digital security systems adopted by 78% of facilities, costing $5k install.
18
Average cost to lease new self-storage space: $12.50/sq ft in prime markets.
19
U.S. self-storage NOI margins averaged 68% in 2023 for stabilized assets.
20
Construction costs for new self-storage: $85-110 per sq ft in 2023.
21
U.S. self-storage avg rent collection days: 2.1 in 2023.
22
Repairs & maintenance: 6.8% of expenses in small facilities.
23
Advertising digital spend: 65% of total marketing budget 2023.
24
Average utility bill per 50k sq ft facility: $1,200/month.
25
Manager salary avg: $52,000in suburban markets 2023.
26
Property insurance avg premium: $18,000/year for 50k sq ft.
27
Janitorial services cost: $0.15/sq ft annually.
28
Software subscription fees: $4,500/year avg per facility.
29
Credit card fees: 2.9% + $0.30 per transaction 2023 avg.
30
Security monitoring contracts: $2,800/year average.
Interpretation
Operations & Costs Interpretation
The self-storage industry runs on remarkably thin margins and shrewd automation, where every saved square foot and employee hour is fiercely guarded, yet still manages to yield eye-popping net operating incomes that make even the most cluttered unit look like a tidy investment.
More related reading
04 · Category
Supply & Demand30 stats
01
The U.S. has over 52,000 self-storage facilities supplying 2.1 billion rentable square feet as of 2023.
02
Demand for self-storage in the U.S. reached 90.2% physical occupancy in Q3 2023.
03
New self-storage supply in the U.S. totaled 4.2 million sq ft in Q1 2024, down 15% YoY.
04
U.S. self-storage economic occupancy averaged 92.1% across top 50 markets in 2023.
05
Over 11% of U.S. households rent self-storage units annually, equating to 14.6 million households.
06
Atlanta led U.S. self-storage supply growth with 5.8 million sq ft under construction in 2023.
07
Global self-storage supply grew by 3.2% in 2023, adding 150 million sq ft worldwide.
08
U.S. self-storage under-construction inventory peaked at 45.2 million sq ft in mid-2023.
09
Demand outpaced supply in 42 of top 50 U.S. self-storage markets in 2023.
10
UK self-storage vacancy rates dropped to 7.5% in 2023 from 9.2% in 2022.
11
Australia's self-storage supply reached 12 million sqm in 2023, with 85% occupancy.
12
Physical occupancy in U.S. non-climate-controlled units was 88.4% in Q4 2023.
13
Canada added 1.2 million sq ft of self-storage supply in 2023, boosting total to 450 million sq ft.
14
U.S. self-storage rental rates increased 0.8% YoY in Q3 2023 amid softening demand.
15
Europe constructed 2.5 million sqm of new self-storage space in 2023.
16
Oversupply hit 12 U.S. markets with 5%+ absorption rates lagging in 2023.
17
35.7 million sq ft of U.S. self-storage delivered in 2023, highest since 2019.
18
Average U.S. self-storage facility size grew to 46,000 sq ft in 2023.
19
Demand for small units (5x5 to 5x10) accounted for 42% of U.S. rentals in 2023.
20
Demand-supply ratio in U.S. self-storage markets averaged 0.92 in 2023.
21
Top 10 U.S. markets absorbed 2.1M sq ft net in Q4 2023.
22
Seattle-Tacoma occupancy hit 93.8% physical in 2023.
23
New York City self-storage supply constrained at 1.2% vacancy 2023.
24
Chicago added 1.8M sq ft supply, occupancy dipped to 89.5%.
25
Miami's self-storage demand surged 4.2% YoY in rentals 2023.
26
Denver under-construction pipeline: 3.4M sq ft, 7.5% of stock.
27
Las Vegas supply growth slowed to 2.1% in 2023.
28
Portland OR occupancy: 91.2%, demand steady post-pandemic.
29
Inland Empire CA oversupply led to 2.3% rent decline 2023.
30
Nashville absorbed 450k sq ft net, occupancy 92.4%.
Interpretation
Supply & Demand Interpretation
Despite a surge of new storage units, Americans are still cramming them full of their stuff at a remarkable 92% occupancy, proving that our collective inability to let go is ironically the industry's most reliable asset.
05 · Category
Trends & Technology30 stats
01
AI adoption in self-storage operations reached 15% in 2023 for pricing optimization.
02
Contactless access systems used in 62% of new U.S. facilities by 2023.
03
Mobile app usage for self-storage management grew 28% YoY in 2023.
04
Sustainability initiatives: 34% of facilities installed solar panels by 2023.
05
Revenue management software penetration: 55% in 2023, boosting rates 5-7%.
06
E-commerce boom drove 12% increase in business storage demand 2020-2023.
07
Virtual tours implemented by 48% of facilities, increasing conversions 20%.
08
Blockchain for lien sales piloted in 5% of facilities in 2023.
09
Post-pandemic, remote work boosted home office storage needs by 18%.
10
IoT sensors for unit monitoring in 22% of climate-controlled facilities.
11
Oversupply projected to pressure rents down 2-4% in 2024-2025.
12
Multifamily-integrated self-storage grew 15% in urban areas 2023.
13
Drone inspections for roof maintenance adopted by 8% of large operators.
14
Personalized pricing via AI used by top 10 REITs, lifting revenue 6%.
15
EV charging stations at 12% of facilities by end of 2023.
16
Data analytics for demand forecasting accuracy improved to 92% in 2023.
17
Mixed-use developments incorporating storage rose 25% in planning stages.
18
Voice-activated unit access tested in 3% of tech-forward facilities.
19
Global expansion: Asia markets to grow 9% CAGR through 2030.
20
Facility consolidation by REITs reached 18% market share increase 2023.
21
Robot vacuums in 9% of facilities, cutting cleaning labor 30%.
22
Dynamic pricing tools increased revenue 4.2% avg in 2023 pilots.
23
5G-enabled cameras in 18% new builds for better surveillance.
24
Peer-to-peer storage platforms grew 22% to 1.2M listings.
25
Green certifications (LEED) in 11% of new facilities 2023.
26
AR unit visualizers on 25% of operator websites.
27
Predictive maintenance via sensors reduced downtime 35%.
28
Crypto payments accepted by 2% of forward-thinking facilities.
29
Facility management SaaS market for storage: $250M in 2023.
30
Urban micro-storage pods demand up 31% in dense cities.
Interpretation
Trends & Technology Interpretation
While robots and AI are busily crunching numbers and opening doors, the self-storage industry has clearly realized that its future isn't locked in a unit but in adapting to a contactless, data-driven, and surprisingly green world, even if it means navigating an oversupply by getting smarter, not just bigger.
Reference
Cite This Report
This report is designed to be cited. We maintain stable URLs and versioned verification dates. Copy the format appropriate for your publication below.
APA
David Sutherland. (2026, February 13). Storage Units Industry Statistics. Gitnux. https://gitnux.org/storage-units-industry-statistics
MLA
David Sutherland. "Storage Units Industry Statistics." Gitnux, 13 Feb 2026, https://gitnux.org/storage-units-industry-statistics.
Chicago
David Sutherland. 2026. "Storage Units Industry Statistics." Gitnux. https://gitnux.org/storage-units-industry-statistics.
Sources & references
100 datasets cited across this report · attribution is report-level