
01 Industry overview
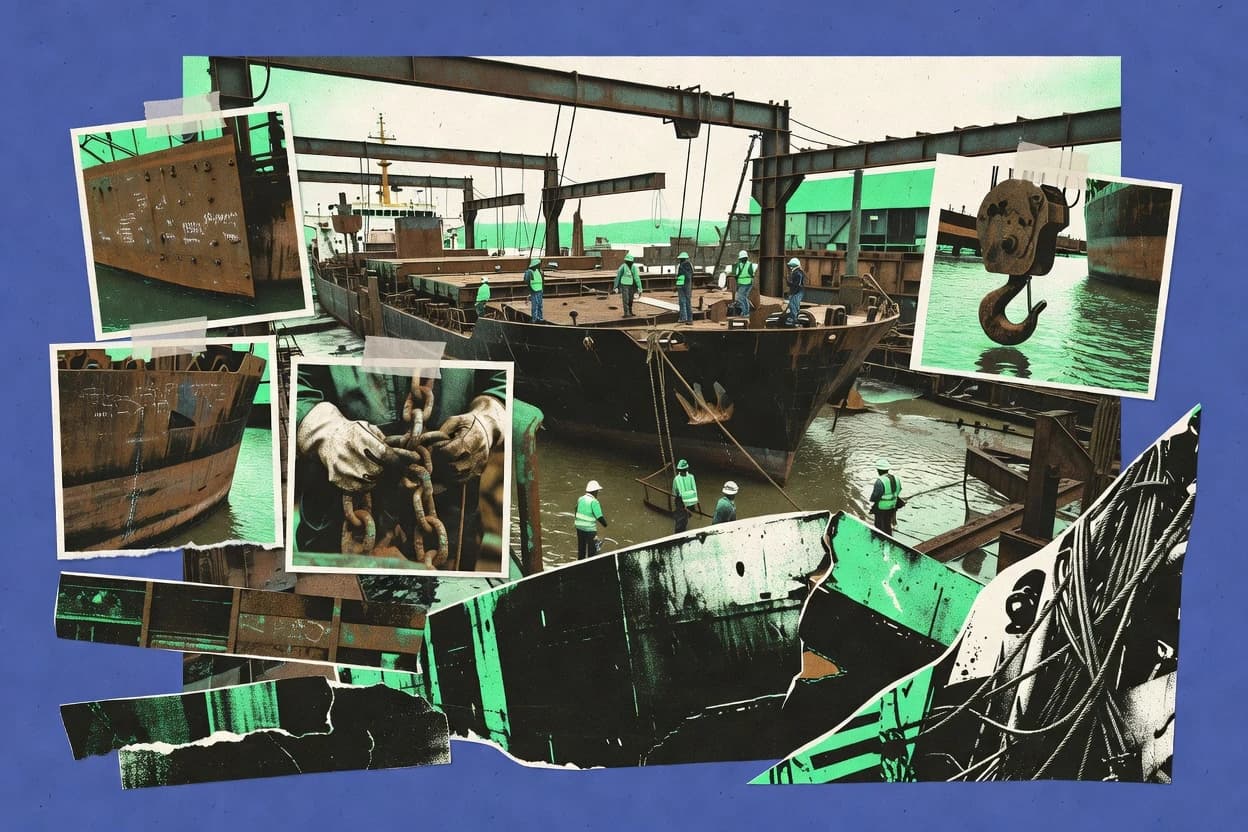
The ship breaking industry at a glance
Ship breaking remains a concentrated, low-volume industry: about 6.3 million gross tons were recycled in 2024, with Bangladesh, India, Pakistan and Türkiye accounting for 91.7% of global activity.
- $7.0B[20]
- Market size, 2024
- 6.3M GT[19]
- Ships recycled, 2024
- 91.7%[19]
- Top four countries’ share, 2024
- 409[17]
- Ships dismantled, 2024
- Market size
- BCC Research valued the global ship recycling market at $7.0 billion in 2024. UN Trade and Development measured physical activity at approximately 6.3 million gross tons recycled in 2024, equivalent to 0.25% of the active global fleet.[20][19]
- Forecast & CAGR
- BCC Research forecasts the market to rise from $9.1 billion in 2025 to $13.0 billion in 2030, representing a 7.4% compound annual growth rate from 2025 to 2030.[20]
- Market share & regions
- Bangladesh, India, Pakistan and Türkiye accounted for 91.7% of global ship recycling by tonnage in 2024. Bangladesh and India together represented more than 77% of the market, while the rest of the world accounted for approximately 8.3%.[19]
- Segmentation
- By vessel type, bulk carriers represented 32.4% of tonnage sold for scrap in 2024, followed by container ships at 15.2%, offshore supply vessels at 12.8%, oil tankers at 12.1% and liquefied-gas carriers at 11.0%.[19]
- Key players & concentration
- The market is concentrated geographically rather than around a small group of globally listed companies: four countries handled 91.7% of global recycling tonnage in 2024. The NGO Shipbreaking Platform recorded 255 of 409 dismantled ships entering South Asian yards, indicating that Bangladesh, India and Pakistan remained the dominant destination by vessel count.[19][17]
- Trends, drivers & challenges
- Ship recycling volumes stayed near historic lows in 2024 because strong freight-market earnings and high second-hand and newbuilding prices encouraged owners to retain vessels. UN Trade and Development expects recycling to recover as fleet modernization accelerates, older tonnage increases and shadow-fleet employment opportunities diminish; it also identifies limited recycling capacity and tighter environmental requirements as constraints.[19]
- Consumer behavior & competition
- The industry is driven by shipowners’ end-of-life disposal decisions and competition among yards for vessels, with freight earnings and second-hand prices influencing whether ships are recycled or kept in service. In 2024, Bangladesh remained the first-choice destination in the NGO Shipbreaking Platform’s dataset, while 80% of global scrapped tonnage was dismantled under substandard conditions in Bangladesh, India and Pakistan.[17][19]
- Regulation
- The IMO Hong Kong Convention entered into force on 26 June 2025. It establishes mandatory requirements covering ship inventories of hazardous materials, recycling-facility operations, surveys, authorization, certification, inspection and reporting; by the IMO’s 2025 briefing, 24 parties represented 57.15% of world shipping tonnage.[45]
02 Ranking
Top 10 Companies in the Ship Breaking Industry
The leading companies in the ship breaking industry, ranked on market impact, performance, momentum, innovation and brand popularity.
Updated November 10, 2026 · Next review December 10, 2026
Priya Blue Industries leads Gitnux's 2026 ship breaking ranking with an Overall score of 9.7, with three HKC-certified ship recycling facilities in Alang, India. Kabir Steel is the runner-up at 9.1, driven by IMO-listed authorization as a ship recycling facility in Chattogram.
Ranked by Overall score · How we score ↓
Editor's top 3 picks
Where to start, by need.
#1 Overall · Leader in HKC-compliant ship recycling
Priya Blue Industries
IN
Ranked #1 · 9.7 · HKC-compliant ship recycling
Why we picked it: It runs HKC-certified recycling capacity in Alang, aligning yard operations with the Hong Kong Convention framework.
Leader in ship recycling yards
Shree Ram Group
IN
Ranked #3 · 8.8 · Ship recycling yards
Why we picked it: Scale comes from multiple Alang yards, supporting vessel intake in the South Asian recycling flow.
Leader in ship dismantling and metal recycling
Galloo
BE
Ranked #4 · 8.8 · Ship dismantling and metal recycling
Why we picked it: It concentrates dismantling work in Ghent across multiple vessel classes, including warships and cruise ships.
Pick 1 is the #1 company overall. Picks 2 and 3 are the highest-ranked companies in the top 5 that add a new segment.
Full ranking
| # | Company | Overall ↓ | Impact | Performance | Momentum | Innovation | Company snapshot |
|---|---|---|---|---|---|---|---|
| 1 | Priya Blue Industries HKC-compliant ship recycling · IN | 9.7 | 9.9 | 9.9 | 9.9 | 8.9 | |
Company snapshot · Priya Blue Industries · Data as of November 10, 2026 Priya Blue operates three HKC-certified ship recycling facilities in Alang.[76]
| |||||||
| 2 | Kabir Steel HKC-compliant ship recycling · BD | 9.1 | 8.8 | 8.7 | 9.4 | 9.9 | |
Company snapshot · Kabir Steel · Data as of November 10, 2026 Kabir Steel is listed by the IMO as an authorized ship recycling facility in Chattogram.[23]
| |||||||
| 3 | Shree Ram Group Ship recycling yards · IN | 8.8 | 8.8 | 8.5 | 8.9 | 8.9 | |
Company snapshot · Shree Ram Group · Data as of November 10, 2026 Shree Ram Group operates three ship recycling yards at Alang.[77]
| |||||||
| 4 | Galloo Ship dismantling and metal recycling · BE | 8.8 | 7.8 | 8.7 | 9.4 | 9.9 | |
Company snapshot · Galloo · Data as of November 10, 2026 Galloo dismantles inland vessels, container ships, warships and cruise ships at its Ghent yard.[78]
| |||||||
| 5 | PHP Family Green ship recycling yards · BD | 8.7 | 8.8 | 8.5 | 8.5 | 8.9 | |
Company snapshot · PHP Family · Data as of November 10, 2026 PHP operates Bangladesh's only Hong Kong Convention-compliant green ship recycling yard.[79]
| |||||||
| 6 | Wirana Shipping Corporation Global ship recycling cash buyer · SG | 8.6 | 8.8 | 8.5 | 8.0 | 8.9 | |
Company snapshot · Wirana Shipping Corporation · Data as of November 10, 2026 Wirana says it has handled more than 2,700 vessels representing over 88 million DWT.[80]
| |||||||
| 7 | GMS Global ship recycling cash buyer and facilitator · AE | 8.2 | 9.1 | 7.7 | 8.2 | 7.0 | |
Company snapshot · GMS · Data as of November 10, 2026 GMS says it is the world's largest buyer of ships and offshore vessels for recycling.[81]
| |||||||
| 8 | Leela Worldwide Group Ship recycling yards, Alang, India · IN | 8.1 | 8.2 | 8.5 | 8.5 | 7.0 | |
Company snapshot · Leela Worldwide Group · Data as of November 10, 2026 Leela identifies ship recycling as its flagship venture and operates multiple Alang yards.[82]
| |||||||
| 9 | Salams International Green ship recycling yard, Gadani, Pakistan · PK | 8.0 | 7.0 | 8.4 | 9.3 | 8.0 | |
Company snapshot · Salams International · Data as of November 10, 2026 Salams International markets itself as a ClassNK-certified green ship recycling operator in Pakistan.[83]
| |||||||
| 10 | R.L. Kalthia Ship Breaking HKC-certified ship recycling yard, Alang · IN | 8.0 | 8.8 | 7.0 | 7.0 | 8.9 | |
Company snapshot · R.L. Kalthia Ship Breaking · Data as of November 10, 2026 R.L. Kalthia was established in 1983 and has recycled more than 90 ships.[84]
| |||||||
How we score
- Impact (30%): scale and weight in the market (revenue, market share, employees, market position).
- Performance (20%): recent revenue growth and operating margin; an analyst assessment where a company does not publish them.
- Momentum (20%): growth trajectory and future potential.
- Innovation (15%): R&D intensity and how technologically advanced the company is.
Popularity (brand search demand, 15%) counts toward Overall but is not published as a column. Overall leaves out what is not known.
Scale Scores are shown on a 7–10 scale with one decimal; bars start at 7.0.
Cadence Recalculated when new figures are published; next review December 10, 2026.
Independence. Rankings are editorially independent. Scores, ranks, picks and the verdict follow the method above; no company can pay to change them.
Cite this ranking
APA
Samuel Norberg. (2026, November 10). Top 10 companies in the ship breaking industry. In Ship Breaking Industry Statistics. Gitnux. https://gitnux.org/ship-breaking-industry-statistics/#top-companies
Number of recycled ships by country
India leads with 114.
03 Trends & forecasts
Top 10 Ship Breaking Industry Trends & Forecasts 2027
What is changing in the ship breaking industry, with the evidence behind each trend and a forecast for 2027.
Forecasts were generated by an AI model from the cited evidence. They are estimates, not guarantees.
01Recycling volumes rebound from lows
High confidenceUNCTAD recorded approximately 6.3 million gross tons recycled in 2024, equal to 0.25% of the active fleet. Lloyd’s List Intelligence data reported by World Ports Organization shows 7.9 million gross tons recycled in 2025, up 65% year on year and the highest level since 2021.[19][85]
Forecast 2027: Recycling should remain above the 2024 trough in 2027 as older ships return to the sale market, although volumes will still be cyclical and sensitive to freight earnings. A plausible range is roughly 8–10 million gross tons if fleet renewal continues without another major freight-rate spike.
02Fleet ageing supports future supply
High confidenceUNCTAD reported that the global fleet’s average age reached 12.6 years in 2024, a 3.2% increase from 2023. The organization expects recycling to recover as fleet modernization intensifies against the backdrop of an ageing fleet.[19]
Forecast 2027: By 2027, ageing tonnage should create a steadily larger pool of potential recycling candidates, particularly among older conventional vessels. Actual demolition will continue to lag the theoretical pool where freight markets and second-hand prices remain strong.
03Bulk carriers remain the largest segment
High confidenceBulk carriers represented 32.4% of tonnage sold for scrap in 2024, ahead of container ships at 15.2%, offshore supply vessels at 12.8%, oil tankers at 12.1% and liquefied-gas carriers at 11.0%.[19]
Forecast 2027: Bulk carriers are likely to remain the leading source of recycling tonnage in 2027 because of their large installed fleet and exposure to age-related replacement. Container and tanker recycling could grow faster in individual years if freight earnings weaken in those segments.
04South Asia retains geographic dominance
High confidenceBangladesh, India and Pakistan accounted for approximately 80% of global scrapped tonnage in 2024, while the NGO Shipbreaking Platform recorded 255 of 409 dismantled ships entering South Asian yards. Bangladesh remained the industry’s first-choice destination in the Platform’s dataset.[17][86]
Forecast 2027: South Asia should still handle the majority of global ship recycling in 2027 because of established yards, steel demand, labor availability and buyer networks. Its share may gradually decline at the margin as certified facilities in Türkiye and Europe win more regulated tonnage.
05India expands compliant recycling capacity
High confidenceIndia’s Directorate General of Maritime Administration reported 115 Hong Kong Convention-compliant plots out of 150 at Alang-Sosiya in 2026. A government-backed plan aims to expand the cluster’s capacity from 4.5 million to 9 million light displacement tons per year.[53]
Forecast 2027: India should increase its share of higher-compliance recycling in 2027, especially for owners requiring documented environmental and worker-safety controls. Capacity expansion is more likely to improve India’s competitive position gradually than to double actual throughput within one year.
06Bangladesh upgrades yards under pressure
High confidenceThe Bangladesh Ship Recycling Board stated that 14 facilities had been certified as Hong Kong Convention compliant by 2025. Bangladesh’s implementation notice requires authorized facilities to maintain facility plans and ship-specific recycling plans based on each vessel’s hazardous-material inventory.[87][88]
Forecast 2027: The number of compliant Bangladeshi yards should rise in 2027, but the market will likely remain split between upgraded facilities and lower-standard capacity. Compliance investment should help retain export-oriented owners while increasing operating costs for marginal yards.
07Hong Kong Convention reshapes competition
High confidenceThe Hong Kong Convention entered into force on 26 June 2025. IMO documentation states that 24 countries represented more than 57% of world shipping tonnage at the ratification stage, while the Convention introduces requirements for hazardous-material inventories, facility authorization, surveys, certification and reporting.[45][23]
Forecast 2027: By 2027, compliance status should become a more important selection criterion in ship-sale tenders and cash-buyer negotiations. Certified yards should gain pricing and access advantages, while uncertified facilities face a shrinking pool of internationally traded vessels.
08EU-listed yards defend premium niches
High confidenceThe European Commission’s 14th European List contained 43 approved ship-recycling facilities in February 2025: 31 in Europe, 11 in Türkiye and one in the United States. The Commission noted that EU rules remain more stringent than the Hong Kong Convention in some areas.[59]
Forecast 2027: EU-listed yards should continue serving a premium, regulation-driven segment in 2027 rather than competing with South Asia on total volume. Their competitive advantage will be strongest for EU-flagged ships and owners prioritizing traceability, worker protection and hazardous-waste controls.
09Substandard beaching remains commercially significant
High confidenceThe NGO Shipbreaking Platform reported that 80% of global scrapped tonnage in 2024 was dismantled under substandard conditions in Bangladesh, India and Pakistan. It also recorded nine worker deaths and 45 injuries in South Asia during the year.[17]
Forecast 2027: In 2027, safety and environmental performance should remain a central competitive fault line. Public scrutiny and buyer due diligence may divert some vessels to compliant yards, but the cost advantage of beaching is likely to preserve substantial substandard capacity.
10Demolition prices stay tied to steel
Medium confidenceIndicative 2026 demolition-market reporting showed quoted prices around $475 per light displacement ton in Bangladesh and $450 per light displacement ton in India in early April, compared with approximately $420 and $400 respectively in 2025. These movements illustrate the industry’s close link to local recycled-steel markets and currency conditions.[89]
Forecast 2027: Scrap prices should remain volatile in 2027, with South Asian yards competing through steel purchasing power rather than through a stable global benchmark. Higher steel demand would support demolition prices and recycling volumes; weak construction demand would compress yard margins and delay sales.
04 Statistics
Technology & Innovation
AI and robotics work focuses on planning and hazardous-material detection in ship recycling, including a digital-twin based automated plan and €950,000 for robotics and AI research.
AI in the ship breaking industry
- Nearly €8 million in EU funding supports the SHEREC research project on AI-enabled ship recycling.[1]
- 1 automated ship-recycling plan based on a ship digital twin and AI planning methods is being developed by SHEREC.[2]
- €950,000 of SHEREC funding is allocated to Paderborn University’s research on robotics and AI for ship recycling.[1]
- 1 AI-powered drone is planned to locate hazardous materials inside ships during the SHEREC recycling process.[2]
- 4 years is the planned duration of the European AI and robotics project SHEREC, launched in January 2024.[1]
Automation in the ship breaking industry
- 1 new technology project aims to automate, accelerate and reduce labor needs in the shipbreaking process.[3]
- 1 automated ship-recycling plan is being developed through a digital twin of the vessel.[4]
- 2 mobile robotic systems are planned to automate cutting and paint removal in ship recycling under SHEREC.[2]
- 1 Automated Block Processing system demonstrated the ability to produce high-quality scrap steel in the Marine Metals ship-dismantling project.[5]
- 1 wire-saw system was successfully tested for industrial-scale ship dismantling in Rotterdam on December 12, 2024.[5]
- 2 operating modes—autonomous and tele-operated—are specified for SHEREC’s mobile ship-recycling robots.[4]
Digital Transformation in the transportation and logistics sector (sector benchmark)
- Among global logistics decision-makers, 51% identified high costs as a challenge to digitalizing logistics operations in 2025.[6]
- Among global logistics decision-makers, 63% expected digitalization to enhance customer experience in 2025.[6]
- Across surveyed freight forwarders and logistics providers, 49% had digitized 50% or fewer of business processes or transactions in November 2024.[7]
- Among global logistics decision-makers, 69% expected digitalization to improve efficiency in 2025.[6]
- Across surveyed freight forwarders and logistics providers, 23% had digitized more than 75% of business processes or transactions in November 2024.[7]
Technology Adoption in the transportation and logistics sector (sector benchmark)
- Across transportation and logistics organizations, 53% were partially or fully deploying AI to reduce workloads in 2024.[8]
- Among 2026 transportation-management survey respondents, 15% of logistics service providers reported using AI at scale.[8]
- Across transportation and logistics organizations, 53% were partially or fully deploying automated real-time shipment tracking to address knowledge-worker shortages in 2024.[8]
- Across transportation and logistics executives surveyed in Europe and North America, 44% were using AI for transportation planning and optimization in 2025.[9]
- Among 2026 transportation-management survey respondents, 19% of shippers reported using AI at scale.[8]
Cloud Computing in the transportation and logistics sector (sector benchmark)
- Across travel, transportation and logistics companies surveyed globally, 84% had increased AI and machine-learning investment during the preceding one to two years.[10]
- Across travel, transportation and logistics companies surveyed globally, 89% planned to increase AI and machine-learning investment during the following one to two years.[10]
- Across travel, transportation and logistics companies surveyed globally, 85% said leadership viewed cloud as a long-term investment in 2023.[10]
- Across travel, transportation and logistics companies surveyed globally, 75% said cloud was crucial to their organization’s future in 2023.[10]
Big Data in the transportation and logistics sector (sector benchmark)
- Among global logistics decision-makers, 49% expected digitalization to improve data visibility in 2025.[6]
- 38% of surveyed GCC logistics organizations used structured data, while 20% recognized a systematic link between data and business insights, according to a 2023 study.[11]
- 12.5% of transportation and storage enterprises used both cloud computing and big-data analytics, according to the OECD’s 2026 sectoral comparison of enterprise technology adoption.[12]
- 9.5% of transportation and storage enterprises used big-data analytics alone in the OECD’s 2026 cross-sector comparison, based on the latest available enterprise data.[12]
- Among global logistics decision-makers, 34% identified data analytics, including cloud platforms and AI-powered solutions, as the most critical technology in 2025.[6]
05 Statistics
Data & Analytics
Data and reporting show strong regional processing concentration and ongoing measurement by vessel and flag, including 33 vessels by Comoros flag representing 1,106,032 gross tonnes in 2022.
Business intelligence in the ship breaking industry
- 29.3% of recycled gross tonnage was processed in India in 2022.[13]
- 295 oil tankers accounted for 8,657,234 gross tonnes recycled during 2021–2022.[13]
- 128 bulk carriers accounted for 5,734,262 gross tonnes recycled during 2021–2022.[13]
- 16.1% of recycled gross tonnage was processed in Pakistan in 2022.[13]
- 10.0% of recycled gross tonnage was processed in Türkiye in 2022.[13]
- 451 ships were recycled worldwide in 2022, totaling 8,067,298 gross tonnes and 3,225,854 light displacement tonnes.[13]
Data analytics in the ship breaking industry
- 33 vessels registered under the Comoros flag represented 1,106,032 gross tonnes recycled in 2022.[13]
- 47 vessels registered under the Panama flag represented 949,802 gross tonnes recycled in 2022.[13]
- 66 vessels registered under the St Kitts and Nevis flag represented 1,567,374 gross tonnes recycled in 2022.[13]
- 12.22% of vessels with an identified owner were owned by EU entities in 2022.[13]
- 12 vessels registered under the Sierra Leone flag represented 79,702 gross tonnes recycled in 2022.[13]
- 42 EU-flagged vessels were sent for dismantling in 2022, representing 8.52% of worldwide recycling volume by vessel count.[13]
Data Quality in the transportation and logistics sector (sector benchmark)
- Across supply management organizations, 67% said their data quality was better or significantly better than two years earlier in 2024.[14]
- Across supply management organizations, 49% rated their data quality as good or excellent in 2024.[14]
- Across transportation and logistics shippers, 33% identified data quality as a top barrier to scaling artificial intelligence in 2026.[8]
- Across supply management organizations, 33% rated their data-security ability as very high for assuring data quality in 2024.[14]
Data Governance in the transportation and logistics sector (sector benchmark)
- Across supply management organizations, 61% had a dedicated data-governance function in 2024.[14]
- Across supply management organizations with a data-governance program, 81% found the program useful in 2024.[14]
- Across supply management organizations with a data-governance function, 47% housed it in a center of excellence in 2024.[14]
- 33% of 3PL respondents said their supply chain governance maturity was running ahead, meaning proactive and predictable, in the 2024 global survey.[15]
- 42.8% of airlines surveyed worldwide considered themselves to be in the early stages of data-strategy implementation in the IATA 2024 survey.[16]
- 49% of shipper respondents said their supply chain governance maturity was running in place, with no noticeable progress, in the 2024 global survey.[15]
KPIs in the ship breaking industry
- 22 ships were dismantled in Bangladesh during the second quarter of 2025.[17]
- 74 ships were dismantled worldwide in the second quarter of 2025.[17]
- 9 workers died in South Asian shipbreaking yards during 2024.[17]
- 21 ships were dismantled in India during the second quarter of 2025.[17]
- 23% of reported SRTI signatory recycling activity took place in Türkiye during 2019–2024.[18]
- 23% of reported SRTI signatory recycling activity took place in Türkiye in 2024.[18]
06 Statistics
Strategy & Growth
Capacity and country shares dominate the outlook, with Bangladesh at 43.2% and India at 33.9% of global ship-recycling tonnage in 2024.
Growth in the ship breaking industry
- Pakistan accounted for 7.4% of global ship-recycling tonnage in 2024.[19]
- 6.34 million gross tons of ships were recycled globally in 2024, equivalent to 0.25% of the active fleet worldwide.[19]
- The global ship-recycling market is projected to reach $13.0 billion by 2030.[20]
- Bangladesh accounted for 43.2% of global ship-recycling tonnage in 2024.[19]
- India accounted for 33.9% of global ship-recycling tonnage in 2024.[19]
- The global ship-recycling market was valued at $7.0 billion in 2024.[20]
Differentiation in the ship breaking industry
- 3 acres is the impermeable-floor area reported by KR Ship Recycling Yard in Bangladesh.[21]
- 100,000 light-displacement tons is the annual capacity reported for Kabir Ship Recycling in Bangladesh.[22]
- 9 Bangladesh facilities listed by IMO had annual capacities of 60,000 to 160,000 light-displacement tons under Hong Kong Convention certification in December 2025.[22]
- 250 insured workers are employed by KR Ship Recycling Yard in Bangladesh.[21]
- 150 meters is the maximum vessel length listed for Jatob Frederikshavn in Denmark.[23]
- 150,000 light-displacement tons is the annual capacity reported for Arab Ship Breaking and Recycling in Bangladesh.[22]
Mergers and acquisitions in the ship breaking industry
- 70 acres is the size of the Brownsville, Texas ship-recycling and scrap-processing complex purchased by the SteelCoast joint venture in 2017.[24]
- 2 companies—Hilco Redevelopment Partners and MCM Marine Services—formed the SteelCoast joint venture that acquired the former ESCO Marine complex in Texas.[24]
- 3 Norwegian banks, creditors and bankruptcy authorities were involved in Green Yard Group’s agreement to acquire Kleven Verft in 2020.[25]
Strategic partnerships in the ship breaking industry
- 1 vessel, Samskip Frost, was selected for Green Yard’s ship-recycling process under the Samskip–Sea2Cradle collaboration in 2020.[26]
- 2 companies—ASRY and Priya Blue Group—launched a ship and offshore recycling joint venture in Bahrain in 2026.[27]
- 3 Egyptian entities—Maersk, the Holding Company for Maritime and Land Transport and Industrial Development Group—were involved in the planned shipbreaking and refitting company in Egypt.[28]
- 3 parties—Sojitz, Circular Maritime Technologies International and Jansen Recycling Group—formed a strategic partnership to develop automated shipbreaking technology in 2024.[3]
- 2 companies—Elegant Exit Company and ISSAC E&C—signed an MoU to develop green ship-recycling capacity in South Korea and the Far East in 2025.[29]
- 3 parties—Samskip, Sea2Cradle and Green Yard—worked together on the environmentally controlled recycling of the Samskip Frost in Norway in 2020.[26]
07 Statistics
People & Workforce
Workforce scale and training requirements stand out, including 225,000 workers employed in shipbreaking across India, Bangladesh, China and Pakistan.
Hiring in the ship breaking industry
- 225,000 workers were employed by shipbreaking yards in India, Bangladesh, China and Pakistan, according to a compiled industry estimate.[30]
- 18,000 shipbreaking workers were members of the Alang Sosiya Ship Recycling and General Workers Association in India, nearly all of them migrants.[31]
- 60,000 workers could be employed at Alang’s 169 plots when the Indian shipbreaking yards were fully occupied.[31]
- 25,000–40,000 full-time workers were estimated to be active in Bangladesh’s ship-recycling zone at any one time before the COVID-19 pandemic.[22]
- 40,000 workers were directly employed in shipbreaking yards along Bangladesh’s Chattogram coast, with about 200,000 more employed in related businesses, according to an ILO-referenced 2022 estimate.[32]
Employee retention in the ship breaking industry
- 84.5% of workers in Bangladesh’s ship-recycling industry were identified as migrants in a study of the sector’s workforce.[33]
- 18,000 Alang shipbreaking workers were represented by the sector’s workers association, providing an indicator of workforce continuity and organized worker participation.[31]
- 15,000 workers were estimated to remain active in Bangladesh’s ship-recycling zone during the second quarter of 2020 after the pandemic-related revision.[22]
- 54 workers were reported to have died in work-related accidents at Alang shipbreaking yards between January 2009 and October 2012.[30]
- 27.8% of 500 surveyed shipbreaking workers in Bangladesh were younger than 18 years old.[34]
Remote Work in the transportation and logistics sector (sector benchmark)
- In the U.S. transportation and warehousing industry, 13.9% of wage and salary employees worked from home in January 2025.[35]
- Among U.S. transportation, logistics, supply-chain and storage hires, 17.0% of hires at small companies were remote during the year ending September 2024.[36]
- Across U.S. transportation and utilities, 20.3% of workers could work from home in 2024–2025, while 18.6% actually did so, according to annual averages.[37]
- Across U.S. transportation and utilities occupations, about 11% of workers worked remotely at least sometimes from October 2023 through September 2024.[38]
Hybrid Work in the transportation and logistics sector (sector benchmark)
- Among transportation employers surveyed for the U.S. Job Outlook, 33.3% reported fully hybrid work arrangements in 2024.[39]
- Among U.S. remote-capable employees, 54% worked hybrid schedules in August 2026.[40]
- Globally, 25% of engaged employees were working in hybrid arrangements in 2025, compared with 30% of exclusively remote employees and 17% of on-site, non-remote-capable employees.[40]
- Across transportation and logistics companies surveyed globally, 42% reported a hybrid work arrangement in 2025.[41]
Upskilling in the ship breaking industry
- 75% of surveyed shipbreaking workers in Bangladesh had received formal safety training in a recent study.[42]
- 100% of ship-recycling-facility workers, including contractors, are required by IMO guidance to receive training appropriate to their operations before performing ship-recycling work.[23]
- 2 training components were recommended in Bangladesh’s SENSREC curriculum: theoretical facility-based training and practical vocational on-the-job training.[22]
- 25% of surveyed shipbreaking workers in Bangladesh had acquired substantial safety knowledge through on-the-job experience rather than formal training.[42]
- 70% of surveyed shipbreaking workers in Bangladesh were regularly equipped with personal protective equipment, an indicator of safety-capability support.[42]
Employee Engagement in the transportation and logistics sector (sector benchmark)
- Globally, 20% of employees were engaged at work in 2025, while 16% were actively disengaged.[40]
- In U.S. logistics, 40% of frontline workers wanted to quit in 2024, according to a survey of 500 logistics employees.[43]
- Across Asia-Pacific transport and logistics organizations, 62% of employees were actively engaged, based on feedback from 30,116 employees in 24 surveys.[44]
- In U.S. logistics, 71% of frontline workers reported workplace stress in 2024.[43]
- In U.S. logistics, more than 60% of frontline workers considered their roles long-term career commitments in 2024.[43]
DEI in the ship breaking industry
- 1 women-focused careers fair brought together Bangladeshi ship-recycling companies, women seafarers, maritime professionals, graduates and students to support female access to the sector.[45]
- 13% of Bangladesh’s shipbreaking workforce were children in a 2019 survey, highlighting the sector’s inclusion and labor-rights challenge.[46]
08 Statistics
Customer & Sales
Disposal decisions and yard competition drive throughput, with 409 ships dismantled globally in 2024 and 80% of scrapped tonnage in South Asia under substandard conditions.
Customer acquisition in the ship breaking industry
- 8.52 million gross tons of ships over 100 gross tons were sold for recycling globally in 2025.[47]
- 12.8% of ship-recycling tonnage consisted of offshore supply vessels in 2024, totaling 812,500 gross tons.[19]
- 11.0% of ship-recycling tonnage consisted of liquefied-gas carriers in 2024, totaling 695,300 gross tons.[19]
- 32.4% of ship-recycling tonnage consisted of bulk carriers in 2024, totaling 2.055 million gross tons.[19]
- 91.7% of global ship recycling tonnage was sold to Bangladesh, India, Pakistan or Türkiye in 2024.[19]
09 Statistics
Marketing & Brand
Transparency signals come through policy disclosure and audits, with 27 signatories disclosing ship-recycling policies covering 3,576 vessels in 2024.
Marketing in the ship breaking industry
- 10 shipowners reported written policies for selecting ship buyers or recycling facilities in the SRTI’s 2021 dataset.[48]
- 9 shipowners made their ship-recycling policy documents public in the SRTI’s 2021 dataset.[48]
- 27 signatories disclosed ship-recycling policies and practices through the SRTI in 2024, covering 3,576 vessels worldwide.[49]
- More than 160 commercial and public-sector vessels were operated globally by Crowley when it joined the SRTI in 2020.[50]
- 12 major shipowners disclosed ship-recycling policies and practices through the SRTI in 2022, representing 3,665 vessels.[48]
Branding in the ship breaking industry
- 8% of reported recycling locations were in Bangladesh for the reporting year covered by the SRTI 2023 progress report.[48]
- 14% of reported recycling locations were in the European Union four years before the reporting year covered by the SRTI 2023 progress report.[48]
- 85% of SRTI signatories included ship recycling in their ESG reports in 2024, with 50% reporting independent verification.[49]
- 93% of SRTI signatories audited ship-recycling facilities before use in 2024, supporting responsible-recycling positioning.[49]
- 10 of 12 SRTI-reporting shipowners covered subcontractors in their ship-recycling policies in 2021.[48]
Influencer Marketing in the transportation and logistics sector (sector benchmark)
- 49% of B2B marketers selected industry relevance as a criterion for choosing influencers in 2025, globally.[51]
- 55% of B2B companies used influencers in 2025, according to a global survey of marketing decision-makers.[51]
- 29% of B2B companies planned to adopt influencer marketing within the following year in 2025, globally.[51]
- 43% of worldwide B2B marketers who achieved positive results said micro-influencers generated the most success in 2024.[52]
- 53% of U.S. B2B marketers reported a growing dedicated influencer-marketing budget in 2024 survey data.[52]
10 Statistics
Operations & Execution
Execution remains tied to South Asian yard clusters, with 98% of India’s ship-recycling activity concentrated at Alang-Sosiya in 2026.
Process optimization in the ship breaking industry
- 98% of India’s ship-recycling activity was concentrated at Alang-Sosiya in 2026.[53]
- 35.4% of global ship-recycling volume was attributed to India in 2025.[53]
- 9 million LDT is India’s planned future ship-recycling capacity after the proposed Alang expansion.[53]
- 6 million GT was the approximate annual recycling capacity reported for Alang-Sosiya in 2026.[53]
- 98% of India’s ship recycling was handled by Alang-Sosiya in 2025, according to the Indian government.[53]
Operational efficiency in the ship breaking industry
- 2.0547 million gross tons of bulk carriers were recycled globally in 2024.[19]
- 7.2% of global recycled gross tonnage in 2024 was processed in Türkiye.[19]
- 695,300 gross tons of liquefied-gas carriers were recycled globally in 2024.[19]
- 7.4% of global recycled gross tonnage in 2024 was processed in Pakistan.[19]
- 812,500 gross tons of offshore supply vessels were recycled globally in 2024.[19]
Quality management in the ship breaking industry
- 5 additional Danaos vessels acquired in 2024 received newly prepared Inventory of Hazardous Materials manuals.[54]
- 35 beds were available at Alang’s Level III trauma centre after its 2025 upgrade.[53]
- 71 container ships were included in Danaos Corporation’s 2024 fleet covered by its hazardous-material certification programme.[54]
- 10 bulk carriers were included in Danaos Corporation’s 2024 fleet covered by its hazardous-material certification programme.[54]
- Since 2017, Danaos had trained its quality-control engineers as hazardous-material experts for ship recycling compliance.[54]
Supply chain in the ship breaking industry
- 21.3 million metric tonnes was the world total of ship-recycling steel reported for 2017.[48]
- 18.3 million metric tonnes was the world total of ship-recycling steel reported for 2018.[48]
- 1.1 million metric tonnes of ship-recycling steel came from Türkiye in 2021.[48]
- 11.9 million metric tonnes was the world total of ship-recycling steel reported for 2019.[48]
- 14.6 million metric tonnes was the world total of ship-recycling steel reported for 2020.[48]
Outsourcing / Offshoring in the transportation and logistics sector (sector benchmark)
- Across surveyed logistics companies in Germany, the rest of Europe and Latin America, 25% had fully outsourced warehouse operations in 2026.[55]
- Across surveyed logistics companies in Germany, the rest of Europe and Latin America, 57% planned outsourcing projects in warehousing in 2026.[55]
- Across surveyed logistics companies in Germany, the rest of Europe and Latin America, 65% expected outsourcing to continue increasing in 2026.[55]
- Across surveyed logistics companies in Germany, the rest of Europe and Latin America, about 60% had fully outsourced transportation services in 2026.[55]
11 Statistics
Finance & Pricing
Prices stay linked to steel and regional cost structures, with the typical range in Bangladesh, India and Pakistan at USD 200–700 per LDT from January 2012 to August 2026.
Pricing strategy in the ship breaking industry
- USD 200–700 per LDT was the typical ship-recycling price range in Bangladesh, India and Pakistan from January 2012 to August 2026.[47]
- USD 400–450 per LDT was the approximate ship-recycling price in Bangladesh by August 2025.[47]
- USD 465 per LDT was the Week 24 2025 historical average price at Chattogram, Bangladesh.[56]
- EUR 280–340 per LDT was offered by ship-recycling facilities in Türkiye for bulk carriers and tankers in 2023.[13]
- USD 620 per LDT was the Week 24 2022 historical average price at Chattogram, Bangladesh.[56]
Cost reduction in the ship breaking industry
- 30% of total recycling costs was the approximate share attributed to direct labour in the United States and Europe.[13]
- 3,412 injuries were documented in Southeast Asian shipbreaking yards since 2009, indicating a substantial external cost not reflected in ship prices.[13]
- EUR 200–350 per LDT was the additional cost associated with using a European-List ship-recycling facility instead of a non-compliant South Asian facility.[57]
- 30% of total recycling costs was the approximate share attributed to environmental and worker-safety compliance in the United States and Europe.[13]
- 78 deaths were documented in Bangladesh’s shipbreaking industry from 2018 to 2022.[13]
Profitability in the ship breaking industry
- INR 33.81 crore was Unique Ship Breaking Corporation’s provisional total operating income in fiscal year 2024.[58]
- 4,839.30 tonnes was the combined tonnage of two vessels being broken by Unique Ship Breaking Corporation as of August 31, 2024.[58]
- 1.17% was Unique Ship Breaking Corporation’s PBILDT margin in fiscal year 2023.[58]
- INR 14.25 lakh was Unique Ship Breaking Corporation’s profit from selling an office in fiscal year 2024.[58]
- INR 14.56 crore was Unique Ship Breaking Corporation’s net worth at March 31, 2024.[58]
Financial planning in the ship breaking industry
- INR 40 crore was Unique Ship Breaking Corporation’s long-term and short-term bank-facility amount rated in October 2024.[58]
- 1.5 times was the sustained letter-of-credit coverage level identified as a positive rating trigger for Unique Ship Breaking Corporation.[58]
- INR 150 crore was the total-operating-income level associated with a positive rating trigger for Unique Ship Breaking Corporation.[58]
- 1.0 times was the letter-of-credit coverage level below which CARE Ratings identified a negative rating trigger for Unique Ship Breaking Corporation.[58]
- INR 5 crore was Unique Ship Breaking Corporation’s short-term bank-facility amount rated in October 2024.[58]
12 Statistics
Product & Service
Regulatory-ready capacity is visible through European List inclusion counts, with 41 facilities on the European List in February 2026.
Product development in the ship breaking industry
- 35 European, 9 Turkish and 1 U.S. facility were included on the European List of ship-recycling facilities in 2023.[59]
- 3 facilities in Denmark, the Netherlands and Norway were removed from the European List in the 2023 update because they were no longer in the ship-recycling business.[59]
- 16,000 ships are expected to be recycled globally over the decade covered by the European Commission’s Blue Economy Observatory outlook.[60]
- 90 ships received ready-for-recycling certificates from EU Member States and Norway between 2019 and 2021.[60]
- 2 Turkish yards and 1 U.S. yard received renewed inclusion on the European List in the 2023 update.[59]
Product lifecycle in the ship breaking industry
- 31 years was the estimated average demolition age for offshore and drilling vessels in the EU/EFTA fleet.[61]
- 26 years was the estimated average demolition age for bulk carriers in the EU/EFTA fleet.[61]
- 38 years was the estimated average demolition age for fishing vessels in the EU/EFTA fleet.[61]
- 28 years was the average recycling age for containerships in 2026.[47]
- 24 years was the estimated average demolition age for container ships in the EU/EFTA fleet.[61]
After-sales in the ship breaking industry
- 9 workers died in South Asian shipbreaking yards during 2024 dismantling operations.[17]
- 255 ships dismantled globally in 2024 ended up in South Asian yards.[17]
- 25 ships were dismantled in Türkiye during the third quarter of 2024.[17]
- 24 ships were dismantled in Bangladesh during the third quarter of 2024.[17]
- 96 ships were dismantled worldwide in the third quarter of 2024.[17]
Value proposition in the ship breaking industry
- 61–76% of a bulk carrier’s light-displacement tonnage is typically recovered as re-rollable ferrous steel.[13]
- 1–6% of a bulk carrier’s light-displacement tonnage is typically represented by recovered machinery.[13]
- 0.5–2% of an oil tanker’s light-displacement tonnage is typically represented by recovered machinery.[13]
- 8–10% of a bulk carrier’s light-displacement tonnage is typically recovered as meltable ferrous steel.[13]
- 10% of a general-cargo ship’s light-displacement tonnage is typically recovered as meltable ferrous steel.[13]
13 Statistics
Sustainability & Ethics
Environmental and labor risk remains measurable, with 80% of global scrapped tonnage dismantled under substandard conditions on South Asian beaches in 2024.
Sustainability in the ship breaking industry
- 409 ships were dismantled globally in 2024, including 255 in South Asian yards.[17]
- 446 ocean-going commercial ships and offshore units were scrapped globally in 2023.[17]
- 80% of global scrapped tonnage was dismantled under substandard conditions on South Asian beaches in 2024.[17]
- 41 facilities were on the European List of approved ship recycling facilities in February 2026.[59]
- 43 facilities were on the European List in February 2025, including 31 in Europe, 11 in Türkiye and 1 in the United States.[59]
ESG in the ship breaking industry
- 9 workers died and 45 workers were injured while dismantling ships in South Asia in 2024.[17]
- 8 workers were injured in an oil-tank explosion during dismantling of the BANGLAR JYOTI in Bangladesh in 2025.[17]
- 6 workers were killed and 6 others critically injured in an oil-tanker explosion at a Chattogram yard in 2024.[17]
- 2 fatalities per 1,000 workers were reported for Alang shipbreaking, compared with 0.34 per 1,000 in Indian mining during the cited period.[62]
- 11 workers died and at least 62 workers were injured in South Asian ship recycling in 2025.[17]
Ethics in the ship breaking industry
- 30,000 workers were directly employed and about 100,000 indirectly employed by Bangladesh’s shipbreaking sector in the cited study.[17]
- 60 active yards operated among 155 registered Bangladeshi shipbreaking yards in the cited study.[17]
- 100–120 large ocean-going vessels were recycled annually in Bangladesh in the cited study.[17]
CSR in the ship breaking industry
- More than 50 Chinese vessels were sold to South Asian shipbreakers in 2024, mainly in Bangladesh.[17]
- 99 ships were sold for scrapping in South Asia by Chinese owners during 2022 and 2023.[17]
- 93 ships were dismantled in Aliaga, Türkiye, during 2022 and 2023, where nine EU-approved yards are located.[17]
- MSC was responsible for exporting more than 100 end-of-life ships to South Asia since 2009, according to the 2024 annual assessment.[17]
- 71 vessels owned by Chinese companies were sold for scrapping in South Asia in 2023, including 59 beached in Bangladesh.[17]
Circular economy in the ship breaking industry
- Bangladesh recycled more than 45% of the world’s ships by gross tonnage in 2023.[63]
- 91.7% of global ship recycling tonnage was handled by Bangladesh, India, Pakistan and Türkiye in 2024.[19]
- 18,791,032 gross tons was the average annual ship recycling volume from 2014 to 2022 in a circular-economy database study.[42]
- 4.5 million tonnes of carbon dioxide emissions were avoided annually by Bangladesh’s use of recycled ship steel, according to a 2023 estimate.[63]
- Container ships represented 15.2% of global ship recycling tonnage in 2024.[19]
Carbon footprint in the ship breaking industry
- 740 kilograms of coal consumption were avoided per metric tonne of ship scrap used for steel production, according to the cited analysis.[63]
- 120 kilograms of limestone consumption were avoided per metric tonne of ship scrap used for steel production, according to the cited analysis.[63]
- 18,791,032 gross tons was the average annual global ship recycling volume from 2014 to 2022 in a circular-practices study used to assess recycling-related environmental impacts.[42]
- 4.5 million tonnes of CO2 emissions were avoided annually through Bangladesh’s use of recycled ship steel, according to a 2023 estimate.[63]
- 1.4 tonnes of iron ore consumption were avoided per metric tonne of ship scrap used for steel production, according to the cited analysis.[63]
14 Statistics
Risk, Compliance & Legal
Regulatory timing is central after the Hong Kong Convention entered into force on 26 June 2025, with 24 parties covering 57.15% of world shipping tonnage by that briefing.
Compliance in the ship breaking industry
- 4.5 years is the approximate interval for a renewal inspection of facilities on the European List.[64]
- 20 unannounced inspections were carried out in Türkiye during the previous three years under the EU monitoring regime for listed ship recycling facilities.[64]
- 57.15% of world shipping by tonnage was covered by the 24 Hong Kong Convention parties when the convention entered into force in 2025.[45]
- 43 facilities were on the European List of compliant ship recycling facilities in February 2025: 31 in Europe, 11 in Türkiye and 1 in the United States.[59]
- 90% of global ship recycling volume was accounted for by Bangladesh, India, Pakistan and Türkiye in 2025.[19]
Risk Management in the transportation and logistics sector (sector benchmark)
- Among global logistics decision-makers at consumer brands, 59% identified building risk-management frameworks as a strategic priority in 2025.[65]
- Across 400 global transportation and logistics decision-makers, 57% ranked infrastructure investment among their biggest opportunities for the next two years in 2024.[66]
- Across global transportation and logistics companies, 90% reported having robust risk-management frameworks in 2026, according to a survey of 331 transportation leaders.[67]
- Among global logistics decision-makers at consumer brands, 60% were already using artificial intelligence extensively for risk management in 2025.[65]
- Across 400 global transportation and logistics decision-makers, 53% identified regulation as one of the greatest risks to business success in 2024.[66]
Cybersecurity in the transportation and logistics sector (sector benchmark)
- Among global transportation executives, 53% said cybersecurity was included in broader corporate strategy discussions in 2024.[68]
- Among global transportation executives, 69% said cyber resilience remained primarily the responsibility of cybersecurity teams rather than an enterprise-wide priority in 2024.[68]
- Among global transportation executives, 70% identified digital transformation as a barrier to cybersecurity resilience in 2024.[68]
- Among Florida transportation and logistics organizations, 40% had an incident-response plan for ransomware readiness in 2024.[69]
- Among Florida transportation and logistics organizations, 46% conducted tabletop exercises for ransomware readiness in 2024.[69]
Data Privacy in the transportation and logistics sector (sector benchmark)
- Among third-party logistics providers surveyed in the United States, 13% did not share data with external partners in 2024, partly because of privacy and security concerns.[15]
- Among European freight and transport organizations, 18% identified data security as a concern when exchanging information in 2024.[70]
- Among transportation shippers surveyed in the United States, 36% cited privacy concerns as an obstacle to sharing data with external logistics partners in 2024.[15]
- Among European freight and transport organizations, 16% identified data privacy as a concern when exchanging information in 2024.[70]
- Among transportation shippers surveyed in the United States, 18% did not share data with external partners in 2024, partly because of privacy and security concerns.[15]
Crisis Management in the transportation and logistics sector (sector benchmark)
- Among transportation and logistics organizations surveyed globally during the COVID-19 crisis, 40% had a pandemic plan before the crisis in 2020.[71]
- Among affected transportation and logistics organizations surveyed globally during the COVID-19 crisis, 24% were unsure of the pandemic’s long-term business impact in 2020.[71]
- Among shippers surveyed in the 3PL market, 13% identified risk management and contingency planning as a major challenge in 2024.[72]
- Among transportation and logistics organizations surveyed globally during the COVID-19 crisis, 43% believed additional crisis planning would have added value in 2020.[71]
- Among large companies globally, 82% reported having business continuity plans in 2025, while nearly 40% had never tested them.[73]
Governance in the ship breaking industry
- 14 shipping companies had joined the Ship Recycling Transparency Initiative by August 2023.[46]
- 12 major shipowners disclosed ship recycling policies and practices through the SRTI Progress Report 2022, representing 3,665 vessels.[48]
- 3 of 12 SRTI-disclosing shipowners never promoted responsible recycling for vessels owned through joint ventures in 2021.[48]
- 4 of 12 SRTI-disclosing shipowners sometimes promoted responsible recycling for vessels owned through joint ventures in 2021.[48]
- 9 of 12 SRTI-disclosing shipowners had a policy promoting responsible recycling when owned vessels were sold for further trading in 2021.[48]
15 Statistics
Globalization & Expansion
Global flows remain concentrated despite some diversification, with 95.59% of global merchant-ship recycling concentrated in India, Bangladesh, Türkiye, China and Pakistan in 2025.
Globalization in the ship breaking industry
- 10.14% of global merchant-ship recycling was handled by China in 2025.[74]
- 77% of global ship recycling was accounted for by Bangladesh and India in 2024.[19]
- 95.59% of global merchant-ship recycling was concentrated in India, Bangladesh, Türkiye, China and Pakistan in 2025.[74]
- 0.25% of the active global fleet was recycled in 2024.[19]
- 35.36% of global merchant-ship recycling was handled by India in 2025.[74]
Stakeholder management in the ship breaking industry
- 6 workers were killed in an oil-tanker explosion at an SN Corporation yard in Bangladesh in 2024.[17]
- At least 62 workers were injured in South Asian ship-recycling operations in 2025.[17]
- 80% of global ship-recycling tonnage was dismantled under substandard conditions on South Asian beaches in 2024.[17]
- 11 workers lost their lives in South Asian ship-recycling operations in 2025.[17]
- 45 workers were injured in South Asian ship-recycling operations in 2024.[17]
Distribution channels in the ship breaking industry
- 11% of ships sold for scrap globally were liquefied-gas carriers in 2024.[19]
- 12.1% of ships sold for scrap globally were oil tankers in 2024.[19]
- 7% of end-of-life vessels recycled were EU-member-state-flagged at recycling in 2022.[60]
- 13.2% of the global fleet was represented by EU-member-state-flagged vessels in 2022.[60]
- 8.9% of ships sold for scrap globally were general-cargo ships in 2024.[19]
Key questions about the ship breaking industry
What is the global ship-recycling market size and current activity level?
How fast is the market expected to grow into 2030?
Which companies lead the ship breaking industry?
What technology shifts are being tested for safer, more predictable recycling operations?
How concentrated is ship breaking by geography and vessel destination?
Why do recycling volumes stay low in periods of strong freight-market earnings?
Cite This Report
This report is designed to be cited. We maintain stable URLs and versioned verification dates. Copy the format appropriate for your publication below.
Samuel Norberg. (2026, November 10). Ship Breaking Industry Statistics. Gitnux. https://gitnux.org/ship-breaking-industry-statistics
Samuel Norberg. "Ship Breaking Industry Statistics." Gitnux, 10 Nov 2026, https://gitnux.org/ship-breaking-industry-statistics.
Samuel Norberg. 2026. "Ship Breaking Industry Statistics." Gitnux. https://gitnux.org/ship-breaking-industry-statistics.
Sources & references
89 sources cited across this report
eim.uni-paderborn.de
sintef.no
sojitz.com
cordis.europa.eu
- marinemetals.com
assets.kuehne-nagel.com
- 7221586.fs1.hubspotusercontent-na1.net
descartes.com
news.trimble.com
tcs.com
rolandberger.com
oecd.org
utah.ismworld.org
us.nttdata.com
iata.org
shipbreakingplatform.org
smart-freight-centre-media.s3.amazonaws.com
unctad.org
bccresearch.com
- krshiprecycling.com
sensrec.imo.org
prnewswire.com
bairdmaritime.com
- sea2cradle.com
maritime-executive.com
- portnews.it
- elegantexitcompany.com
en.wikipedia.org
industriall-union.org
wwwex.ilo.org
link.springer.com
academia.edu
fred.stlouisfed.org
economicgraph.linkedin.com
bls.gov
govinfo.gov
naceweb.org
gallup.com
newsroom.cisco.com
mdpi.com
quinyx.com
insync.com.au
hrw.org
regjeringen.no
- shiprecyclingtransparency.org
crowley.com
emarketer.com
- pib.gov.in
s2.q4cdn.com
miebach.com
hellenicshippingnews.com
- isranetwork.com
careratings.com
tandfonline.com
- resourcetransitions.earth
wtwco.com
ajg.com
levelblue.com
gordoninstitute.fiu.edu
- remunet-project.eu
inboundlogistics.com
dymez6ioe12by.cloudfront.net
- statbase.org
lloydslist.com
priyablue.com
shreeramgroup.in
galloo.com
phpfamily.com
mail.wirana.com
gmsinc.net
leelaworldwide.com
salamsinternational.com
kalthiashipbreaking.com
worldports.org
argusmedia.com
- bsrb.gov.bd
- dosdms.smartsoft-bd.com
scribd.com