
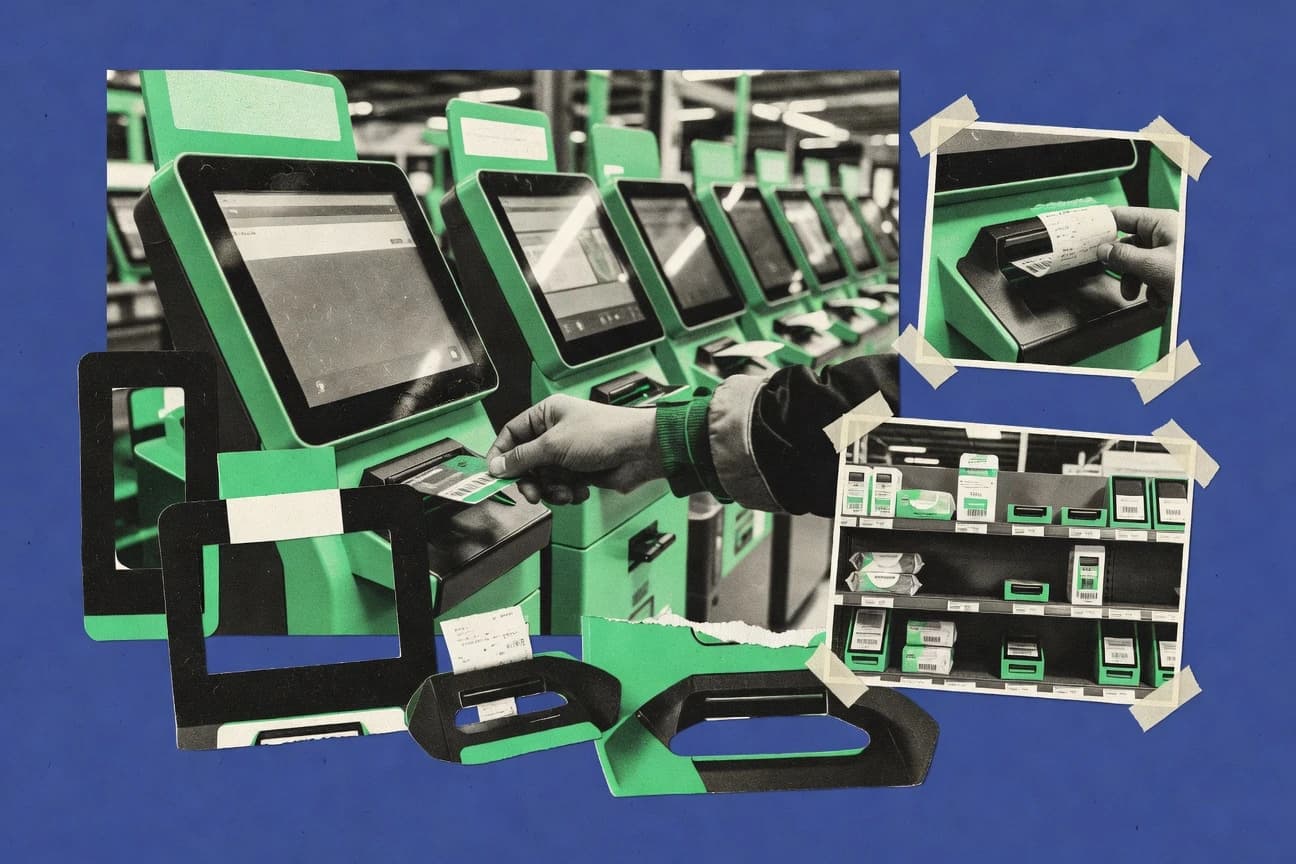

Two billion people worldwide now use self-service tools such as kiosks, mobile apps, and chatbots. Forty one percent of consumers engage with them at least once a month. The sections below compile data on adoption trends, market growth, and performance results across these channels.
Key Takeaways
- 2.0 billion estimated global users of self-service technology (e.g., kiosks, mobile check-in, chatbots) in 2023, reflecting the scale of digitally enabled self-service interactions worldwide
- 75% of service organizations planned to increase investment in digital self-service within 12 months, showing prioritization of self-service channel expansion
- 69% of consumers say they would switch to a competitor if a brand’s self-service tools didn’t work properly, demonstrating the risk of low self-service effectiveness
- 41% of consumers used self-service technology at least once in the last month (e.g., mobile apps, self-checkout, chatbots), indicating frequent engagement with self-service channels
- In a 2022 survey, 47% of consumers reported using chatbots for customer service at least once in the past year, showing conversational self-service uptake
- In 2023, 64% of organizations used some form of self-service knowledge base for customer support, indicating mainstreaming of self-help content
- The global chatbot market is forecast to reach $18.3B by 2028, reflecting ongoing investment in self-service conversational interfaces
- The global self-service kiosk market is expected to grow at a CAGR of 11.9% from 2024 to 2030, indicating fast-growing adoption of kiosk-based self-service
- The global customer experience (CX) software market was valued at $25.2B in 2022 and is forecast to reach $56.3B by 2030, including capabilities supporting self-service customer journeys
- 2.7x higher customer satisfaction for organizations that effectively use self-service channels (relative to those that don’t), based on aggregated CX benchmarking evidence
- A 2021 study found that customers using self-service were 2.3 times more likely to achieve their goal without contacting a human agent, demonstrating effectiveness for task completion
- The average deflection rate of 35% for well-designed self-service portals across contact center operations, indicating the share of issues resolved without escalation
- Cost per resolved case can be reduced by 20% to 35% using self-service knowledge management and guided workflows, measuring unit-cost impact
- 2.1x more likely for customer experience leaders to report that self-service channels improve customer satisfaction (benchmark ratio)
- Customer effort score improvements are strongly associated with higher retention; a 2018 meta-analysis reports that lower customer effort is correlated with higher customer loyalty (correlation evidence)
Self-service is scaling fast, boosting satisfaction and deflecting contacts, but only works when tools perform reliably.
Related reading
01 · Category
Industry Trends8 stats
01
2.0 billion estimated global users of self-service technology (e.g., kiosks, mobile check-in, chatbots) in 2023, reflecting the scale of digitally enabled self-service interactions worldwide
02
75% of service organizations planned to increase investment in digital self-service within 12 months, showing prioritization of self-service channel expansion
03
69% of consumers say they would switch to a competitor if a brand’s self-service tools didn’t work properly, demonstrating the risk of low self-service effectiveness
04
Gartner estimates chatbots will become the user interface for 25% of new customer service interactions by 2027, capturing the role of self-service automation
05
Gartner projects that by 2026, 80% of customer service organizations will use generative AI to enhance agents and self-service, increasing capability for self-help experiences
06
Gartner estimates that by 2025, 70% of customer interactions will involve emerging digital channels (including self-service), indicating a broader shift away from purely agent-led support
07
70% of customer interactions will involve emerging digital channels by 2025 (forecast)
08
25% of new customer service interactions will have chatbots as the user interface by 2027 (estimate)
Interpretation
Industry Trends Interpretation
With Gartner estimating 2.0 billion global self-service users in 2023 and projections that by 2025 70% of customer interactions will involve emerging digital channels, the industry trend is clear that self-service is rapidly becoming the default customer interface and will drive where investment and expectations are heading.
02 · Category
User Adoption5 stats
01
41% of consumers used self-service technology at least once in the last month (e.g., mobile apps, self-checkout, chatbots), indicating frequent engagement with self-service channels
02
In a 2022 survey, 47% of consumers reported using chatbots for customer service at least once in the past year, showing conversational self-service uptake
03
In 2023, 64% of organizations used some form of self-service knowledge base for customer support, indicating mainstreaming of self-help content
04
34.2 million automated teller machine (ATM) transactions per day were completed globally in 2022 (proxy for self-service channel usage at scale)
05
In 2024, 59% of consumers prefer using chatbots as a first step for customer service (survey finding, 2024)
Interpretation
User Adoption Interpretation
User adoption of self service is clearly accelerating, with 41% of consumers using self service tech monthly and 59% preferring chatbots as a first step in 2024, while adoption by businesses is equally mainstream as 64% already use self service knowledge bases for customer support.
03 · Category
Market Size6 stats
01
The global chatbot market is forecast to reach $18.3B by 2028, reflecting ongoing investment in self-service conversational interfaces
02
The global self-service kiosk market is expected to grow at a CAGR of 11.9% from 2024 to 2030, indicating fast-growing adoption of kiosk-based self-service
03
The global customer experience (CX) software market was valued at $25.2B in 2022 and is forecast to reach $56.3B by 2030, including capabilities supporting self-service customer journeys
04
The customer experience management software market in 2023 was valued at $9.8B, a spending proxy for investments often used to enable self-service (e.g., digital support, knowledge, journey tooling)
05
$10.5 billion global omnichannel customer service software market size in 2023 (self-service-related customer service tooling spend)
06
$8.1 billion retail self-checkout technology market size in 2023 (self-service checkout spend proxy)
Interpretation
Market Size Interpretation
Across self-service channels, the market is scaling rapidly with figures like the global chatbot market reaching $18.3B by 2028 and the self-service kiosk market growing at a 11.9% CAGR from 2024 to 2030, signaling sustained investment momentum for the Market Size category.
More related reading
04 · Category
Performance Metrics5 stats
01
2.7x higher customer satisfaction for organizations that effectively use self-service channels (relative to those that don’t), based on aggregated CX benchmarking evidence
02
A 2021 study found that customers using self-service were 2.3 times more likely to achieve their goal without contacting a human agent, demonstrating effectiveness for task completion
03
The average deflection rate of 35% for well-designed self-service portals across contact center operations, indicating the share of issues resolved without escalation
04
Customer experience leaders are 2.1x more likely to report that self-service channels improve customer satisfaction, linking self-service strategy to CX outcomes
05
Call deflection via digital channels reduced contact rates by 12% in a 2021 industry case study (quantified outcome)
Interpretation
Performance Metrics Interpretation
The performance metrics show a clear trend that well-run self service drives measurable results, from 35% average deflection in contact center operations and 12% fewer contact rates in 2021 to customers being 2.3 times more likely to reach their goal without a human agent and organizations seeing 2.7x higher customer satisfaction.
05 · Category
Cost Analysis1 stats
01
Cost per resolved case can be reduced by 20% to 35% using self-service knowledge management and guided workflows, measuring unit-cost impact
Interpretation
Cost Analysis Interpretation
Under the cost analysis lens, self-service knowledge management and guided workflows can cut the cost per resolved case by 20% to 35%, making them a clear lever for reducing unit costs.
06 · Category
Customer Impact5 stats
01
2.1x more likely for customer experience leaders to report that self-service channels improve customer satisfaction (benchmark ratio)
02
Customer effort score improvements are strongly associated with higher retention; a 2018 meta-analysis reports that lower customer effort is correlated with higher customer loyalty (correlation evidence)
03
A 2020 systematic review reported that self-service technologies positively affect customer satisfaction when designed for usability and task efficiency (review finding)
04
Net Promoter Score (NPS) is typically higher when digital self-service reduces effort; a 2021 study reports a significant positive relationship between self-service use and customer loyalty (study finding, 2021)
05
Digital self-service drives revenue uplift: 2020 academic research shows that customers using self-service experience lower friction and higher willingness to purchase (study finding, 2020)
Interpretation
Customer Impact Interpretation
From a customer impact perspective, the evidence points to clear gains from self-service with metrics often moving together, including 2.1x higher odds of improved satisfaction among customer experience leaders and stronger retention tied to lower customer effort as highlighted in a 2018 meta-analysis.
report visual · Comparison
Self-service adoption is rising—and so is the bar for performance
Consumers expect self-service to work; adoption and planned investment are strong, but failure pushes customers to switch.
75% of service organizations planned to increase investment in digital self-service within 12 months, showing prioritiza75%
69% of consumers say they would switch to a competitor if a brand’s self-service tools didn’t work properly, demonstrati
69%
41% of consumers used self-service technology at least once in the last month (e.g., mobile apps, self-checkout, chatbot
41%
The average deflection rate of 35% for well-designed self-service portals across contact center operations, indicating t
35%
source-verifiedforrester.com · businesswire.com · verywellmind.com · gartner.com
Reference
Cite This Report
This report is designed to be cited. We maintain stable URLs and versioned verification dates. Copy the format appropriate for your publication below.
APA
Ryan Townsend. (2026, February 13). Self Service Statistics. Gitnux. https://gitnux.org/self-service-statistics
MLA
Ryan Townsend. "Self Service Statistics." Gitnux, 13 Feb 2026, https://gitnux.org/self-service-statistics.
Chicago
Ryan Townsend. 2026. "Self Service Statistics." Gitnux. https://gitnux.org/self-service-statistics.
Sources & references
30 datasets cited across this report · attribution is report-level
+9 additional datasets cited (not shown individually)