
01 Industry overview
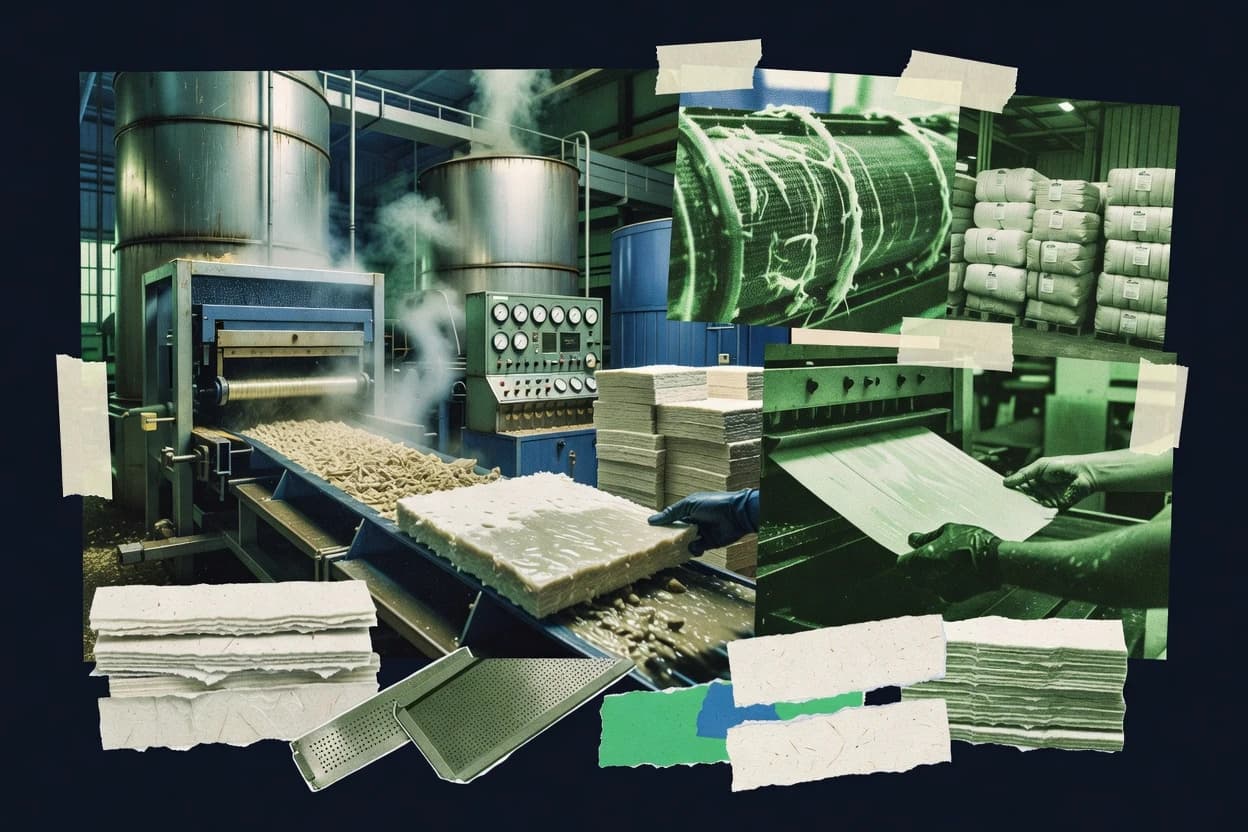
The pulping industry at a glance
The pulping industry produced 189 million tonnes of wood pulp in 2024, while Brazil strengthened its position as the leading exporter and new capacity continued shifting toward eucalyptus hardwood pulp.
- 189 Mt[82]
- Global wood pulp production, 2024
- 73 Mt[82]
- Global wood pulp trade, 2024
- 25.5 Mt[75]
- Brazil pulp production, 2024
- 13.4 Mt[21]
- Suzano annual BEKP capacity, 2025
- Market size
- The broader global pulp and paper market was valued at $351.7 billion in 2025. This figure includes paper and paperboard products as well as pulp, so it should not be interpreted as a standalone pulp-market value.[83]
- Forecast & CAGR
- The global pulp and paper market is forecast to grow from $357.6 billion in 2026 to $416.56 billion in 2035, representing a 1.7% CAGR. Within market pulp, UPM projects hardwood demand to rise at about 3.2% annually from 2025 to 2030, while softwood demand declines at about 2.9% annually.[83][84]
- Market share & regions
- Brazil produced 25.5 million tonnes of pulp in 2024 and exported $10.6 billion, making it the largest pulp-exporting country by value in Ibá's ranking. Suzano's 2025 pulp revenue was geographically distributed across Asia at 43%, Europe at 25%, North America at 18%, Brazil at 11%, and South and Central America at 3%.[75][55]
- Segmentation
- Pulp is primarily segmented into hardwood and softwood grades, with market applications including sanitary paper, printing and writing paper, specialties, and other uses. Suzano reported 2025 pulp sales of 64% to sanitary paper, 14% to printing and writing, 14% to specialties, and 8% to other applications.[55]
- Key players & concentration
- Suzano had annual BEKP capacity of 13.4 million tonnes in 2025 and was described by Moody's as the world's largest BEKP producer. S&P Global Ratings reported that Suzano represented about 14% of global pulp capacity, indicating substantial concentration among large integrated producers.[21]
- Pricing
- Suzano's average net pulp selling price fell to $542 per tonne in 2025 from $642 per tonne in 2024. Mercer reported 2025 average NBSK benchmark prices of about $1,525 per ADMT in Europe, $1,710 in North America, and $722 net in China.[55][20]
- Trends, drivers & challenges
- Global wood pulp production increased 3% to 189 million tonnes in 2024, with additional supply originating particularly from China and South America. Demand is supported by tissue and packaging consumption, while the industry faces oversupply in some markets, weaker printing and writing paper demand, trade-policy uncertainty, energy costs, and volatile benchmark prices.[82][84][20]
- Consumer behavior & competition
- Sanitary paper was the largest end-use destination in Suzano's 2025 pulp sales mix at 64%, compared with 14% for printing and writing paper. Competition is increasingly shaped by low-cost eucalyptus capacity, regional logistics, and supply reliability, while mature-market demand for printing and writing grades remains comparatively weak.[55][85]
- M&A
- In July 2026, Suzano completed its acquisition of a 51% interest in the international tissue business created with Kimberly-Clark. The transaction was valued at $3.4 billion for the joint venture and expanded Suzano's downstream exposure to tissue products rather than directly adding pulp capacity.[55][6]
- Regulation
- The EU Deforestation Regulation applies to medium and large operators and traders from 30 December 2026, with micro and small operators generally covered from 30 June 2027. Pulp and paper supply chains must therefore strengthen traceability and due-diligence systems for wood-based products placed on the EU market.[86][87]
- Latest news
- FAO's latest global forest-products update reported a 3% increase in wood pulp production to 189 million tonnes in 2024 and a 2% increase in international wood-pulp trade to 73 million tonnes. In 2026, Suzano completed its 51% acquisition in the Kimberly-Clark tissue joint venture, while the EU's deforestation rules moved toward application at the end of 2026.[82][55][86]
02 Ranking
Top 10 Companies in the Pulping Industry
The leading companies in the pulping industry, ranked on market impact, performance, momentum, innovation and brand popularity.
Updated November 10, 2026 · Next review December 10, 2026
CMPC leads Gitnux's 2026 pulping ranking with an Overall score of 9.5, with USD 3.03 billion in 2025 pulp segment revenue. Suzano is the runner-up at 9.4, driven by 2025 pulp revenue geographically distributed across Asia at 43%.
Ranked by Overall score · How we score ↓
Editor's top 3 picks
Where to start, by need.
#1 Overall · Leader in market pulp
CMPC
CL
Ranked #1 · 9.5 · Market pulp
Why we picked it: It reports pulp segment revenue of USD 3.03 billion (2025) in Chile’s market pulp, forestry and paper segment.
Leader in eucalyptus & dissolving pulp
Bracell
BR
Ranked #3 · 9.2 · Eucalyptus & dissolving pulp
Why we picked it: It targets kraft pulp scale with annual capacity up to three million tonnes.
Leader in integrated pulp & paper
APRIL
SG
Ranked #4 · 8.9 · Integrated pulp & paper
Why we picked it: It produced four million tonnes of pulp in 2025 at its integrated Indonesian operation.
Pick 1 is the #1 company overall. Picks 2 and 3 are the highest-ranked companies in the top 5 that add a new segment.
Full ranking
| # | Company | Overall ↓ | Impact | Performance | Momentum | Innovation | Company snapshot |
|---|---|---|---|---|---|---|---|
| 1 | CMPC Market pulp · CL | 9.5 | 9.7 | 9.3 | 9.6 | 9.2 | |
Company snapshot · CMPC · Data as of November 10, 2026 CMPC reported USD 3.03 billion in 2025 pulp segment revenue.[88]
| |||||||
| 2 | Suzano Market pulp · BR | 9.4 | 9.5 | 9.1 | 9.1 | 9.9 | |
Company snapshot · Suzano · Data as of November 10, 2026 Suzano reported that it was the world's largest producer of eucalyptus and virgin market pulp in 2025.[55]
| |||||||
| 3 | Bracell Eucalyptus & dissolving pulp · BR | 9.2 | 8.5 | 9.8 | 9.6 | 9.2 | |
Company snapshot · Bracell · Data as of November 10, 2026 Bracell has annual capacity of up to three million tonnes of kraft pulp or 2.3 million tonnes of dissolving pulp.[47]
| |||||||
| 4 | APRIL Integrated pulp & paper · SG | 8.9 | 9.6 | 9.0 | 8.7 | 7.7 | |
Company snapshot · APRIL · Data as of November 10, 2026 APRIL produced four million tonnes of pulp in 2025 at its integrated Indonesian operation.[89]
| |||||||
| 5 | Nine Dragons Paper Pulp & containerboard · CN | 8.8 | 8.2 | 9.4 | 9.9 | 7.7 | |
Company snapshot · Nine Dragons Paper · Data as of November 10, 2026 Nine Dragons was identified as China's largest pulp producer by installed capacity at the end of 2025.[85]
| |||||||
| 6 | Asia Pulp & Paper Integrated pulp and paper, Indonesia and China · ID | 8.8 | 8.2 | 9.9 | 8.9 | 8.5 | |
Company snapshot · Asia Pulp & Paper · Data as of November 10, 2026 APP was identified among China's largest pulp producers by installed capacity in 2025.[85]
| |||||||
| 7 | Klabin Hardwood, softwood and fluff pulp, Brazil · BR | 8.8 | 8.2 | 9.1 | 9.1 | 9.2 | |
Company snapshot · Klabin · Data as of November 10, 2026 Klabin's 2025 pulp business increased revenue from softwood and fluff pulp by 5% year over year.[90]
| |||||||
| 8 | UPM-Kymmene Softwood, birch and eucalyptus pulp · FI | 8.4 | 9.6 | 7.7 | 8.0 | 7.4 | |
Company snapshot · UPM-Kymmene · Data as of November 10, 2026 UPM operates pulp mills in Finland and Uruguay and delivered 5.163 million tonnes of pulp in 2025.[22]
| |||||||
| 9 | Eldorado Brasil Eucalyptus market pulp, Brazil · BR | 8.2 | 8.7 | 7.3 | 8.3 | 8.5 | |
Company snapshot · Eldorado Brasil · Data as of November 10, 2026 Eldorado produced 1.789 million tonnes of pulp and sold 1.817 million tonnes in 2025.[91]
| |||||||
| 10 | Sappi Pulp and specialty papers, global · ZA | 8.0 | 8.2 | 7.6 | 7.6 | 8.5 | |
Company snapshot · Sappi · Data as of November 10, 2026 Sappi reported 1.445 million tonnes of pulp sales volume in 2024.[11]
| |||||||
How we score
- Impact (30%): scale and weight in the market (revenue, market share, employees, market position).
- Performance (20%): recent revenue growth and operating margin; an analyst assessment where a company does not publish them.
- Momentum (20%): growth trajectory and future potential.
- Innovation (15%): R&D intensity and how technologically advanced the company is.
Popularity (brand search demand, 15%) counts toward Overall but is not published as a column. Overall leaves out what is not known.
Scale Scores are shown on a 7–10 scale with one decimal; bars start at 7.0.
Cadence Recalculated when new figures are published; next review December 10, 2026.
Independence. Rankings are editorially independent. Scores, ranks, picks and the verdict follow the method above; no company can pay to change them.
Cite this ranking
APA
Samuel Norberg. (2026, November 10). Top 10 companies in the pulping industry. In Pulping Industry Statistics. Gitnux. https://gitnux.org/pulping-industry-statistics/#top-companies
Total pulp production share by country (Cepi countries)
Sweden holds the largest share at 33.4%.
03 Trends & forecasts
Top 10 Pulping Industry Trends & Forecasts 2027
What is changing in the pulping industry, with the evidence behind each trend and a forecast for 2027.
Forecasts were generated by an AI model from the cited evidence. They are estimates, not guarantees.
01Wood pulp output keeps expanding
High confidenceGlobal wood pulp production rose 3% to 189 million tonnes in 2024, according to FAO. The increase indicates that mill restarts and new capacity are outweighing closures in the near term.[82]
Forecast 2027: Production is likely to rise again in 2027, but at a slower rate than in 2024 as new South American and Asian supply increasingly pressures operating rates. A plausible range is 1%–3% growth.
02International pulp trade continues growing
High confidenceInternational wood-pulp trade reached 73 million tonnes in 2024, up 2% year on year and at an all-time high, according to FAO. Trade growth reflects the geographic separation between low-cost pulp producers and major paper-producing markets.[82]
Forecast 2027: Global trade should remain close to record levels in 2027, with growth of roughly 1%–3% as additional exports from Brazil, Chile and Uruguay are absorbed mainly by Asia and Europe.
03Hardwood pulp gains market share
High confidenceUPM’s 2026 market outlook projects hardwood pulp demand to grow about 3.2% annually from 2025 to 2030, while softwood demand declines about 2.9% annually. The shift favors eucalyptus-based hardwood pulp in tissue, packaging and selected printing applications.[84]
Forecast 2027: Hardwood grades are likely to account for most net market-pulp demand growth in 2027. Substitution toward eucalyptus will continue where mills can adjust furnish and maintain required strength or softness.
04Softwood demand remains under pressure
High confidenceUPM forecasts softwood market-pulp demand to fall from approximately 23.2 million tonnes in 2025 to 20.1 million tonnes in 2030, equivalent to an annual decline of about 2.9%. The main structural constraint is weaker demand from printing and writing paper.[84]
Forecast 2027: Softwood demand is likely to decline again in 2027, although specialty papers, packaging and tissue furnish optimization should partly offset the fall. Producers will face continued pressure to reduce costs or redirect capacity.
05Brazilian eucalyptus capacity strengthens
High confidenceSuzano reported 13.4 million tonnes of installed market-pulp capacity in 2025, while Moody’s described it as the world’s largest bleached eucalyptus kraft pulp producer. FAO also identified Brazil, Chile and Uruguay as major sources of additional 2024 supply.[21][82]
Forecast 2027: Brazilian eucalyptus producers should remain among the lowest-cost suppliers in 2027. Their competitive position will support further displacement of higher-cost marginal capacity, particularly in hardwood grades.
06Brazil retains export leadership
High confidenceBrazil produced 25.5 million tonnes of pulp in 2024 and exported pulp worth about $10.6 billion, according to the overview’s Ibá data. Brazil’s export position is supported by high-yield eucalyptus forests, integrated logistics and large modern mills.[75]
Forecast 2027: Brazil is likely to remain the leading pulp-exporting country by value in 2027. Export earnings may fluctuate with benchmark prices, but volumes should remain structurally strong.
07Tissue drives pulp consumption
High confidenceSanitary paper represented 64% of Suzano’s 2025 pulp sales, compared with 14% for printing and writing paper. Suzano’s consumer-goods business also reported approximately 3% volume growth and 5% revenue growth in 2025.[6][21]
Forecast 2027: Tissue should remain the strongest recurring demand segment in 2027, particularly in emerging markets. Pulp suppliers will continue prioritizing softness, absorbency and fluff-pulp grades over printing-focused products.
08Printing grades keep declining
High confidencePrinting and writing paper accounted for only 14% of Suzano’s 2025 pulp sales, far below sanitary paper’s 64%. UPM’s outlook also anticipates a 2.9% annual decline in softwood market-pulp demand through 2030, consistent with mature-market print contraction.[6][84]
Forecast 2027: Printing and writing paper will remain a declining end use in 2027. Demand will persist in education, office and specialty applications, but it is unlikely to absorb significant new commodity pulp capacity.
09Pulp prices remain volatile
Medium confidenceSuzano’s average net pulp price fell to $542 per tonne in 2025 from $642 per tonne in 2024, a 16% decline. Mercer reported 2025 average NBSK benchmark prices of approximately $1,525 per ADMT in Europe, $1,710 in North America and $722 net in China, showing substantial regional dispersion.[55]
Forecast 2027: Prices are likely to remain uneven in 2027, with hardwood grades more exposed to new capacity and softwood grades supported by tighter supply. Quarterly swings will continue to depend on Chinese inventories, mill downtime and freight costs.
10Oversupply weighs on producer margins
High confidenceGlobal pulp production increased 3% in 2024 while Suzano described 2025 as a challenging pricing environment despite record sales volumes. Suzano’s 2025 adjusted EBITDA margin fell to 43% from 50% in 2024 as lower pulp prices offset operating improvements.[82][55]
Forecast 2027: Margin pressure is likely to persist into 2027, especially for high-cost producers and mills exposed to weak regional demand. Temporary closures, maintenance downtime and delayed projects should become more important balancing mechanisms.
04 Statistics
Technology & Innovation
The section aggregates mill-side AI, alarm reduction, and monitoring outcomes, including 1,237 operator hours saved and 15,721 alarm events reduced in 2026.
AI in the pulping industry
- $2.35 million+ in annual operational improvement opportunities were identified at a North American pulp-and-paper manufacturer using AI-powered operational intelligence, 2026, North America.[1]
- 1,237 operator hours were saved at a North American pulp-and-paper manufacturer using AI-powered operational intelligence, 2026, North America.[1]
- $732,000 was the funding amount for Millar Western’s AI pulp-refining project, 2021, Alberta, Canada.[2]
- $150,000 was the operational cost of one planned pump shutdown evaluated in Suzano’s AI-based early-failure prediction pilot, 2025, Brazil.[3]
- 21% better whitewater consistency was achieved by an AI-controlled retention-and-drainage program in a pulp-and-paper production application, 2021, India.[4]
- 60%+ of Millar Western’s Whitecourt BCTMP mill electricity consumption is used by the refining stage targeted by its AI pulp-refining expert system, 2024, Alberta, Canada.[2]
Automation in the pulping industry
- €15 million was invested in a gas-collection system at Stora Enso’s Skutskär mill as part of mill modernization, 2017, Sweden.[5]
- 15,721 alarm events were reduced through operational-intelligence deployment at a North American pulp-and-paper manufacturer, 2026, North America.[1]
- 160,000 tonnes per year of additional fluff-pulp capacity was planned through equipment investment at Stora Enso’s Skutskär mill, 2017, Sweden.[5]
- 2,500 smart rollers continuously monitor temperature, vibration and rotation on Suzano’s wood-chip conveyor system, 2026, Espírito Santo, Brazil.[6]
- 1,237 operator hours were saved through AI-assisted workflow and operational-intelligence deployment at a North American pulp-and-paper manufacturer, 2026, North America.[1]
- €23 million was invested to increase flexibility and capacity at Stora Enso’s Varkaus containerboard and pulp site by approximately 10%, 2021, Finland.[5]
Digital Transformation in the chemicals and materials sector (sector benchmark)
- Among EII businesses, 68% reported adopting AI in 2024, with an estimated 10% productivity increase.[7]
- Across European chemical subindustries, 65% of companies viewed digitalization as an opportunity that would significantly impact their activities in 2024.[7]
- Among ASUG chemicals-industry members, 46% ranked automation among their leading technology focus areas in 2025.[8]
- Among ASUG chemicals-industry members, 57% identified moving to SAP S/4HANA as a top focus area in 2025.[8]
Technology Adoption in the chemicals and materials sector (sector benchmark)
- Among chemicals organizations surveyed by IBM, 45% had implemented AI for supply-chain optimization in 2025.[9]
- Among chemicals organizations surveyed by IBM, 49% had implemented AI for quality inspection or defect detection in 2025.[9]
- Among chemicals organizations surveyed by IBM, 49% had implemented AI for production planning and scheduling in 2025.[9]
- Among chemicals organizations surveyed by IBM, 53% had implemented AI for real-time process control and optimization in 2025.[9]
Cloud Computing in the chemicals and materials sector (sector benchmark)
- Across chemical-sector companies surveyed by Arthur D. Little and Cefic, 15% planned to migrate to cloud computing in coming years in 2023.[10]
- Across chemical-sector companies surveyed by Arthur D. Little and Cefic, more than 35% had at least partially migrated to cloud computing in 2023.[10]
- Among EII businesses, 52% reported increased productivity from cloud computing in 2024, while 46% reported no change.[7]
- Among EII businesses, 2% reported decreased productivity from cloud computing in 2024.[7]
Big Data in the chemicals and materials sector (sector benchmark)
- Among ASUG chemicals-industry members, 49% cited gaining actionable insights from data and analytics as a current challenge in 2025.[8]
- Among EII businesses, 44% reported no productivity change from big data in 2024.[7]
- Among EII businesses, 6% reported decreased productivity from big data in 2024.[7]
- Among EII businesses, 48% reported increased productivity from big data in 2024.[7]
Blockchain in the pulping industry
05 Statistics
Data & Analytics
The section ties instrumentation and data quality to performance, including an 8–10% throughput increase after advanced-analytics transformation.
Business intelligence in the pulping industry
- 2,700 instruments measured temperature, pressure, flow and level at Klabin’s Puma pulp mill in Brazil in 2019.[12]
- More than 20% of the workforce participated in an internal analytics academy during its first year at a pulp and paper company in 2021.[13]
- 38 distributed-control systems operated at Klabin’s Puma pulp mill, supporting plant-wide operational information management in Brazil in 2019.[12]
- More than 25 digital and analytics use cases were identified across the pulp and paper value chain in 2021.[13]
- 20+ GB of operational data was integrated from multiple repositories for a pulp and paper company’s analytics transformation in 2021.[13]
- 4,500 global forest-products assets are represented in Fastmarkets’ mill-operation, cost, profitability and competitive-position intelligence database in 2026.[14]
Data analytics in the pulping industry
- 7.5% was the improvement in weak-black-liquor solids after analytics-based washing-line optimization at a U.S. pulp mill.[12]
- 40 global pulp and paper manufacturers contributed interview insights to a Baker Hughes study of data-driven automation in 2021.[15]
- 8–10% was the throughput increase achieved in a pulp mill after an advanced-analytics transformation in 2021.[13]
- 5–10% throughput gains were reported among digital frontrunners in pulp and paper operations in 2021.[13]
- 40% was the reduction in overall Kappa standard deviation after digester optimization at Graphic Packaging International’s West Monroe mill in the United States.[12]
- Up to 5 percentage points of yield improvement were identified from digital and advanced-analytics applications in pulp and paper operations in 2021.[13]
Data Quality in the chemicals and materials sector (sector benchmark)
- 67% of supply-management organizations said their data quality was better or significantly better than two years earlier in 2024.[16]
- 89% of manufacturers said data use improved their decision-making processes in 2026, across the surveyed manufacturing sector.[17]
- 44% of companies in the manufacturing survey reported AI-project failures caused by poor data quality in 2025, across surveyed manufacturers.[18]
- 42% of manufacturers had a process to verify manufacturing-data accuracy and quality in 2026, while 51% did not.[17]
- 49% of supply-management organizations rated their data quality as good or excellent in 2024, based on an Institute for Supply Management survey.[16]
- 80% of manufacturers reported a measured value for their operational data in 2026, across the surveyed manufacturing sector.[17]
Data Governance in the chemicals and materials sector (sector benchmark)
- 90% of supply-management organizations agreed or strongly agreed that data governance was necessary in 2024.[16]
- 61% of supply-management organizations had a dedicated data-governance function in 2024, based on a survey of more than 121 respondents.[16]
- 52% of global chemical companies had established performance management or KPIs around digital supply chains in 2022.[19]
- 28% of manufacturers had a data-governance leader in 2026, across the Manufacturing Leadership Council survey.[17]
- 46% of GCC chemical companies had established common data standards with collaboration partners in 2022.[19]
- 67% of GCC chemical companies had established performance management or KPIs around digital supply chains in 2022.[19]
KPIs in the pulping industry
- 50% was the reduction in washing-line variability after performance optimization at a U.S. pulp mill in 2020.[12]
- 1.5% was Klabin Puma’s average absolute control-loop error after more than two years of tuning and online monitoring in Brazil in 2019.[12]
- 100–110% was the improvement in 2-sigma moisture values reported after OYKA upgraded its quality-control system in Türkiye in 2025.[12]
- 99%+ was the operating efficiency reported for Eldorado’s recovery boiler in Brazil in 2026.[12]
- 7 units was the increase in the digester Kappa target after Kappa variability was reduced at Graphic Packaging International’s West Monroe mill in the United States in 2020.[12]
- 17% was the reduction in washer-discharge pulp conductivity after washing-line optimization at a U.S. pulp mill in 2020.[12]
06 Statistics
Strategy & Growth
The section centers on capacity additions and project scale, including Suzano’s 13.5 million tonnes per year installed pulp-production capacity after its 2024 mill start-up.
Growth in the pulping industry
- 420,000 tonnes per year of integrated paperboard capacity was added by Suzano’s 2024 acquisition of two U.S. facilities.[6]
- R$22.2 billion was Suzano’s investment in the Ribas do Rio Pardo pulp project in Brazil.[6]
- 340,000 tonnes was West Fraser’s 2024 NBSK capacity at Cariboo Pulp and Paper after it became the sole owner.[20]
- 13.5 million tonnes per year was Suzano’s installed pulp-production capacity after its 2024 mill start-up in Brazil.[6]
- 45,000 workers were employed during construction of Suzano’s Ribas do Rio Pardo pulp project in Brazil.[21]
- 2.029 million tonnes of market pulp were delivered by Stora Enso in 2024.[5]
Differentiation in the pulping industry
- 93% was the renewable-energy share at UPM’s pulp mills in 2024.[22]
- 2.55 million tonnes per year is the capacity of Suzano’s single-line eucalyptus pulp mill, the world’s largest of its type in 2024.[6]
- 2.3 billion dollars was International Paper’s 2024 revenue from its Global Cellulose Fibers business, which had nine manufacturing facilities.[23]
- 560,000 tonnes per year is the capacity represented by 50% of Suzano’s Veracel plant in Brazil.[24]
- 1.2 million tonnes is SCA’s expected combined annual capacity for NBSK and CTMP pulp after expansion.[25]
- 150,500 air-dried metric tonnes per year is Canfor’s Intercontinental mill production volume for premium NBSK pulp.[26]
Mergers and acquisitions in the pulping industry
- 1.06 billion dollars was the transaction value shown for Sofidel’s acquisition of Clearwater Tissue in 2024.[27]
- 240 million dollars was the transaction value shown for First Quality’s acquisition of Paper Excellence’s Dryden operation in 2023.[27]
- 5 million dollars was the consideration for Mondi’s acquisition of West Fraser’s Hinton pulp mill in Canada.[28]
- 7.24 billion dollars was the transaction value shown for International Paper’s acquisition of DS Smith in 2024.[27]
- 700 million dollars was the 2024 purchase price for Clearwater Paper’s acquisition of Graphic Packaging’s Augusta, Georgia, facility.[29]
- 825 million dollars was the approximate value of Billerud’s acquisition of Verso in 2022.[30]
Strategic partnerships in the pulping industry
- More than 70 countries were identified as markets for the Suzano-Kimberly-Clark tissue joint venture.[6]
- 51% is Suzano’s announced ownership interest in the joint venture with Kimberly-Clark.[6]
- 120 hectares was the initial Cerrado area where Suzano and IFC planned restoration and sustainable-management support.[6]
- 35,000 hectares of fragmented native vegetation was the initial reconnection goal of Suzano and IFC’s Cerrado partnership.[6]
- 22 manufacturing facilities were included in Kimberly-Clark’s international tissue assets contributed to the Suzano joint venture.[6]
- 3.4 billion dollars is the announced value of Suzano and Kimberly-Clark’s 2025 tissue joint venture.[6]
07 Statistics
People & Workforce
The section quantifies hiring, turnover, and training patterns; it includes a 9 training hours per employee reported by UPM in 2025.
Hiring in the pulping industry
- 59% of UPM’s open positions were filled by internal candidates in 2025.[22]
- 100% of International Paper’s Asian new hires were female in 2022.[31]
- UPM’s Finnish pulp mills had annual production capacity of 5.8 million tonnes when the 2024 workforce negotiations were announced.[22]
- 81% of International Paper’s North American new hires were male and 19% were female in 2022.[31]
- UPP Pulp & Paper reported a 20.5% new-hire rate in FY2022.[32]
Employee retention in the pulping industry
Remote Work in the chemicals and materials sector (sector benchmark)
- Among U.S. energy, natural-resources and chemicals workers, 8% preferred fully remote work in 2025.[33]
- Across U.S. chemical and pharmaceutical manufacturing employers, 5.7% of positions were fully remote in 2024.[34]
- Across U.S. remote-capable employees, 25% worked exclusively remotely in August 2026.[35]
- Among U.S. energy, natural-resources and chemicals workers, 25% preferred mostly remote work in 2025.[33]
Hybrid Work in the chemicals and materials sector (sector benchmark)
- Across U.S. chemical and pharmaceutical manufacturing employers, 44.5% of positions were fully hybrid in 2024.[34]
- Across U.S. remote-capable employees, 54% worked in a hybrid arrangement in August 2026.[35]
- U.S. hybrid employees spent an average of 46% of their workweek on-site in 2026.[35]
- Across U.S. remote-capable employees, 61% preferred a hybrid work arrangement in November 2025.[35]
- Across U.S. hybrid employees, 48% said their team had not discussed a formal or informal collaboration plan in 2026.[35]
Upskilling in the pulping industry
- 9 was the average number of training hours for male UPM employees in 2024.[22]
- 9 training hours per employee were reported by UPM in 2025.[22]
- 4,507 personnel training hours were delivered at UPM Kymi’s paper mill in 2023.[22]
- 8 was the average number of training hours for female UPM employees in 2024.[22]
- 67,597 cumulative training attendances were recorded by YFY in 2025 across learning categories that included its Pulp & Paper Group.[36]
Employee Engagement in the chemicals and materials sector (sector benchmark)
- Among global managers, 22% were engaged at work in 2025, compared with 19% of non-managers.[35]
- Across best-practice organizations recognized by Gallup, 70% of employees were engaged in 2025.[35]
- Across employees in the United States and Canada, 31% were engaged at work in 2025.[35]
- Across employees worldwide, 20% were engaged at work in 2025.[35]
- Across employees in the United States, 32% were engaged at work in 2025.[35]
DEI in the pulping industry
- 55% of Stora Enso employees were aged 30–49 in 2023.[5]
08 Statistics
Customer & Sales
The section reports customer-experience metrics for pulp sales, including UPM pulp NPS of 46 from approximately 500 customer contacts.
Customer experience in the pulping industry
- The average time to resolve a CMPC Pulp customer complaint was 31 days in 2024, versus 36 days in 2023.[37]
- 85% of CMPC Pulp customers viewed the company’s social management positively in the 2023 SSIndex survey.[37]
- 31% of CMPC Pulp customer interactions generated a complaint in 2024, down from 38% in 2023.[37]
- UPM Pulp’s latest customer survey produced an NPS of 46 from approximately 500 customer contacts, versus an industry benchmark average of 39.[38]
- 76% of Suzano’s pulp customers were very or completely satisfied in the company’s 2021 survey, which covered 45 customers representing 70.8% of sales volume.[21]
Customer loyalty in the pulping industry
- CMPC Pulp’s NPS was 87% in 2020, according to the company’s historical customer-experience series.[37]
- CMPC Pulp’s NPS was 86% in 2019, according to the company’s historical customer-experience series.[37]
- 90% of CMPC Pulp customers reported loyalty in 2024, compared with 91% in 2023, in the company’s customer survey.[37]
- CMPC Pulp reported a customer-loyalty NPS of 90% in its 2023 SSIndex assessment.[37]
- CMPC Pulp’s NPS was 88% in 2021, according to the company’s historical customer-experience series.[37]
09 Statistics
Marketing & Brand
The section focuses on survey coverage and influencer-marketing benchmarks relevant to pulp and packaging demand signals.
Digital marketing in the pulping industry
- 17 countries were included in the 2025 global consumer research on print, paper, paper-based packaging and tissue products.[39]
- 1,000 United Kingdom consumers were surveyed in the 2023 Two Sides Trend Tracker research on paper and paper-based products.[39]
- 1,000 German consumers were surveyed in the 2023 Two Sides Trend Tracker research on paper and paper-based products.[39]
- 1,000 French consumers were surveyed in the 2023 Two Sides Trend Tracker research on paper and paper-based products.[39]
- 1,000 Italian consumers were surveyed in the 2023 Two Sides Trend Tracker research on paper and paper-based products.[39]
Branding in the pulping industry
- 63% of U.S. consumers surveyed in 2018 said they would purchase paper- or cardboard-packaged products so they could reuse the packaging.[40]
- 75% of U.S. consumers surveyed in 2018 said paper and cardboard packaging allows more creative designs than other packaging materials.[40]
- 78% of U.S. consumers surveyed in 2018 were more likely to buy paper- or cardboard-packaged products because they considered them better for the environment.[40]
- 71% of U.S. consumers surveyed said in 2018 that they were more likely to buy brands packaged in paper or cardboard than in other materials.[40]
- 49% of U.S. consumers surveyed in 2018 said they would pay a little more for products packaged in paper or cardboard.[40]
Influencer Marketing in the chemicals and materials sector (sector benchmark)
- Across B2B companies, 55% of marketers used creators in 2025, based on a March 2025 Ipsos survey of 1,500 marketing professionals.[41]
- Across B2B companies, 81% of marketers had a dedicated influencer-marketing budget in a September 2024 U.S. survey of firms with at least 100 employees.[42]
- Across B2B companies, 43% of marketers reported outstanding results from influencer programs in the 2025 B2B Influencer Marketing Report.[43]
- Across B2B companies, 56% of marketers identified social-media posts as the most effective influencer-program content type in a September 2024 U.S. survey.[42]
- In U.S. manufacturing, 19% of marketers used influencer marketing among paid channels in the prior 12 months, according to a 2025 industry benchmark.[44]
10 Statistics
Operations & Execution
The section quantifies energy, output ramp, and process variability; it includes 87 days for Suzano’s Ribas do Rio Pardo mill to reach designed daily production capacity.
Process optimization in the pulping industry
- 4,000 kWh of steam were consumed per tonne of chemical pulp by UPM pulp mills in 2024.[22]
- 87 days after starting operations, Suzano’s Ribas do Rio Pardo mill reached its designed daily production capacity.[45]
- 590 kWh of electricity were consumed per tonne of chemical pulp by UPM pulp mills in 2024.[22]
- 5–10% throughput gains were reported for successful digital innovators in pulp and paper production.[13]
- 180 MW of surplus electricity is expected on average from Suzano’s Ribas do Rio Pardo pulp mill.[6]
Operational efficiency in the pulping industry
- 20,200 GWh of steam were consumed by UPM pulp mills in 2024.[22]
- 3,000 GWh of electricity were consumed by UPM pulp mills in 2024.[22]
- 5 million tonnes of chemical pulp were produced by UPM in 2024.[22]
- 71 million tonnes of wood pulp were exported globally in 2023.[46]
- 5.04 million tonnes of chemical pulp were produced by UPM pulp mills in 2024.[22]
Quality management in the pulping industry
- 100% of Bracell’s pulp-mill operations are certified to ISO 9001:2015 for quality management.[47]
- 0.49 was the kappa number measured after the PO15 bleaching stage for K32 softwood kraft pulp in a laboratory study.[48]
- 28±3 is the specified kappa-number range for unbleached pulp in a documented Indian pulp-mill quality-control system.[4]
- 15 ppm is the maximum specified speck count for pulp in a documented Indian pulp-mill quality-control system.[4]
- 100% of SCA’s Östrand pulp production is quality-certified under ISO 9001.[49]
Supply chain in the pulping industry
- 25 destination countries received Indonesian wood pulp in 2022.[50]
- 43% of Indonesian pulp production was processed domestically in 2022.[50]
- 134.1 million cubic metres of U.S. roundwood pulpwood were produced in 2023.[51]
- 15.7% was the decline in U.S. roundwood pulpwood production from 2022 to 2023.[51]
- 5.61 million tonnes of pulp were exported by Indonesia in 2022.[50]
Outsourcing / Offshoring in the chemicals and materials sector (sector benchmark)
- Across 22 EU countries and Norway, 72.8% of enterprises engaged in international sourcing moved business functions to other EU countries during 2021–2023.[52]
- Across North American specialty chemicals, 50% of customer respondents actively drove onshoring projects with suppliers but reported no success in 2025.[53]
- Across North American specialty chemicals, 43% of customer respondents actively drove onshoring projects with suppliers and achieved some success in 2025.[53]
- Across North American specialty chemicals, 50% of customer respondents were actively pushing onshoring projects in 2025.[53]
- Across 22 EU countries and Norway, 34.1% of enterprises engaged in international sourcing cited labour-cost reduction as a motivation during 2021–2023.[52]
11 Statistics
Finance & Pricing
The section compiles pulp pricing points and margins, including Mercer’s average 2025 NBSK pulp list price of $1,710 per tonne in North America.
Pricing strategy in the pulping industry
- $1,356 per ADMT was Mercer’s average 2024 NBHK pulp list price in North America, compared with $1,227 in 2023.[20]
- $1,710 per tonne was Mercer’s average 2025 NBSK pulp list price in North America, up 4% from 2024 before customer discounts and rebates.[54]
- $1,519 per ADMT was Mercer’s average 2024 NBSK pulp list price in Europe, compared with $1,257 in 2023.[20]
- $771.66 per tonne was the 2024 year-end NBSK pulp price in China reported by Arauco, up 3.5% during the year.[55]
- $1,646 per ADMT was Mercer’s average 2024 NBSK pulp list price in North America, compared with $1,448 in 2023.[20]
Cost reduction in the pulping industry
- R$200 per tonne was Suzano’s 2024 fixed-cost component of pulp cash cost, excluding scheduled maintenance stoppage costs.[54]
- More than $250,000 per machine was the average annual energy-saving opportunity across 20 evaluated tissue and towel machines in North America.[56]
- R$814 per tonne was Suzano’s 2024 wood-cost component of pulp cash cost, excluding scheduled maintenance stoppage costs.[54]
- R$149 per tonne was Suzano’s 2024 reduction in fiber cost attributed to Project Caetê synergies.[54]
- R$207 per tonne was Suzano’s 2024 chemicals-cost component of pulp cash cost, excluding scheduled maintenance stoppage costs.[54]
Profitability in the pulping industry
- R$1,745 per tonne was Suzano’s pulp adjusted EBITDA in the fourth quarter of 2024.[21]
- €202.4 million was Kemira’s 2024 Pulp & Paper segment cash flow after investing activities.[57]
- 51% was Suzano’s adjusted EBITDA margin for pulp in the fourth quarter of 2024.[21]
- 14.3% was Kemira’s 2024 operative ROCE for its Pulp & Paper segment.[57]
- R$1,921 per tonne was Suzano’s 2024 pulp adjusted EBITDA per tonne, compared with R$1,487 in 2023.[21]
Financial planning in the pulping industry
- $730 million was Clearwater Paper’s additional debt raised to fund the Augusta acquisition in May 2024.[55]
- €519.2 million was Kemira’s Pulp & Paper segment cash and cash equivalents at December 31, 2024.[57]
- $224.1 million was Clearwater Paper’s liquidity at June 30, 2024, comprising availability under its asset-based lending facility and unrestricted cash.[55]
- 1.66 was UPM’s net-debt-to-EBITDA ratio at the end of 2024.[22]
- €547.1 million was Kemira’s Pulp & Paper segment interest-bearing non-current financial liabilities at December 31, 2024.[57]
12 Statistics
Product & Service
The section captures adjacent inputs and R&D or services revenue; it includes Valmet reporting €1.900 billion services revenue in 2024.
Product development in the pulping industry
- NT$27.70 million was reported as an additional research-and-development investment by Chunghwa Pulp Corporation in 2025.[25]
- 1.39 million air-dried metric tonnes of wood pulp were purchased by Procter & Gamble globally in 2024.[58]
- 4.75% of revenue was spent on research and development by Shandong Chenming Paper Holdings in 2024.[25]
- 4.38% of revenue was spent on research and development by Shandong Chenming Paper Holdings in 2023.[25]
- 32.7 million tonnes of pulp were produced in the Cepi region in 2023, providing the feedstock base for regional product development.[59]
Product lifecycle in the pulping industry
- 10.7% of wood consumed by the Cepi pulp and paper industry was imported in 2024.[59]
- 86.6% of paper-based packaging was recycled in Europe in 2023.[59]
- 78.7 million tonnes of total paper and board were produced in the Cepi region in 2024.[59]
- 0.24 tonnes of CO2 were emitted per tonne of product by the Cepi pulp and paper industry in 2024.[59]
- 52.13 million tonnes of paper for recycling were collected in the Cepi region in 2024.[59]
After-sales in the pulping industry
- 51% of ANDRITZ Pulp & Paper revenue came from services in 2024.[45]
- €1.900 billion of services revenue was reported by Valmet in 2024 across its businesses serving pulp, paper, packaging and tissue producers.[12]
- €1.152 billion of Paper net sales were recorded by Valmet in 2024.[12]
- €1.067 billion of Pulp and Energy net sales were recorded by Valmet in 2023.[12]
- €1.446 billion of Process Performance Solutions net sales were recorded by Valmet in 2024, including automation-related support for process industries.[12]
Value proposition in the pulping industry
- 5.5% of Cepi’s 2024 paper and board production consisted of wrapping products.[59]
- 22% of Procter & Gamble’s purchased wood pulp came from the United States in 2025.[58]
- 48.0% of Arauco and Constitution Pulp’s consolidated revenue came from pulp sales in 2025.[55]
- 16.3% of Cepi’s 2024 paper and board production consisted of other packaging and paper products.[59]
- 42% of ANDRITZ Group revenue came from Pulp & Paper in 2024.[45]
13 Statistics
Sustainability & Ethics
The section quantifies waste, recycled content, supplier audits, and emissions; it includes Bracell landfill disposal of 27.1 kg per air-dried tonne of pulp in 2024.
Sustainability in the pulping industry
- 27.1 kg of industrial waste per air-dried tonne of pulp were sent to landfill by Bracell in 2024.[60]
- 28 m³ of water were consumed per tonne of paper at UPM’s communication-paper mills in 2024.[22]
- 93% of waste from UPM’s paper mills was recycled or recovered as energy in 2024.[22]
- 47.3% of fiber and wood residuals used in products manufactured by U.S. pulp and paper mills came from recycled fiber and residuals in 2022.[61]
- The U.S. paper-and-paperboard utilization rate rose from 36.9% in 2012 to 43.8% in 2021.[62]
ESG in the pulping industry
- 10% of CMPC’s annual purchases came from suppliers analyzed under sustainability criteria in 2024.[37]
- 86% of P&G’s Family Care wood pulp was FSC-certified in fiscal 2025.[58]
- 833 domestic CMPC suppliers were assessed using sustainability criteria in 2024.[37]
- Five Stora Enso production units operated in areas classified as having high baseline water stress in 2024.[5]
- P&G purchased 1.41 million air-dried metric tonnes of wood pulp in 2025.[58]
Ethics in the pulping industry
- 97 UPM supplier audits covering social, environmental and human-rights risks were completed globally in 2024.[63]
- 100% of CMPC’s suppliers providing services to its pulp and timber subsidiaries were covered by the company’s general supplier assessment in 2024.[37]
- 100% of P&G tier-one suppliers by procurement spend were required to comply with its forest-commodities environmental requirements in 2024.[64]
- 187 CMPC strategic suppliers had corrective-action plans in 2024.[37]
- Approximately 549 social and environmental findings were recorded in UPM supplier audits in 2024.[63]
CSR in the pulping industry
- 14 training hours per employee were reported by Smurfit Westrock in 2024.[65]
- Nine community projects received Bracell funding through its 2025 social-proposal program.[47]
- 15,938 contractors worked directly in Bracell’s pulp and paper operations in 2025.[47]
- 9% was the reported 2025 income improvement for families participating in Bracell income-generation projects compared with 2024.[47]
- 137,000 hours were worked without a recordable injury by Domtar employees and contractors on the Hawesville mill project in 2024.[66]
Circular economy in the pulping industry
- Recovered-paper utilization in the United States increased from 36.9% in 2012 to 43.8% in 2021.[62]
- The U.S. paper-and-paperboard recovery rate averaged 66% from 2011 to 2021.[62]
- 32.7 million tons of recycled paper were consumed by U.S. mills in 2024.[67]
- The U.S. cardboard recycling rate was reported at 69%–74% in 2024.[67]
- Approximately 46 million tons of paper and paperboard were recovered in the United States in 2024.[67]
Carbon footprint in the pulping industry
- International Paper targets a 35% reduction in absolute Scope 1, 2 and 3 greenhouse-gas emissions by 2030.[31]
- Bracell reduced carbon emissions per tonne of product by 47% between 2020 and 2025.[60]
- International Paper reports that a unit of water is reused 10 or more times in a typical modern pulp mill.[31]
- Bracell’s preserved native forests removed 1.6 million tonnes of CO₂ equivalent in 2025.[47]
- Stora Enso’s pulp, board and paper operations withdrew 401 million m³ of water in 2024.[5]
14 Statistics
Risk, Compliance & Legal
The section reports compliance and data/privacy capability signals, including $7.4 million in environmental penalties assessed in the five years through April 2025.
Compliance in the pulping industry
- 98% of UPM’s 6,700-person target group completed anti-corruption e-learning in 2024.[22]
- 110 U.S. paper-product facilities reported 9.7 million metric tons of CO₂e in 2023.[68]
- 63 of 183 U.S. pulp and paper plants with available data had a federal, state or local violation during the three years through April 2025.[69]
- $7.4 million in environmental penalties were assessed against U.S. pulp and paper facilities during the five years through April 2025.[69]
- 91% of UPM’s supplier spend was covered by its Supplier and Third-Party Code in 2024.[22]
Risk Management in the chemicals and materials sector (sector benchmark)
- 25% of companies managing chemicals rated failure to stay current with regulations as a high risk in the 2024 survey.[70]
- 40% of companies managing chemicals lacked full visibility into chemical ingredients used in their products and processes in 2024.[70]
- 75% of companies managing chemicals identified staying current with regulations as a risk in the 2024 chemicals management and sustainability survey.[70]
- 64% of companies managing chemicals said suppliers provided only partial information when they responded to information requests in 2024.[70]
- 75% of companies managing chemicals did not receive consistent responses from suppliers when requesting chemical-substance information in 2024.[70]
Cybersecurity in the chemicals and materials sector (sector benchmark)
- 88% of chemical-industry respondents in the Americas carried standalone cyber insurance in Moody’s 2023 survey.[71]
- 70% of global chemical-industry respondents carried standalone cyber insurance in Moody’s 2023 cyber survey.[71]
- 60% of EMEA chemical-industry respondents carried standalone cyber insurance in Moody’s 2023 survey.[71]
- 91% of surveyed chemical companies updated their cyber incident-response plans at least annually in 2023.[71]
Data Privacy in the chemicals and materials sector (sector benchmark)
- 38% of manufacturing companies had fully implemented third-party privacy certifications in 2026, nine percentage points below the 47% global benchmark.[72]
- 41% of manufacturing companies had fully implemented supply-chain and vendor privacy assessments in 2026, compared with 49% across all surveyed industries globally.[72]
- 49% of manufacturing companies had fully implemented data inventory and mapping in 2026, matching the global benchmark; the survey covered 233 manufacturing privacy professionals worldwide.[72]
- 50% of manufacturing companies had fully implemented breach notification processes in 2026, according to a global survey of 233 manufacturing privacy professionals.[72]
- 29% of manufacturing companies reported fully integrated privacy tooling in 2026, compared with 39% globally in TrustArc’s survey of privacy professionals.[72]
Crisis Management in the chemicals and materials sector (sector benchmark)
- 40% of chemical and high-risk-sector respondents identified an opportunity to improve their capability to coordinate a wider crisis response.[73]
- 28% of chemical and high-risk-sector companies reported under-prioritizing crisis management in the CHEMTREC industry survey.[73]
- 63% of chemical and high-risk-sector companies said crisis planning was coordinated by management or departmental teams rather than at C-suite level.[73]
- Less than 3% of chemical and high-risk-sector companies employed a full-time crisis-management professional.[73]
- 61% of chemical and high-risk-sector companies did not understand how their business-continuity plans and crisis-management systems worked together.[73]
Governance in the pulping industry
- 70% of International Paper’s board members were men at December 31, 2024.[31]
- 99% of UPM’s 6,700-person target group completed confidentiality e-learning in 2024.[22]
- 16 internal whistleblower reports were recorded by Japan Pulp & Paper and its Japanese consolidated subsidiaries in fiscal 2024.[74]
- 99% of UPM’s 6,700-person target group completed cybersecurity e-learning in 2024.[22]
- 99% of UPM’s 160-person target group completed Insider Policy e-learning in 2024.[22]
15 Statistics
Globalization & Expansion
The section quantifies trade flows and export destinations, including 19 million tonnes of Brazilian pulp exported in 2024.
Globalization in the pulping industry
- China represented 43.6% of Brazilian pulp export destinations in 2024.[75]
- 19 million tonnes of Brazilian pulp were exported in 2024, the highest export volume among listed countries.[75]
- 72.24 million tonnes of pulp were imported globally in 2024, with China accounting for 30.26 million tonnes.[76]
- Asia received 67.8% of market-pulp exports from Cepi countries in 2024, equal to 4.323 million tonnes.[77]
- 38.5% of global pulp crossed an international border in 2024, according to FAO-based trade analysis.[76]
Supplier management in the pulping industry
- Lenzing produced approximately 1.176 million tonnes of dissolving wood pulp at its pulp plants in 2024.[78]
- Nippon Paper procures wood chips from approximately 20 overseas suppliers, including affiliated companies.[79]
- YFY’s green procurement of raw materials reached NT$10.3 billion in 2025.[36]
- YFY completed 1,018 supplier evaluations in 2025, including 1,015 low-risk Grade A evaluations.[36]
- 100% of wood used by Lenzing’s pulp sites in 2024 came from PEFC- or FSC-certified or controlled sources.[78]
Stakeholder management in the pulping industry
- Domtar’s Plymouth pulp mill employed 351 people in North Carolina at the time of its published mill profile.[66]
- Domtar’s Plymouth pulp mill generates more than $800 million in economic impact in North Carolina.[66]
- Chunghwa Pulp recorded 190 volunteer-participation person-times in public-welfare projects in 2025.[25]
- Chunghwa Pulp reported NT$1.2 million in mill supplies and donations for local contributions in 2025.[25]
- Chunghwa Pulp delivered 22 environmental-education sessions reaching 991 people in 2025.[25]
Distribution channels in the pulping industry
- Arauco’s Europe sales represented 13% of pulp sales volume in the twelve months ended March 2026.[80]
- Arctic Paper’s pulp sales in 2024 comprised 36% Nordic countries, 29% overseas countries and 13% Germany.[81]
- Arauco’s Asia sales represented 76% of pulp sales volume in the twelve months ended March 2026.[80]
- Asia generated R$15.761 billion, or 42.0%, of Bracell’s 2024 pulp net sales.[55]
- North America generated R$6.966 billion, or 18.5%, of Bracell’s 2024 pulp net sales.[55]
Key questions about the pulping industry
How large is global wood pulp production and trade in the latest measured year?
What growth outlook applies to the broader pulp and paper market in 2026?
Which companies lead the pulping industry?
What technology shifts are showing up in pulp-and-paper operations?
How concentrated is market pulp capacity among major producers?
How volatile are pulp pricing signals in recent benchmarks?
Cite This Report
This report is designed to be cited. We maintain stable URLs and versioned verification dates. Copy the format appropriate for your publication below.
Samuel Norberg. (2026, November 10). Pulping Industry Statistics. Gitnux. https://gitnux.org/pulping-industry-statistics
Samuel Norberg. "Pulping Industry Statistics." Gitnux, 10 Nov 2026, https://gitnux.org/pulping-industry-statistics.
Samuel Norberg. 2026. "Pulping Industry Statistics." Gitnux. https://gitnux.org/pulping-industry-statistics.
Sources & references
91 sources cited across this report
- runb3.com
- eralberta.ca
cdn.skfmediahub.skf.com
- ippta.co
storaenso.com
suzano.com.br
monitor-industrial-ecosystems.ec.europa.eu
s3.us-east-1.amazonaws.com
ibm.com
cefic.org
cdn-s3.sappi.com
valmet.com
mckinsey.com
help.fastmarkets.com
bakerhughes.com
utah.ismworld.org
- manufacturingleadershipcouncil.com
dnb.com
- gpca.org.ae
mercerint.com
s201.q4cdn.com
upm.com
prnewswire.com
- financialfilings.com
canfor.com
fpi.org
euwid-paper.com
- insiderdelta.com
internationalpaper.com
- links.sgx.com
kpmg.com
naceweb.org
gallup.com
- esg.yfy.com
- cmpcpulp.com
ifpta.memberclicks.net
twosides.info
ipsos.com
business.linkedin.com
marketingprofs.com
toprankmarketing.com
contentmarketinginstitute.com
andritz.com
- bdd.pseau.org
centraldeindicadores2025.bracell.com
degruyterbrill.com
sca.com
resources.trase.earth
unece.org
- 5418442.fs1.hubspotusercontent-na1.net
docs.publicnow.com
sec.gov
assets.focusonenergy.com
mb.cision.com
pginvestor.com
sustainability.cepi.org
afandpa.org
ncasi.org
- upmpaper.com
smurfitkappa.com
domtar.com
recycledmaterials.org
epa.gov
environmentalintegrity.org
enhesa.com
ismg-cdn.nyc3.cdn.digitaloceanspaces.com
trustarc.com
chemtrec.com
- kamipa.co.jp
iba.org
- ossianocapital.com
reports.lenzing.com
nipponpapergroup.com
arauco.com
attachment.news.eu.nasdaq.com
fao.org
fortunebusinessinsights.com
hawkinswright.com
cmpc.com
aprilasia.com
rs2025.klabin.com.br
eldoradobrasil.com.br