
Ontario issued 112,400 residential building permits worth $32.8 billion in 2023, alongside 89,600 multi-unit housing units permitted the same year. Non-residential activity also remained substantial, with institutional permits totaling $19.6 billion in 2022. These figures frame how permit volume and project types shifted across Ontario’s construction pipeline.
Key Takeaways
- Residential building permits issued: 112,400 units valued at $32.8 billion in 2023.
- Construction contributed $48.2 billion to Ontario's GDP in 2022, or 7.4% of provincial total.
- Fatalities in Ontario construction: 32 in 2022, rate of 7.1 per 100,000 workers.
- Construction outlook: 210,000 net new workers needed by 2033.
- In 2022, Ontario's construction sector employed 452,300 workers, accounting for 5.8% of total provincial employment and marking a 2.7% increase from 2021.
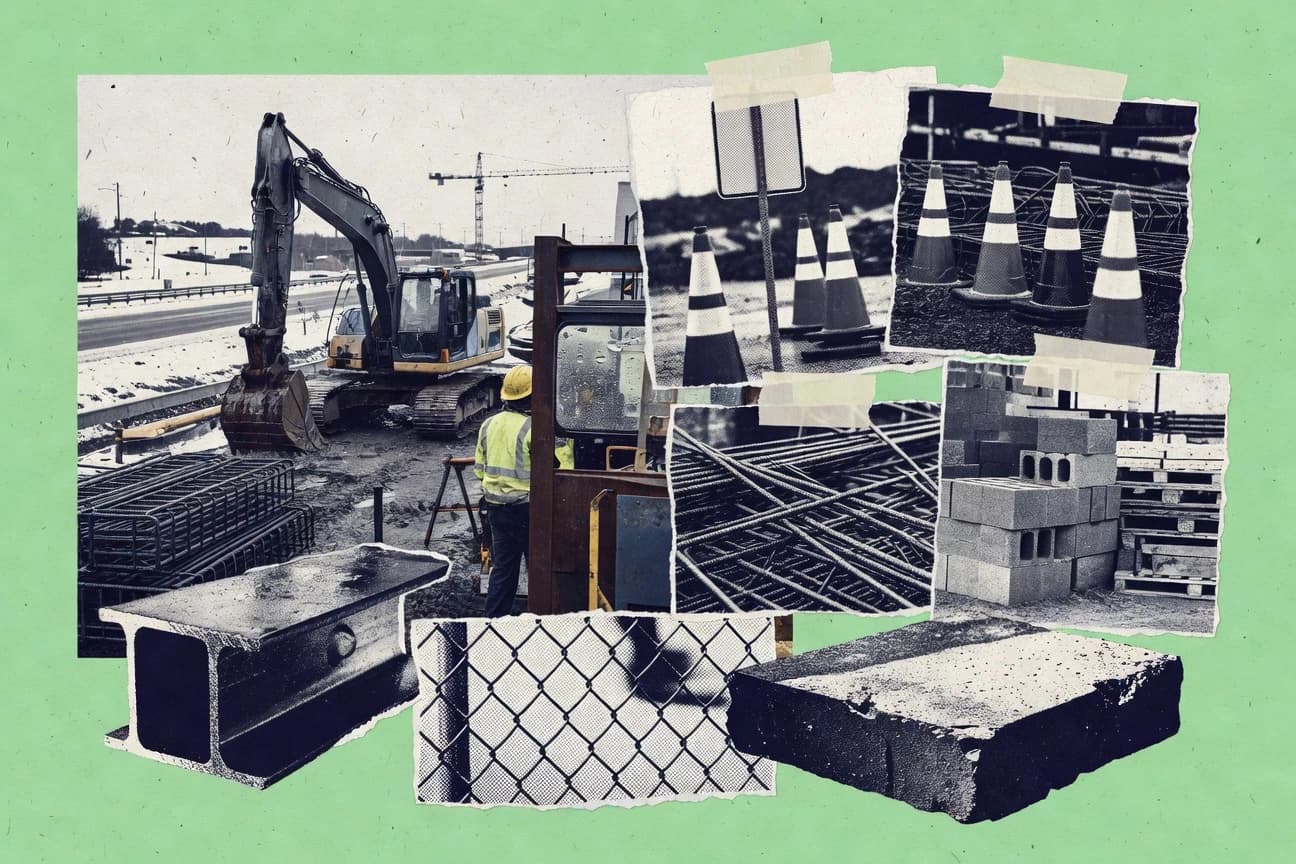
Construction activity in Ontario remains strong, with steady growth in new building projects.
Related reading
01 · Category
Construction Volumes And Permits28 stats
01
Residential building permits issued: 112,400 units valued at $32.8 billion in 2023.
02
Total building permits value in Ontario: $52.1 billion in 2022, up 9.4%.
03
Housing starts: 78,500 units in Greater Toronto Area in 2023.
04
Non-residential permits: $19.6B for institutional buildings in 2022.
05
Industrial construction starts: 45.2 million sq ft in 2023.
06
Road and highway projects: 1,250 km under construction in 2023.
07
New single-family homes: 28,900 starts valued at $12.4B in 2022.
08
Multi-unit residential: 89,600 units permitted in 2023.
09
Commercial permits value: $8.7B in GTA 2023.
10
Hospital expansions: 2.1 million sq ft permitted in 2022.
11
Transit projects under construction: 145 km of rail/LRT in 2023.
12
Renovation permits: $14.2B value province-wide in 2022.
13
Data centre construction: 1.8 million sq ft new builds 2023.
14
School construction: 450,000 sq m added in 2022-2023.
15
Bridge projects: 320 structures rehabilitated/new in 2023.
16
Apartment completions: 42,300 units in 2023.
17
Retail space permits: 3.2 million sq ft in 2022.
18
Water treatment plants: 15 major upgrades valued at $2.1B 2023.
19
Absorption rate for industrial space: 18.5 million sq ft in GTA 2023.
20
Condo inventory under construction: 156,000 units in 2023.
21
Energy infrastructure: 450 MW solar farms permitted 2022.
22
Office completions: 1.9 million sq ft added in 2023.
23
Heritage restoration projects: 1,200 sites worked on in 2022.
24
Park expansions: 2,500 hectares new green space via construction 2023.
25
Total sq footage permitted: 145 million sq ft non-residential 2022.
26
Demolition permits issued: 12,400 structures in 2023.
27
GO Expansion rail: 60 km track laid in 2023 phase.
28
Hwy 401 widening: 35 km completed segments 2022.
Interpretation
Construction Volumes And Permits Interpretation
In Ontario’s construction volumes and permits, the scale of new activity is clear with 112,400 residential building permits totaling $32.8 billion in 2023 and housing starts of 78,500 units in the Greater Toronto Area, showing that demand is staying strongly supported on both the permitting and ground level.
02 · Category
Economic And Financial29 stats
01
Construction contributed $48.2 billion to Ontario's GDP in 2022, or 7.4% of provincial total.
02
Total industry revenue reached $142.5 billion in 2022, up 6.8% from prior year.
03
Residential construction subsector generated $32.1 billion in value added in 2022.
04
Non-residential building construction: $18.7 billion GDP contribution in 2023.
05
Engineering construction added $14.9 billion to GDP in 2022.
06
Average profit margin for Ontario construction firms: 4.2% in 2023.
07
Total capital investment in construction: $112.4 billion in 2022.
08
Tax revenues from construction: $12.6 billion to provincial coffers in 2022.
09
Multiplier effect: every $1M construction spending generates $1.8M economic activity.
10
Export value of construction services: $2.3 billion in 2022.
11
Cost inflation in materials hit 11.2% YoY in 2023.
12
Average project value for large firms: $45.6 million in 2022.
13
SME construction firms (under 20 employees) generated 28% of sector revenue.
14
Debt-to-equity ratio average: 1.45 for Ontario contractors in 2023.
15
Insurance premiums total: $3.8 billion paid by industry in 2022.
16
R&D spending by construction firms: 0.8% of revenue or $1.14B in 2022.
17
Government contracts value: $28.9 billion awarded in 2023.
18
Private investment share: 62% of total construction spending in 2022.
19
Bankruptcy rate among contractors: 2.1% in 2023, lowest in 5 years.
20
Bonded project value: $76.2 billion in 2022.
21
Labour costs as % of total expenses: 38.4% in 2023.
22
Material costs share: 42% of budgets, up from 35% pre-pandemic.
23
Overhead costs averaged 12.7% of revenue in 2022.
24
Cash flow challenges reported by 48% of firms in 2023 survey.
25
Financing costs rose 15% YoY to $4.2B total in 2023.
26
Value of mergers/acquisitions: $1.9B in construction sector 2022.
27
Charitable contributions by industry: $156M in 2022.
28
Total assets held by construction firms: $289B in 2022.
29
ROI on infrastructure projects averaged 4.8% in 2023.
Interpretation
Economic And Financial Interpretation
Ontario’s construction sector is a strong economic engine, contributing $48.2 billion to GDP in 2022 and bringing total revenue to $142.5 billion in 2022 with a modest 4.2% average profit margin in 2023, reflecting solid growth alongside tight financial returns.
03 · Category
Health, Safety, And Regulations30 stats
01
Fatalities in Ontario construction: 32 in 2022, rate of 7.1 per 100,000 workers.
02
Lost-time injuries: 12,450 claims totaling 2.1 million lost days in 2023.
03
Fall from heights incidents: 1,856 cases, 28% of all serious injuries 2022.
04
WSIB premiums paid by construction: $2.8 billion in 2023.
05
Musculoskeletal disorders: 42% of claims, 5,240 incidents in 2022.
06
Compliance audit pass rate: 78% for safety inspections in 2023.
07
Heat-related illnesses: 340 reports during 2023 summer.
08
Crane incidents: 56 tip-overs/collapses investigated 2022.
09
Silica exposure violations: 210 fines totaling $1.2M in 2023.
10
Training hours mandated: 16 per worker annually, 7.2M total delivered 2022.
11
Mental health claims: 890 accepted, up 22% YoY in 2023.
12
PPE non-compliance citations: 4,500 in 2022 blitzes.
13
Electrocutions: 14 fatalities, all preventable per MOL reports 2023.
14
Trench collapse incidents: 76, with 4 deaths in 2022.
15
Safety certification holders: 89% of firms WHMIS compliant 2023.
16
Noise-induced hearing loss claims: 1,120 in 2022.
17
COVID-19 outbreaks: 245 sites closed temporarily 2022.
18
Fatigue-related incidents: 620 reports in 2023.
19
Hazardous materials incidents: 340 spills/releases 2022.
20
Working at heights training completed by 312,000 workers 2023.
21
Fine total for violations: $18.7M assessed in 2022.
22
Stop-work orders issued: 2,450 across province 2023.
23
Respiratory illness claims from dust: 890 in 2022.
24
Vehicle/equipment collisions: 1,450 incidents 2023.
25
Safety officer employment: 12,400 full-time equivalents 2022.
26
Near-miss reporting rate: 45,000 logged in 2023.
27
Ergonomic assessments conducted: 5,600 sites 2022.
28
Fire/explosion incidents: 210 claims totaling $45M damage 2023.
29
Confined space violations: 1,200 citations 2022.
30
Injury rate per 100 workers: 2.8 lost-time in 2023.
Interpretation
Health, Safety, And Regulations Interpretation
Even though Ontario construction safety inspections achieved a 78% pass rate in 2023, the industry still saw 12,450 lost-time injury claims in 2023 and 28% of serious injuries from falls from heights in 2022, showing that improving compliance alone has not yet translated into fewer high-risk incidents.
More related reading
04 · Category
Trends And Projections29 stats
01
Construction outlook: 210,000 net new workers needed by 2033.
02
Residential demand to grow 2.1% annually to 2031.
03
Infrastructure spending forecast: $190B over next decade.
04
Labour shortage peak: 75,000 openings by 2029.
05
Green building certifications to rise 45% by 2030.
06
Prefab/modular construction share: 15% by 2028.
07
Digital twin adoption: 32% of large projects by 2027.
08
Electrification projects: 25% growth in EV infrastructure to 2030.
09
BIM usage: 68% of firms by 2025 projection.
10
Net-zero buildings: 40% of new starts by 2035.
11
Supply chain disruptions to ease, costs down 3% annually post-2025.
12
Aging workforce exit: 112,000 retirements by 2031.
13
Immigration to fill 35% of demand, 73,500 workers.
14
Industrial space demand: 25M sq ft/year to 2030.
15
Housing shortage: 1.5M units needed by 2031.
16
Automation/robotics: 22% productivity boost by 2030.
17
Climate-resilient projects: 50% mandate by 2028.
18
Data centres boom: 5GW capacity addition by 2030.
19
Transit expansion: 500km new lines by 2041.
20
Renovation market: $25B annually growing 4%.
21
Timber construction rise: 18% of mid-rise by 2027.
22
AI in scheduling: adopted by 55% firms by 2026.
23
Women in trades: 20% target by 2030.
24
Carbon pricing impact: 8% cost increase mitigated by tech.
25
3D printing projects: 10% of small builds by 2028.
26
Supply chain localization: 65% materials from Ontario by 2030.
27
Mega-projects pipeline: $75B value over 10 years.
28
Skills training investment: $2B provincial fund to 2030.
29
Energy retrofits: 300,000 buildings by 2035.
Interpretation
Trends And Projections Interpretation
Ontario’s construction sector is poised for rapid growth in the Trends And Projections outlook, with demand set to require 210,000 net new workers by 2033 and infrastructure investment reaching $190B over the next decade.
05 · Category
Workforce And Employment30 stats
01
In 2022, Ontario's construction sector employed 452,300 workers, accounting for 5.8% of total provincial employment and marking a 2.7% increase from 2021.
02
The average hourly wage for construction workers in Ontario was $32.45in 2022, 15% higher than the provincial average across all industries.
03
Women represented 12.3% of the Ontario construction workforce in 2023, up from 10.8% in 2019, with 55,700 female workers employed.
04
There were 28,400 apprentices registered in Ontario's construction trades in 2022, comprising 6.3% of the total workforce.
05
Indigenous workers made up 4.1% of Ontario's construction employment in 2022, totaling 18,500 individuals, with targeted hiring programs boosting numbers by 8% YoY.
06
In 2023, 67% of Ontario construction firms reported labour shortages, affecting 192,000 job openings unfilled for over 3 months.
07
Youth aged 15-24 accounted for 14.2% of new hires in Ontario construction in 2022, with 64,200 entering the sector.
08
Unionized workers comprised 42% of Ontario's construction workforce in 2022, equating to 190,000 members across major trades.
09
Immigrants filled 22.5% of new construction jobs in Ontario in 2023, totaling 101,600 workers from recent immigration waves.
10
The sector's total employment hours in Ontario reached 1.2 billion in 2022, a 4.1% rise driven by residential projects.
11
Self-employed construction workers in Ontario numbered 89,200 in 2022, representing 19.7% of the total workforce.
12
In 2023, 35% of Ontario construction workers held Red Seal certifications, totaling 158,300 certified tradespeople.
13
Older workers (55+) made up 24.8% of the workforce in 2022, with 112,100 individuals facing retirement pressures.
14
Temporary foreign workers in Ontario construction hit 15,700 in 2023, a 12% increase aiding infrastructure builds.
15
Part-time employment in the sector was 8.4% of total jobs in 2022, with 38,000 workers in flexible roles.
16
Ontario construction unemployment rate stood at 6.2% in 2023, below the national average of 7.1%.
17
76,500 new workers entered Ontario construction via training programs in 2022-2023.
18
Visible minorities comprised 28.7% of the workforce in 2022, up 5% from 2016 census data.
19
Heavy equipment operators numbered 42,300 in Ontario construction in 2023.
20
Carpenters and joiners totaled 112,400 employed in 2022.
21
Electrical trades workers: 68,900 in Ontario construction workforce 2023.
22
Plumbers and pipefitters: 34,200 employed in 2022.
23
Labour turnover rate in Ontario construction was 18.4% in 2023.
24
52% of firms reported hiring challenges due to skills gaps in 2023.
25
Average tenure for construction workers in Ontario: 7.2 years in 2022.
26
Overtime hours averaged 4.8 per week for 65% of workers in 2023.
27
Remote work adoption in construction admin roles: 12% in 2023.
28
Disability employment rate in sector: 3.8% or 17,200 workers in 2022.
29
Gender pay gap in construction: women earned 92% of men's wages in 2022.
30
Total labour demand projected at 512,000 workers by 2031, needing 210,000 net new hires.
Interpretation
Workforce And Employment Interpretation
Ontario’s construction workforce is growing more strained even as inclusion improves, with 67% of firms reporting labour shortages and 192,000 job openings left unfilled for over three months in 2023 while women rose to 12.3% of the workforce in 2023 from 10.8% in 2019.
report visual · Key figures
Ontario construction activity snapshot (permits, starts, infrastructure)
Residential and non-residential activity remains strong while major infrastructure and transit projects are actively underway.
$32.8 billion
Residential building permits issued: 112,400 units valued at $32.8 billion in 2023.
9.4%
Total building permits value in Ontario: $52.1 billion in 2022, up 9.4%.
78,500
Housing starts: 78,500 units in Greater Toronto Area in 2023.
$19.6
Non-residential permits: $19.6B for institutional buildings in 2022.
1,250
Road and highway projects: 1,250 km under construction in 2023.
145
Transit projects under construction: 145 km of rail/LRT in 2023.
Reference
Cite This Report
This report is designed to be cited. We maintain stable URLs and versioned verification dates. Copy the format appropriate for your publication below.
APA
Isabelle Moreau. (2026, February 13). Ontario Construction Industry Statistics. Gitnux. https://gitnux.org/ontario-construction-industry-statistics
MLA
Isabelle Moreau. "Ontario Construction Industry Statistics." Gitnux, 13 Feb 2026, https://gitnux.org/ontario-construction-industry-statistics.
Chicago
Isabelle Moreau. 2026. "Ontario Construction Industry Statistics." Gitnux. https://gitnux.org/ontario-construction-industry-statistics.
Sources & references
51 datasets cited across this report · attribution is report-level
www150.statcan.gc.castatcan.gc.ca buildforce.ca
 ontario.ca
 cca-acc.com
 canada.ca
 red-seal.cawww12.statcan.gc.cajobbank.gc.ca
 ccq.org
 randstad.ca
 ibisworld.com
 altusgroup.comic.gc.ca
 bdc.ca
 fsrao.ca
 suretyassociation.ca
 constructionowners.comboc-boc.gc.ca
 pwc.com
 buildingandconstructioncharities.ca
 pbo-dpb.cacmhc-schl.gc.ca
 toronto.ca
 gta-homes.com
 infrastructureontario.ca
 metrolinx.com
 cbre.caedu.gov.on.ca
 icsc.com
 urbandb.com
 oeb.ca
 colliers.com
 gotransit.com
 wsib.caiwh.on.ca
 tssa.org
 occ-ocm.ca
 ccohs.ca
 wsps.calabour.gov.on.caofc.on.ca
 cagbc.org
 mckinsey.com
 autodesk.com
 nibs.orgnrcan.gc.ca
 deloitte.cominfrastructurecanada.gc.ca
 wood-works.ca
 pembina.org